
 Open Access Article
 This Open Access Article is licensed under a Creative Commons Attribution-Non Commercial 3.0 Unported Licence
A novel ethanol gas sensor based on α-Bi2Mo3O12/Co3O4 nanotube-decorated particles†
Salah Ud Dina,
Mahmood ul Haqa,
Rabia Khatoona,
Xuehua Chena,
Li Lib,
Manjun Zhangb and
Liping Zhu *a
*a
aState Key Laboratory of Silicon Materials, School of Materials Science and Engineering, Cyrus Tang Center for Sensor Materials and Applications, Zhejiang University, Hangzhou 310027, China. E-mail: zjuzlp@163.com; Tel: +86 571 8795 1958
bElectric Power Research Institute of Guangdong Power Grid Co., Ltd, China
First published on 8th June 2020
Abstract
A novel composite based on α-Bi2Mo3O12/Co3O4 nanotube-decorated particles was successfully synthesized using a highly efficient and facile two step system using electrospinning and hydrothermal techniques. The small size Co3O4 nanoparticles were uniformly and hydrothermally developed on the electrospun α-Bi2Mo3O12 nanotubes. The pure α-Bi2Mo3O12 nanofibers and composite based on α-Bi2Mo3O12/Co3O4 were examined using X-ray powder diffraction (XRD), scanning electron microscopy (SEM), energy-dispersive X-ray spectroscopy (EDX), transmission electron microscopy (TEM), high resolution transmission electron microscopy (HRTEM), X-ray photoelectron spectroscopy (XPS) and Brunauer–Emmett–Teller (BET) analyses. From the BET measurements, the composite based on α-Bi2Mo3O12/Co3O4 exhibits a large specific surface area of 54 m2 g−1 with mesopore diameter ranges of 2–10 nm, which is mainly attributed to the remarkable and dominant enhancement in gas sensing as compared to that of the pure α-Bi2Mo3O12 nanofibers (38 m2 g−1) and Co3O4 nanoparticles (32 m2 g−1), respectively. In this work, the novel composite based on α-Bi2Mo3O12/Co3O4 presented a high sensitivity of 30.25 with a quick response/recovery speed towards 100 ppm ethanol at an optimal working temperature of 170 °C, as compared to the pure α-Bi2Mo3O12 nanofibers and Co3O4 nanoparticles, which display a sensitivity of 13.10 and 2.99 at an optimal working temperature of 220 °C and 280 °C. The sensing performance of the composite based on the α-Bi2Mo3O12/Co3O4 sensor exhibits a superior sensing performance towards ethanol, which might be owed to the enormous number of superficial oxygen species, the small size catalytic effect of the Co3O4 nanoparticles and the interfacial effect formed between the n-type α-Bi2Mo3O12 and p-type Co3O4 leading to a high charge carrier concentration. This is a novel investigation of a composite based on an α-Bi2Mo3O12/Co3O4 sensor in the gas sensing era, which might be of vital importance in applications in the advanced gas sensing field.
1 Introduction
A heavy presence of ethanol vapor in the atmosphere might pose serious health effects, such as headaches, lung edema, nausea, liver and kidney problems, eye irritation, problems with breathing and the central nervous system.1,2 Therefore, the investigation of various toxic gases has become an important aspect of life for the protection of human health from different diseases, which gives us a dominant interest in preparing and designing novel friendly and low-cost sensing materials. Over the last few decades, several sensing materials have been observed and promising approaches have been employed to develop superior gas sensors.3,4 However, some of them take a long time to prepare, while others make use of complex equipment and a few reportedly have a low precision.Metal oxide semiconductors (MOS) have shown significant applications in interface materials, being systemically employed for the exposure of various hazardous gases with a low cost and reduced energy consumption.5–9 The most common functional configuration of MOS-based gas sensor devices comprises chemo-resistors and field-effect transistors (FETs).10 Recently, one-dimensional metal oxide nanostructures have gained further attention owing to their unique physio-chemical properties, wide band gap, interesting surface chemistry and high surface to volume ratio, as well as their optical and electrical properties. Over the last couple of years, various kinds of metal oxide sensors such as ZnO,11 In2O3,12 MoO3,13,14 Co3O4 (ref. 15 and 16) and CeO2 (ref. 17) have been successfully fabricated and investigated. Compared to these binary oxides, multicomponent oxides have shown some interesting results, manifesting a greater freedom to tune the physio-chemical properties of the nanomaterials by changing the compositions, which can be tailored to be more appropriate as a gas sensing material.18 Also, some ternary oxide-based bismuth-semiconductors, such as BiVO4, Bi2MO6 (M = Mo, W), BiOX (X = Br, Cl, I),19,20 have been demonstrated to show magnificent behavior for gas sensing applications. One such interesting case is the bismuth-based semiconductors, Bi2Mo3O12 (bismuth molybdates) which possesses three crystallographic phases; α-Bi2Mo3O12, β-Bi2Mo2O9, and γ-Bi2MoO6.21–25 Among these, the alpha bismuth molybdates (α-Bi2Mo3O12) show a particularly selective oxidizing capability, leading to their extensive use in the field of ionic conductors,26 optics,27 photoconductors28 and for gas sensing.29 Moreover, bismuth molybdates are an important class of semiconducting materials that have the general chemical formula Bi2O3 nMoO3, in which n = 1–3. The tertiary oxide based α-Bi2Mo3O12 materials behave as n-type semiconductors with band gap ranges of about 2.5–2.9 eV. Accordingly, they possess three phases (α, β, and γ), such as α-Bi2Mo3O12, β-Bi2Mo2O9 and γ-Bi2MoO6. The specific reason for this is their highly oxygen-deficient fluorite structure (Mo atoms in (MoO4)2− and vacancies with Bi sites) which facilitate possible chemical reactions. The vacancies are in an ordered arrangement with Bi channels and three different Mo sites. Each of them that are coordinated with five O atoms favor the chemical reaction. Bismuth molybdates are potential candidates for ethanol-based gas sensors owing to their interesting characteristics such as their narrow bandgaps, systemized structures and the availability of fast-moving charge carriers, which significantly enhances their gas sensing performance.30,31 Although α-Bi2Mo3O12 depicts a monoclinic structure with various oxygen orderings vis-à-vis the configuration of bismuth atoms (like the possible distribution of oxygen atoms at each bismuth site), leading to the fast mobility of the active lattice oxide ions and a significant re-oxidation ability.32 Co3O4 is a p-type semiconductor with a narrow band gap energy range of 1.6–2.2 eV, which exists in the mixed valence oxides of CoO and Co2O3 with a huge oxygen content and finds its applications in various potential materials such as energy storage,33 catalysis,34 electrochemistry,35 and in the field of gas sensors.36 One important advantage of Co3O4 nanoparticles is the sensitivity of the electric properties to adsorption on the surface species, which optimizes and enhances the sensing performance.37,38
Ternary metal oxides exhibit a greater sensitivity in comparison to binary metal oxides, which have an inadequate exposed area and reduced electron transportation.39 One of the significant and impressive approaches is to combine the different physio-chemical characteristics of metal oxides into a single system. Thus, our approach can be classified as the fabrication of a composite based on n/p-type metal oxide heterostructures.40,41 Moreover, fabrication of a composite based on the formation of heterostructures is a productive way to promote and enhance the gas-sensing performance.
Herein, we report a novel composite sensor based on α-Bi2Mo3O12/Co3O4 nanotube-decorated particles fabricated using a facile, highly efficient, scalable two step system via electrospinning and hydrothermal techniques in order to compare and determine the gas sensitivity features towards various hazardous gases, such as ethanol, acetone, methanol, xylene, toluene, benzene and ammonia. Our detailed findings, including the crystal structure, morphological investigations, elemental composition, surface area and gas sensitivity features of the novel composite based on α-Bi2Mo3O12/Co3O4 nanotube-decorated particles, are comprehensively discussed below.
2 Experimental setup
2.1 Preparation of the electrospun α-Bi2Mo3O12 nanofibers
The alpha bismuth molybdates (α-Bi2Mo3O12) were prepared using a facile electrospun technique followed by a calcination process. During the synthesis process, we first prepared a homogenous solution-A comprising 1.64 mM Bi(NO3)3·5H2O, 0.82 mM of sodium molybdates (Na2MoO4·2H2O) dissolved in 10 ml of 2-methoxyethanol and 0.5 ml ethanolamine (for pH balancing) and subsequently stirred the mixture for at least 2 h. Then, solution-B was prepared using 10.79 mM of PVP (polyvinylpyrrolidone) with a molecular weight (MW) of 130![[thin space (1/6-em)]](https://www.rsc.org/images/entities/char_2009.gif) 000, 11 ml N,N dimethyl formamide (DMF) and 11 ml ethanol under continuous stirring for 1 h to form a translucent gel solution. Finally, solution-A was added drop-wise to solution-B under continuous stirring to obtain a homogeneous α-Bi2Mo3O12 precursor solution for the electrospinning process. Before commencing the electrospinning technique, the gel solution was stored overnight to release the gas bubbles from the precursor solution. Afterwards, the translucent gel solution was loaded into a syringe containing a needle which was made of stainless steel and connected to a high voltage with a range of up to 30 kV. The nanofibers were collected on a flat panel display which had been sealed with aluminum foil. The distance between the needle (anode) and collector (cathode) was maintained at 20 cm with a feeding rate of 0.08 mm min−1 by applying a 15 kV high voltage. Finally, the electrospun PVP α-Bi2Mo3O12 nanofibers were calcined at 500 °C for 2 h in air to obtain pure α-Bi2Mo3O12 nanofibers.
000, 11 ml N,N dimethyl formamide (DMF) and 11 ml ethanol under continuous stirring for 1 h to form a translucent gel solution. Finally, solution-A was added drop-wise to solution-B under continuous stirring to obtain a homogeneous α-Bi2Mo3O12 precursor solution for the electrospinning process. Before commencing the electrospinning technique, the gel solution was stored overnight to release the gas bubbles from the precursor solution. Afterwards, the translucent gel solution was loaded into a syringe containing a needle which was made of stainless steel and connected to a high voltage with a range of up to 30 kV. The nanofibers were collected on a flat panel display which had been sealed with aluminum foil. The distance between the needle (anode) and collector (cathode) was maintained at 20 cm with a feeding rate of 0.08 mm min−1 by applying a 15 kV high voltage. Finally, the electrospun PVP α-Bi2Mo3O12 nanofibers were calcined at 500 °C for 2 h in air to obtain pure α-Bi2Mo3O12 nanofibers.
2.2 Synthesis of the Co3O4 nanoparticles
In the hydrothermal method, 3 mM CoCl2·6H2O salt and 1 mM Na2SO4·10H2O were mixed in 20 ml distilled water in a 100 ml beaker. Then, 10 ml of ethylene glycol was added dropwise to the mixture solution. The mixture solution was then transferred into a 40 ml Teflon lined autoclave, which was wrapped and incubated at 95 °C for 6 h. Finally, the autoclave was cooled down naturally and the obtained products were collected after centrifugation by washing with ethanol and distilled water to remove the unwanted soluble ions. The obtained product was then dried out in the oven at 70 °C and then calcined at 500 °C for 2 h in air with a heating rate of 2.0 °C min−1.2.3 Hydrothermal growth of Co3O4 nanoparticles decorated onto α-Bi2Mo3O12 fibers
The composite based on α-Bi2Mo3O12/Co3O4 porous nanotubes decorated with particles was fabricated using a hydrothermal route followed by a calcination process. A quantity of 3.53 mM of CoCl2·6H2O was dissolved in 20 ml of deionized water and 0.07 ml of ammonia was added dropwise, followed by continuous stirring for at least 30 min. Next, 0.3 g of the as-prepared α-Bi2Mo3O12 nanofibers were dipped into the above mentioned solution. The obtained solution was then put in a Teflon-lined autoclave with a volume of 50 ml. The Teflon-lined autoclave was wrapped and incubated at 95 °C for 6 h and cooled down to room temperature. Then, the product was centrifuged and then washed several times using deionized water and absolute ethanol in order to remove the unwanted soluble ions. Finally, the product was calcined in a muffle furnace at 500 °C for 2 h. The graphic representation of the novel two-step fabrication system is shown in Fig. 1.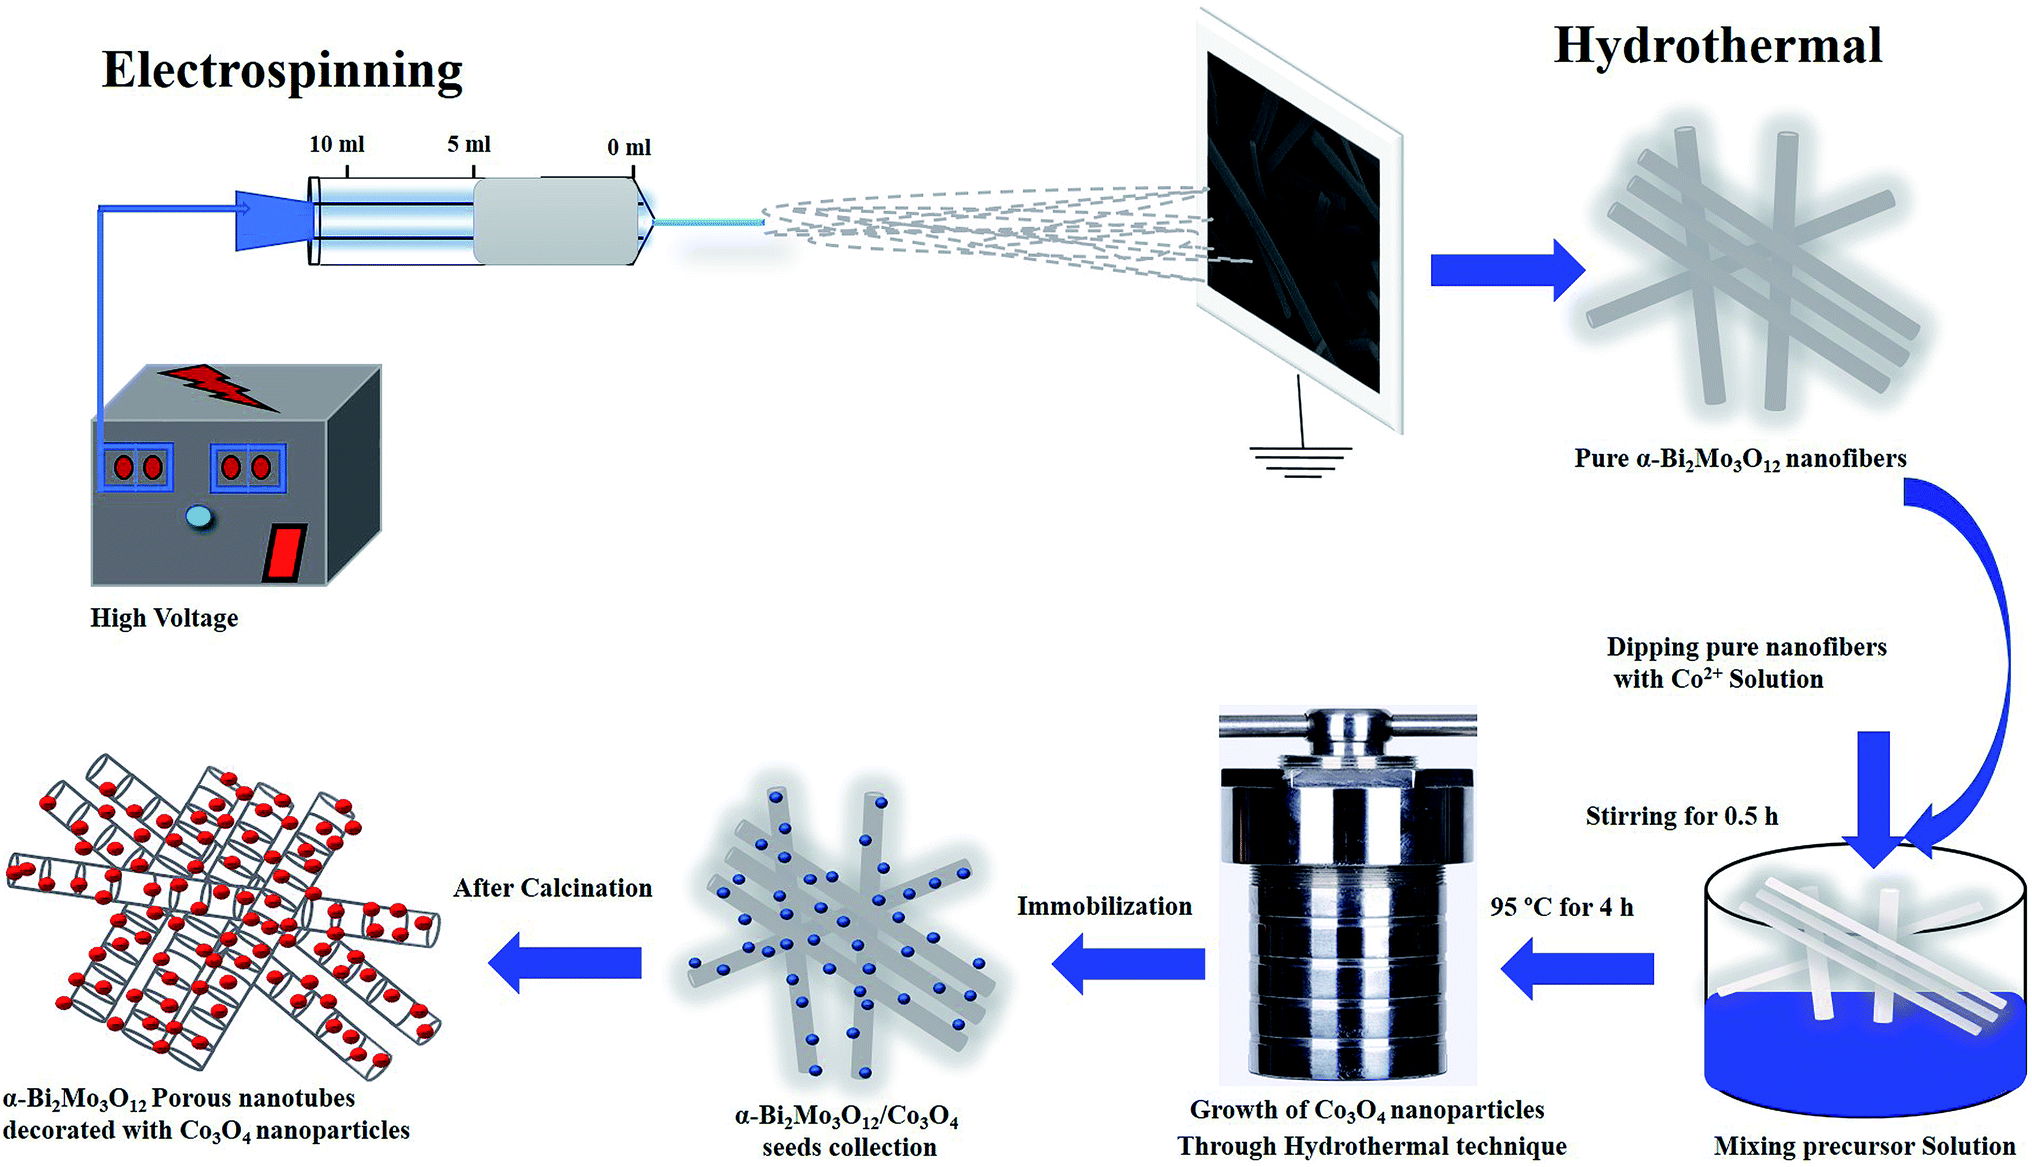 | ||
| Fig. 1 Fabrication and synthesis strategy for the composites based on α-Bi2Mo3O12/Co3O4 nanotube-decorated particles. | ||
2.4 Characterization
The fabrication of the as-prepared sample, pristine sample and the composite based on α-Bi2Mo3O12/Co3O4 were examined using various characterization techniques. The X-ray diffraction patterns were scanned using an Empyrean 200895 model pro-equipped with a copper Kα radiation source in the 2θ range of 10–80°. Scanning electron microscopy (SEM) photographs and energy-dispersive X-ray spectroscopy (EDX) analysis were performed on a Hitachi S-4800 attached to a spectroscopic system. Transmission electron microscopy (TEM) photographs were taken on a model JEOL, JEM-1010 to examine the size and structural morphologies of the as-fabricated samples. The X-ray photoelectron spectroscopy (XPS) analysis was obtained on an analytical AXIS SUPRA model by using a Mg Kα X-ray radiation source. The Brunauer–Emmett–Teller (BET) technique with a model Autosorb-IQ2-MP was used to examine the superficial area and porosity of all the prepared samples.2.5 Volatile organic compounds gas-sensing measurement
Exhaustive gas sensor fabrication and measurements have already been thoroughly discussed in our earlier research work.42,43 The gas sensor was made of a dense film developed from the powder suspension of the as-prepared sample of pure α-Bi2Mo3O12 nanofibers, Co3O4 nanoparticles and a composite based on α-Bi2Mo3O12/Co3O4 nanotube-decorated particles. The pure and composite based samples were prepared in different beakers using ethanol and the samples were ultra-sonicated into a slurry. Afterwards, the sample was pasted onto the ceramic substrate using a brush to produce a thick film between the Au electrodes on the alumina ceramic substrate. The thickness of the as-fabricated sensor was about 20–30 μm, the diameter of the ceramic substrate was 1.2 mm and the distance between the two parallel electrodes was about 6 mm. It is important to mention that the gas sensing measurements were examined using an intelligent gas system (CGS-ITP, Beijing Elite Tech Co, Ltd, China) in our research group. The saturated target gas was injected into the test chamber by using a micro-injector via a plug. Hence, we demonstrated that the sensor sensitivity and resistivity response has been investigated using the system during real time. The gas sensing system offers an excellent operating temperature from (27–500 °C), which adjusts the sensing temperature with a precession of 1 °C using the relative humidity, 45% of the system is controlled by a dehumidifier. The real time sensitivity/resistivity response (Sr) in air (Ra) and the target gas (Rg) were obtained and analyzed using the system for different toxic gases.3 Results and discussion
3.1 Crystal structure, compositional and morphological characteristics
The crystal structure and surface compositional properties of the as-prepared pure α-Bi2Mo3O12 nanofibers, Co3O4 nanoparticles and the composite based on α-Bi2Mo3O12/Co3O4 samples were explored using X-ray powder diffraction (XRD), SEM, TEM, EDX, XPS and BET investigation. The nanofibers obtained through the electrospinning techniques were turned into pure α-Bi2Mo3O12 nanofibers after calcination at 500 °C in air. The XRD diffraction patterns of the as-prepared pure α-Bi2Mo3O12 nanofibers revealed that all of the diffraction peaks correspond to α-Bi2Mo3O12 with a monoclinic crystal structure, as displayed in Fig. 2a. From the XRD diffraction pattern it can be observed that all the d-line spacing was well matched in accordance with the standard (JCPDS # 21-0103). The XRD scattering angles at 24.78°, 28.49°, 31.03°, 32.38°, 33.65°, 33.95°, 46.81°, 47.25°, 48.92°, 53.34°, 55.07°, 56.55°, 57.59° and 59.09° correspond to the (102), (032), (040), (![[1 with combining macron]](https://www.rsc.org/images/entities/char_0031_0304.gif) 33), (140), (221), (152), (250), (61), (
33), (140), (221), (152), (250), (61), (![[3 with combining macron]](https://www.rsc.org/images/entities/char_0033_0304.gif) 52), (
52), (![[4 with combining macron]](https://www.rsc.org/images/entities/char_0034_0304.gif) 31), (071), (154) and (171) crystal planes (hkl) respectively, indicating the monoclinic phase of α-Bi2Mo3O12. No extra peaks were observed in the α-Bi2Mo3O12 obtained using the electrospun technique, which confirms the purity of the material. The XRD diffraction patterns of the as-prepared pure Co3O4 nanoparticles reveals that all the diffraction peaks correspond to Co3O4 with a cubic crystal structure, the peak characteristics are observed at 31.27°, 36.84°, 38.54°, 44.80°, 55.65°, 59.35° and 65.23° corresponding to the planes (220), (311), (222), (400), (422), (511), and (440) respectively, as shown in Fig. 2c. All of the observed planes are in excellent agreement with the standard (JCPDS # 43-1003). We employed a hydrothermal process to grow Co3O4 nanoparticles on the surface of the electrospun α-Bi2Mo3O12 nanofibers and the diffraction pattern of the as-produced composite based on α-Bi2Mo3O12/Co3O4 samples are shown in Fig. 2b. All of the XRD peaks observed in the composites based on α-Bi2Mo3O12/Co3O4 were in good agreement with the standard crystallographic patterns of the monoclinic phase of α-Bi2Mo3O12 (JCPDS # 21-0103) and the weaker Co3O4 diffraction peaks correspond well with the cubic phase of Co3O4 (JCPDS Card No. 43-1003). The XRD scattering angles at 36.84° and 44.80° correspond to the (311) and (400) crystal planes (hkl) respectively, presenting the cubic structure of Co3O4. From the composite sample, we have observed that both materials were profound in their crystalline forms. With the addition of the Co content, the intensity of the diffraction peaks decreases and becomes broad with a clear phase separation in the α-Bi2Mo3O12/Co3O4 composites as compared to that of the pure α-Bi2Mo3O12 sample, which results in reduction of the crystallite size. According to Scherrer's equation (D = kλ/βcosθ), the average crystallite sizes of the pure α-Bi2Mo3O12 nanofibers, Co3O4 nanoparticles and composite based on the α-Bi2Mo3O12/Co3O4 nanotube-decorated particles observed using XRD are approximately 36 ± 4 nm, 35 ± 6 nm and 32 ± 5 nm. These facts reveal that ions can be isolated at the junction and the microstrain established in the composites is based on the α-Bi2Mo3O12/Co3O4 nanotube-decorated particles with a reduction in the particle size.43
31), (071), (154) and (171) crystal planes (hkl) respectively, indicating the monoclinic phase of α-Bi2Mo3O12. No extra peaks were observed in the α-Bi2Mo3O12 obtained using the electrospun technique, which confirms the purity of the material. The XRD diffraction patterns of the as-prepared pure Co3O4 nanoparticles reveals that all the diffraction peaks correspond to Co3O4 with a cubic crystal structure, the peak characteristics are observed at 31.27°, 36.84°, 38.54°, 44.80°, 55.65°, 59.35° and 65.23° corresponding to the planes (220), (311), (222), (400), (422), (511), and (440) respectively, as shown in Fig. 2c. All of the observed planes are in excellent agreement with the standard (JCPDS # 43-1003). We employed a hydrothermal process to grow Co3O4 nanoparticles on the surface of the electrospun α-Bi2Mo3O12 nanofibers and the diffraction pattern of the as-produced composite based on α-Bi2Mo3O12/Co3O4 samples are shown in Fig. 2b. All of the XRD peaks observed in the composites based on α-Bi2Mo3O12/Co3O4 were in good agreement with the standard crystallographic patterns of the monoclinic phase of α-Bi2Mo3O12 (JCPDS # 21-0103) and the weaker Co3O4 diffraction peaks correspond well with the cubic phase of Co3O4 (JCPDS Card No. 43-1003). The XRD scattering angles at 36.84° and 44.80° correspond to the (311) and (400) crystal planes (hkl) respectively, presenting the cubic structure of Co3O4. From the composite sample, we have observed that both materials were profound in their crystalline forms. With the addition of the Co content, the intensity of the diffraction peaks decreases and becomes broad with a clear phase separation in the α-Bi2Mo3O12/Co3O4 composites as compared to that of the pure α-Bi2Mo3O12 sample, which results in reduction of the crystallite size. According to Scherrer's equation (D = kλ/βcosθ), the average crystallite sizes of the pure α-Bi2Mo3O12 nanofibers, Co3O4 nanoparticles and composite based on the α-Bi2Mo3O12/Co3O4 nanotube-decorated particles observed using XRD are approximately 36 ± 4 nm, 35 ± 6 nm and 32 ± 5 nm. These facts reveal that ions can be isolated at the junction and the microstrain established in the composites is based on the α-Bi2Mo3O12/Co3O4 nanotube-decorated particles with a reduction in the particle size.43
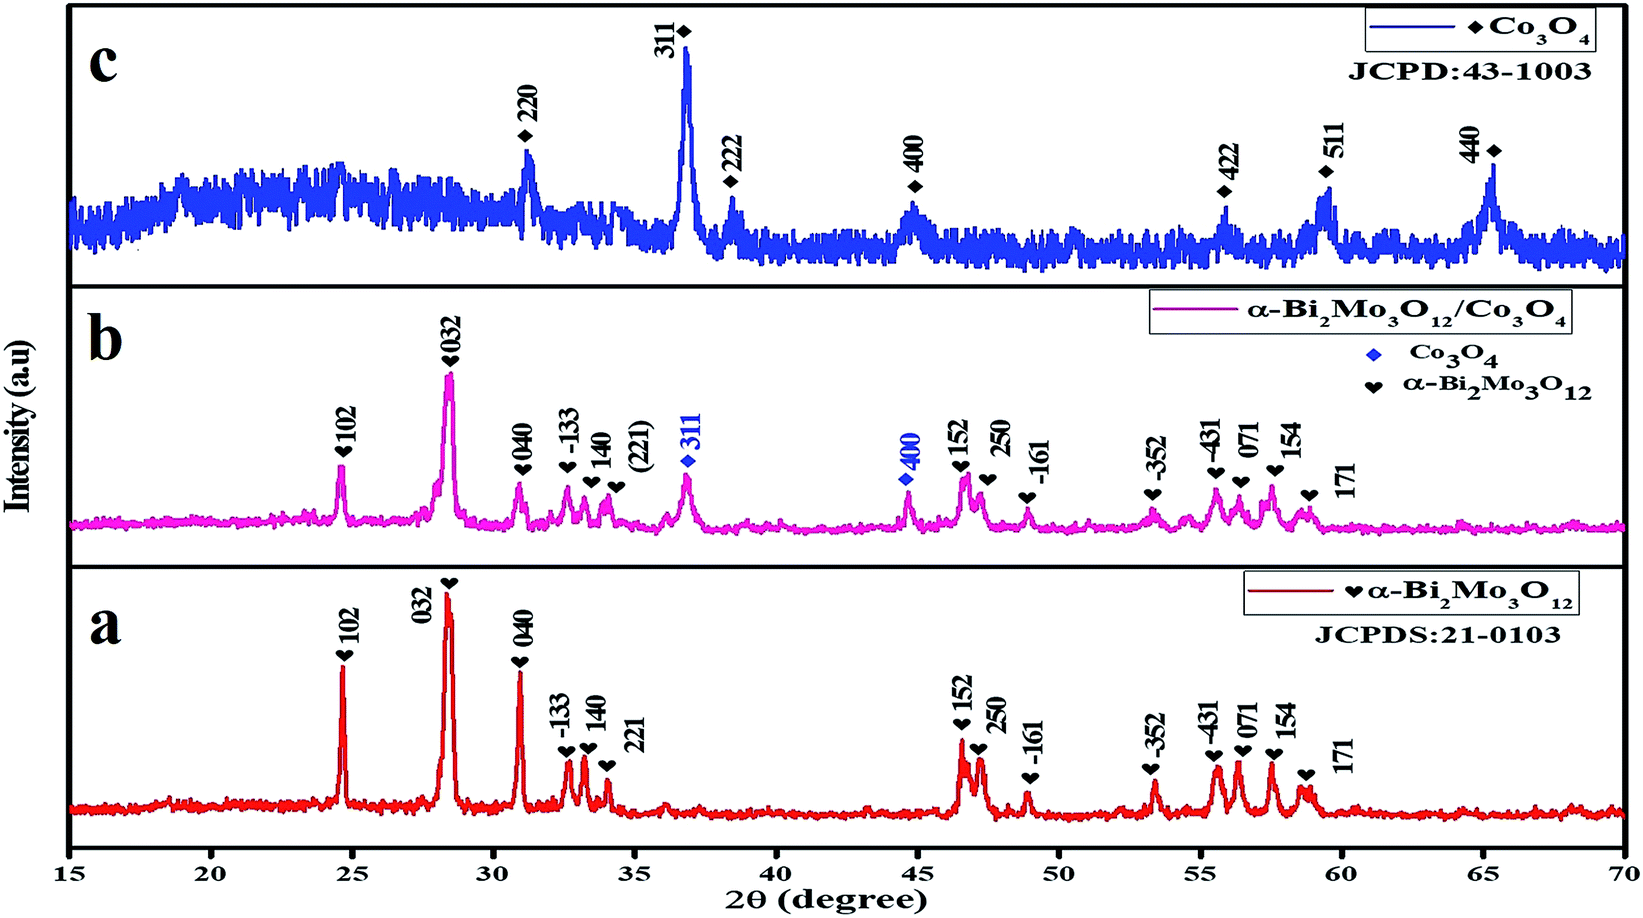 | ||
| Fig. 2 XRD pattern of (a) α-Bi2Mo3O12 nanofibers (red), (b) composite based on α-Bi2Mo3O12/Co3O4 heterostructure (pink), and (c) Co3O4 nanoparticles (blue). | ||
The SEM photographs of the pure α-Bi2Mo3O12 nanofibers exhibit ultralong fibers having a smooth surface with random alignment, as shown in Fig. 3a. The average length and diameter of the pure α-Bi2Mo3O12 nanofibers were found to be 0.5–0.6 μm and 80–260 nm using ImageJ software, as shown in Fig. 3a respectively. The SEM photograph of the composite α-Bi2Mo3O12/Co3O4 materials shows that the morphology of the fibers changes into nanotubes that show a random alignment with the deposition of the Co3O4 nanoparticles as outgrowth after the hydrothermal treatment, as shown in Fig. 3b and c. TEM analysis was carried out and is shown in Fig. 3d and e, which further clarifies that the composite materials present a nanotube morphology of α-Bi2Mo3O12 with the deposition of the Co3O4 nanoparticles as outgrowth. The composite based on the α-Bi2Mo3O12/Co3O4 nanotube-decorated particles retains the average length of pure α-Bi2Mo3O12 nanofibers, but the thickness of the fibers increases after hydrothermal treatment.44 In addition, the SEM average particle size of the Co3O4 nanoparticles decorated on the composite based on α-Bi2Mo3O12/Co3O4 were investigated at ∼25 ± 5.25 nm, which is comparatively larger compared to the TEM average particle size ∼17.88 ± 3.34 nm in which an average of 50 particles were detected across the diameter of a nanotube using ImageJ software. The average particle size observed from the SEM and TEM specimen demonstrated that the result was approximately within the range and was similar to those crystallite sizes calculated using Scherrer's equation. The SEM images of the pure Co3O4 nanoparticles prepared using the hydrothermal method are shown in Fig. S1.† Moreover, the photograph in Fig. 3f shows the HRTEM analysis with a lattice spacing of (0.159 nm), (0.257 nm) and (0.205 nm) is well matched with the lattice planes (032), (152) and (311) of the XRD, as revealed in Fig. 2. The presence of the Bi, Mo, O and CO signals in the composition was analyzed using the EDX spectrum as depicted in Fig. S2.† The oxygen peak signal observed in the composite based sample during the analysis of the EDX spectrum shows the existence of an oxide like phase of α-Bi2Mo3O12. The EDX spectrum of the composite based on α-Bi2Mo3O12/Co3O4 nanotube-decorated particles shows the spatial spreading of the Bi, Mo, O and CO signals in the fabricated heterostructures.
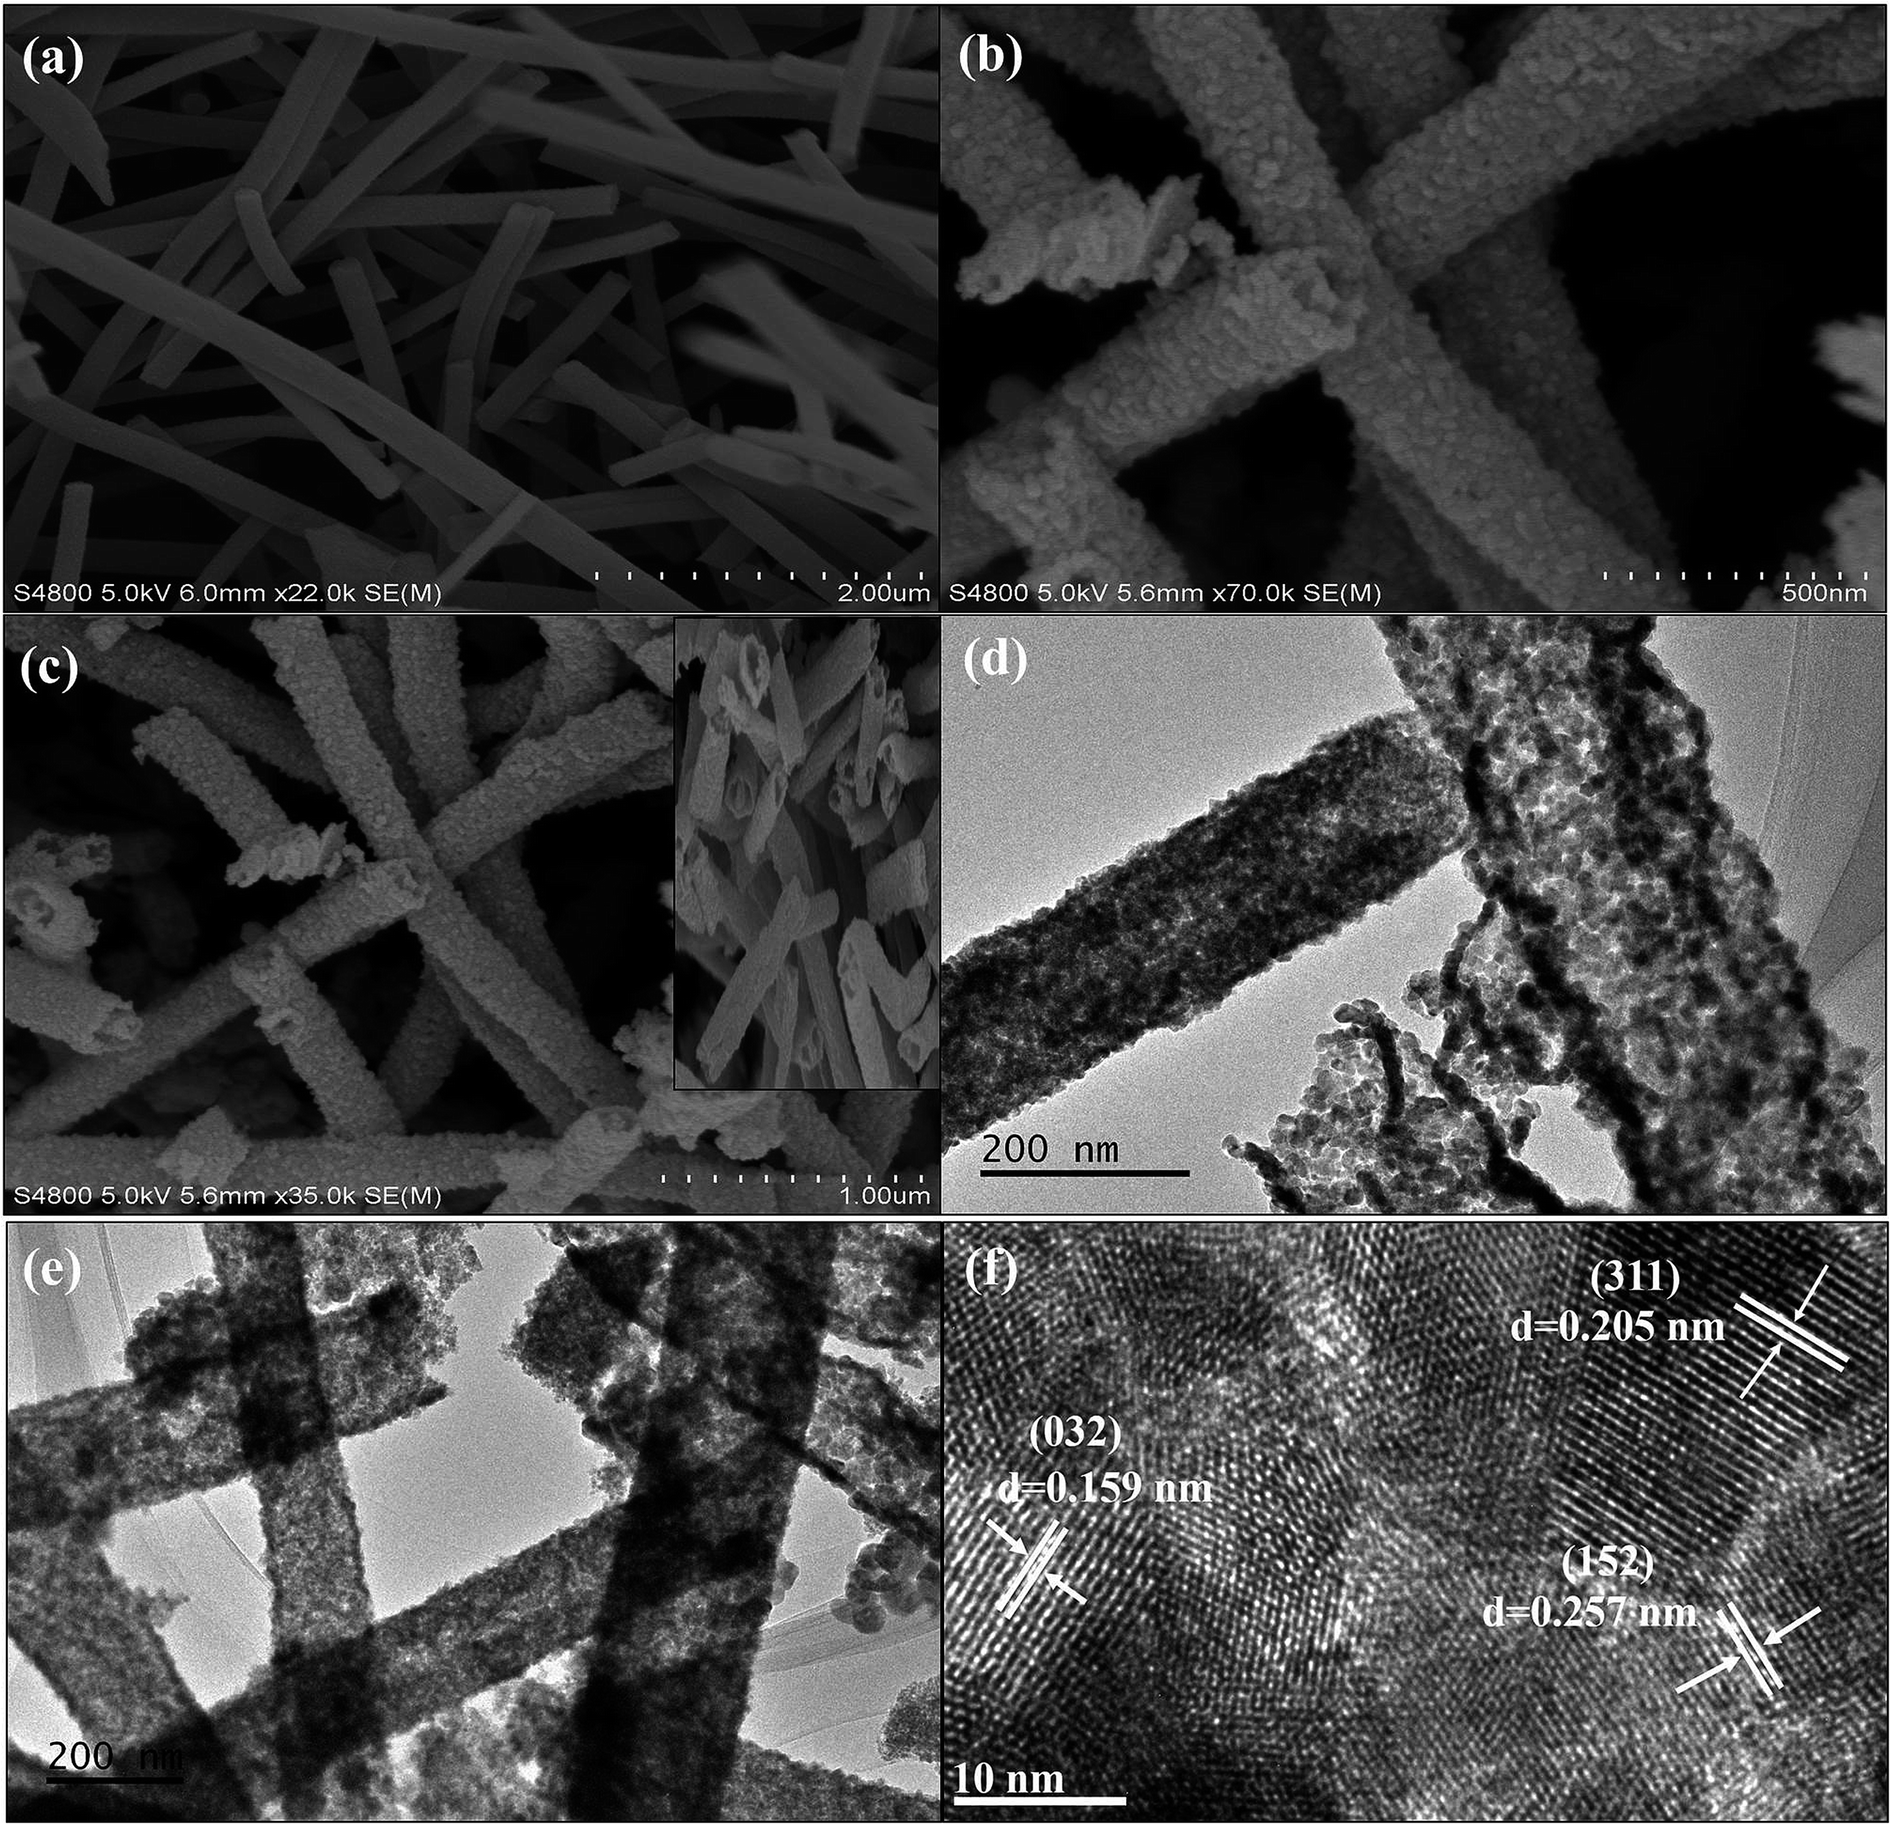 | ||
| Fig. 3 (a) SEM image of pure α-Bi2Mo3O12 nanofibers. (b) and (c) SEM images of high and low magnification α-Bi2Mo3O12/Co3O4 composites. (d) and (e) TEM photographs of high and low magnification of α-Bi2Mo3O12/Co3O4 composites. (f) HRTEM photograph of α-Bi2Mo3O12/Co3O4 composites. | ||
The chemical composition analysis and valence states of the composite based sample α-Bi2Mo3O12/Co3O4 nanotube-decorated particles were examined using XPS as shown in Fig. 4. The XPS full spectrum also demonstrates that the fabricated sample composed of Bi, Mo, Co and O elements gives confirmation of the purity of the product, as shown in Fig. 4a. The two strong signals for Bi 4f5/2 and Bi 4f7/2 were observed in the Bi 4f spectra in the range of 164.7 and 159.5 eV respectively, as depicted in Fig. 4b, which gives confirmation of the Bi3+ ions. The peaks for Mo 3d3/2 and 3d5/2 were detected at 235.8 and 232.7 eV, as shown in Fig. 4c. The signal pertaining to the binding energy of the fabricated sample was investigated, indicating that Mo 4+ was formed at the expense of Mo 6+ during the reduction of MoO3, although it has been observed that 75% of the total molybdenum was present as Mo 4+ and the other remaining 25% was Mo 6+. Therefore, from Fig. 4b and c for Bi 4f and Mo 3d, a slight shift has been observed in the composite based sample after the decoration of Co3O4 nanoparticles on the porous nanotubes. This slight shift in the binding energy (BE) between the pure and composite based Bi 4f and Mo 3d guarantees some electronic interaction between the α-Bi2Mo3O12 nanofibers and Co3O4 nanoparticles. Furthermore, the binding energy peaks of Co 2p were detected at 796.91 and 779.91 eV and assigned as Co 2p1/2 and Co 2p3/2, while its satellite peaks were also identified at 804.46 and 790.64 eV respectively, as examined in Fig. 4d. Moreover, the XPS spectrum of the O 1s binding energy peaks for the bare and composite based samples indicate that three peaks were assigned as the lattice oxygen (OL), vacant oxygen (Ov) and chemisorbed oxygen (Oc) located at 529.79 and 529.84 eV, 530.88 and 531.20 eV and 532.42 and 532.55 eV respectively.
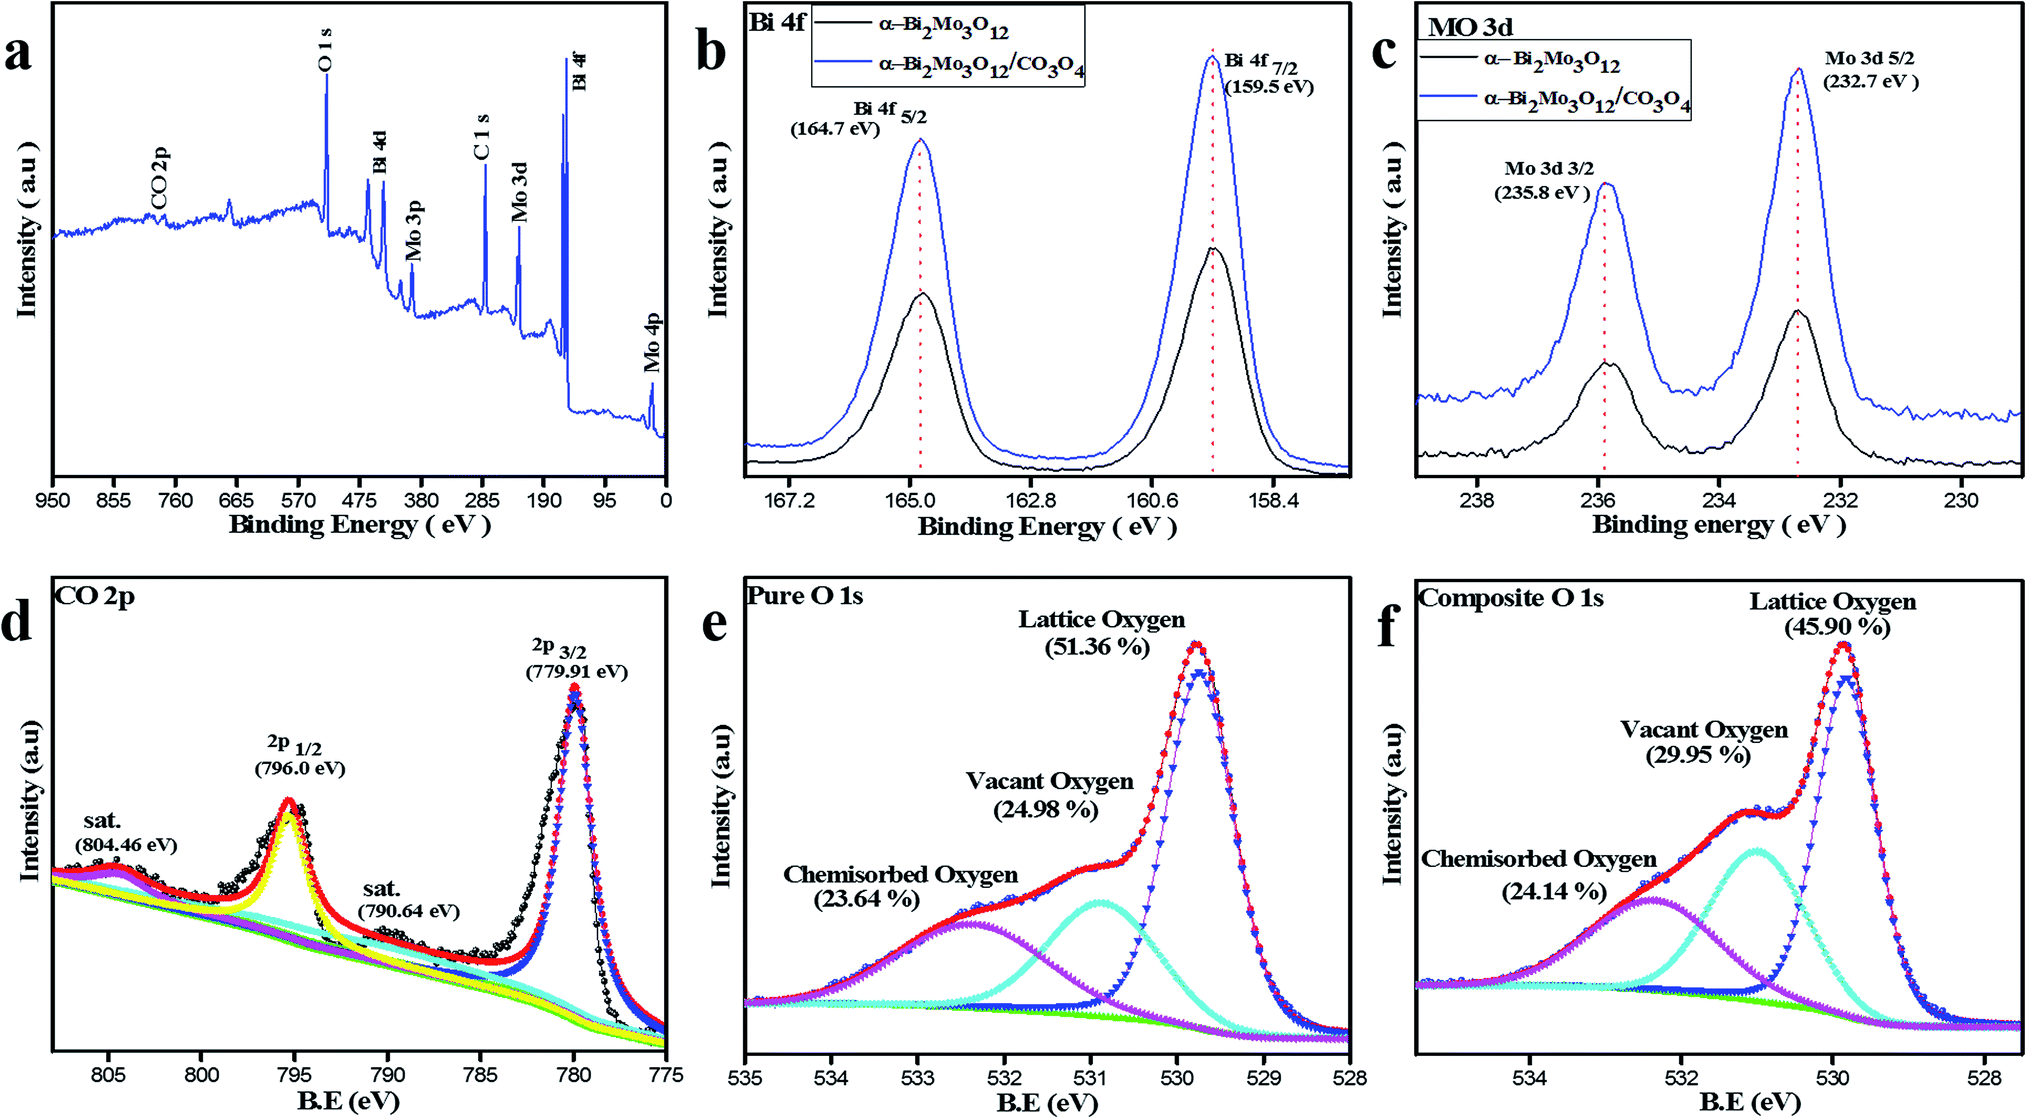 | ||
| Fig. 4 (a) XPS full spectrum of the α-Bi2Mo3O12/Co3O4 composite. (b) Bi 4f, (c) Mo 3d, (d) CO 2p and (e) and (f) O 1s XPS for pure and composite spectra of α-Bi2Mo3O12/Co3O4. | ||
N2 adsorption–desorption analysis was performed using the BET technique for further examination of the specific surface area and pore size distribution of the pristine Co3O4 nanoparticles, pure α-Bi2Mo3O12 nanofibers and the composite based on α-Bi2Mo3O12/Co3O4 nanotube-decorated particles, as shown in Fig. 5a and b. Fig. 5a shows the N2 adsorption–desorption isotherms of pure and composite based samples, which indicates that the curves of all the samples exhibit IV-type adsorption isotherms having a H3-type hysteresis loop at various ranges of relative pressure. From the BET measurement, the composite based on α-Bi2Mo3O12/Co3O4 exhibits a large specific surface area of 54 m2 g−1 with mesopore diameter ranges of 2–10 nm, which are mainly attributed to the remarkable and dominant enhancement in gas sensing as compared to that of the pure α-Bi2Mo3O12 nanofibers (38 m2 g−1) and Co3O4 nanoparticles (32 m2 g−1), respectively. From Fig. 5b, it can be seen using the Barrett–Joyner–Halenda (BJH) technique that the pore size distribution curves of the pure and composite based samples indicate mesoporous size distributions. The spreading of the pore diameter of the composite based on α-Bi2Mo3O12/Co3O4 is more concentrated with a large number of mesopores (average peak pore at ca. 2–10 nm) and a small number of large mesopores and macropores. The large specific surface area of the composite based on α-Bi2Mo3O12/Co3O4 nanotube-decorated particles, which has a mesoporous nature, could offer an excellent charge carrier concentration, and superior and ultrafast gas diffusion, which leads to the enhancement of the gas sensing performance.
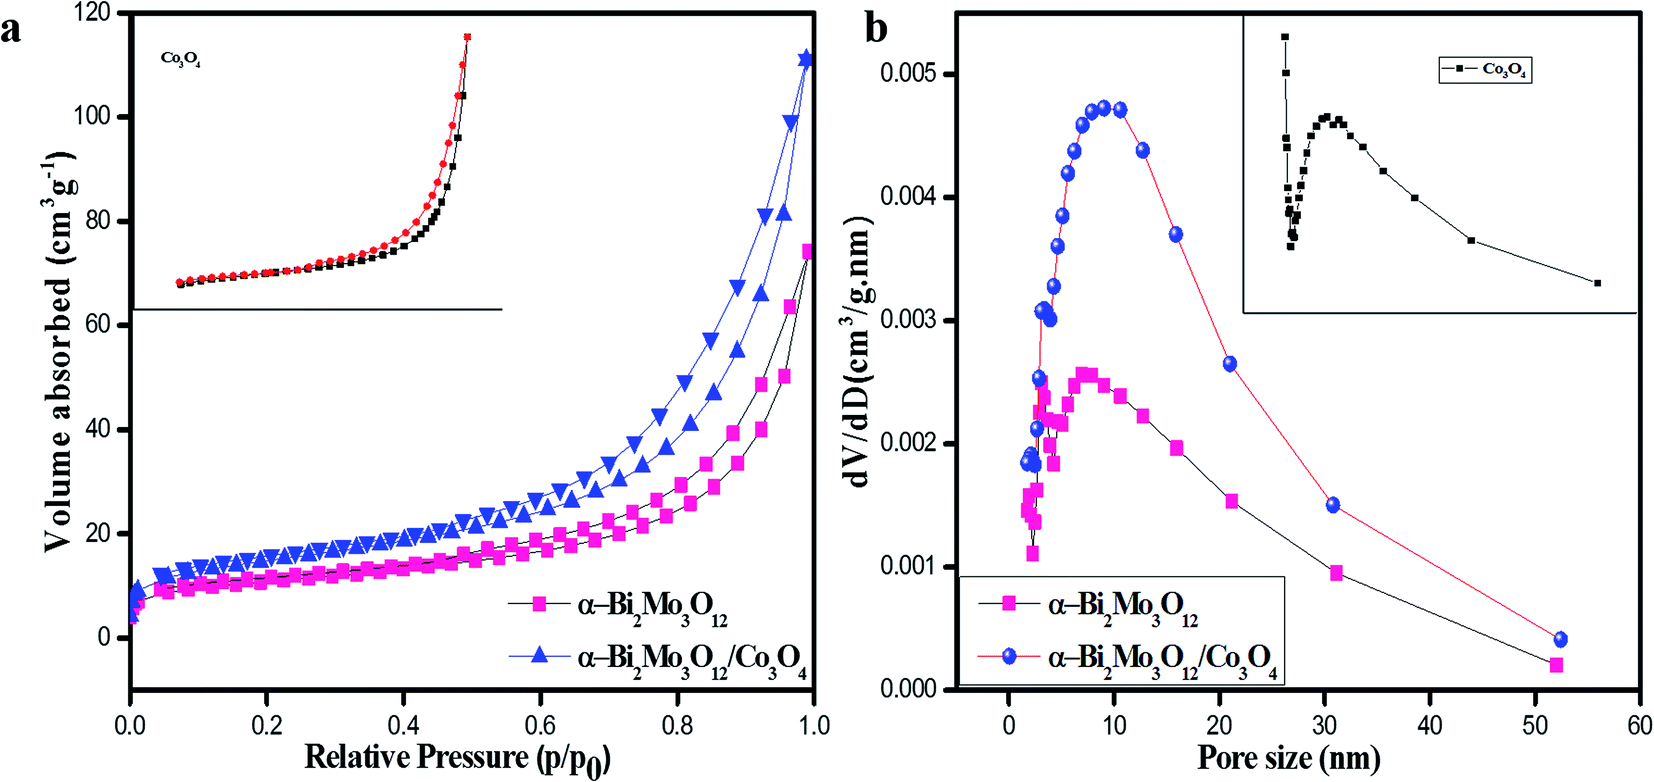 | ||
| Fig. 5 (a) Nitrogen adsorption–desorption isotherms of pure α-Bi2Mo3O12 nanofibers and the composite of α-Bi2Mo3O12/Co3O4, the inset figure shows the pure Co3O4 nanoparticles. (b) The corresponding adsorption–desorption pore-size distribution curves of the pure α-Bi2Mo3O12 nanofibers and the composite based on α-Bi2Mo3O12/Co3O4 nanotube-decorated particles, the inset figure shows the pore-size distribution curves of the pure Co3O4 nanoparticles. | ||
3.2 VOC gas-sensing properties
The fabricated sensors of the pristine α-Bi2Mo3O12 nanofibers, Co3O4 nanoparticles and the composite based on α-Bi2Mo3O12/Co3O4 nanotube-decorated particles have been studied. We investigated the gas sensitivity performance of the as-prepared sensors towards different toxic gases. The as-synthesized pure and composite based sensors towards ethanol, acetone, methanol, xylene, toluene, benzene and ammonia were examined. If the target gas was injected into the as-prepared sensors, the electrical resistance of the fabricated sensors sharply increases and then abruptly decreases after removing the target gas to attain its original value. Semiconductor gas sensors are not selective enough to expose a single chemical species in a gaseous mixture and also the sensor response in most cases is influenced by changes in the ambient humidity and temperature. The dynamic response of the single sensor analyses with ambient temperature is one of the best solutions. The information regarding the dynamic response, which includes diverse characteristics for various gases owing to temperature fluctuations, improved the selectivity of the metal oxide sensor. Compared with the signal response under an ambient temperature, the dynamic response reflects numerous chemical reactions at various temperatures and provides excellent diversity of features for a higher classification.45,46First of all, the operational temperature is the main factor that influences the dynamic gas sensing performance of the as-prepared pure and composite based sensors. The pure and composite based as-prepared sensor responses were tested for ethanol for the heating temperature range of 110–350 °C to select the optimal working temperature as illustrated in Fig. 6a. Apparently, the volcano-shape connection between the sensing response and the temperature was exposed for all of the samples and the best operating temperature for the sensors based on the composite α-Bi2Mo3O12/Co3O4 nanotube-decorated particles was 170 °C, while the best operative temperatures for the sensors based on pure α-Bi2Mo3O12 nanofibers and pristine Co3O4 nanoparticles were 220 °C and 280 °C. If we raise the temperature from 110 °C to 170 °C, it demonstrates a high gas sensing response, an enhancement in the conductivity/resistivity and a speedy recovery at an optimal temperature of 170 °C, while for an increasing temperature, it shows a decreasing trend in the response and recovery. The decreasing trend for the temperature of the composite based on the α-Bi2Mo3O12/Co3O4 nanotube-decorated particles may be ascribed to the greater amount of energy needed during the reaction with ethanol vapors to overcome the potential barrier between the p/n type heterostructure. Therefore, the reaction on the surface of the composite material could be decreased, because the reaction between the ethanol and the adsorbed oxygen species does not have sufficient energy to accelerate the electron during the low working operating temperature. While higher operating temperatures reduce the adsorbed oxygen species (O2−, O−, O2−) and give a limited gas response towards ethanol molecules.47 In the meantime, the sensitivity was significantly enhanced by introducing Co3O4 nanoparticles into the α-Bi2Mo3O12 nanofibers. The sensitivity responses of the sensors based on the pristine Co3O4 nanoparticles, pure α-Bi2Mo3O12 nanofibers and the composite based on α-Bi2Mo3O12/Co3O4 nanotube-decorated particles towards 100 ppm ethanol at 170 °C were 2.99, 13.10 and 30.25, respectively. The result revealed that the sensor based on the α-Bi2Mo3O12/Co3O4 nanotube-decorated particles offered an excellent response towards 100 ppm ethanol and the value was about 2.5 times superior to that of the pure α-Bi2Mo3O12 nanofibers, and it was 10 times greater than the Co3O4 nanoparticles, which could be ascribed to the small-size catalytic effect of the Co3O4 nanoparticles decorating the porous nanotubes.
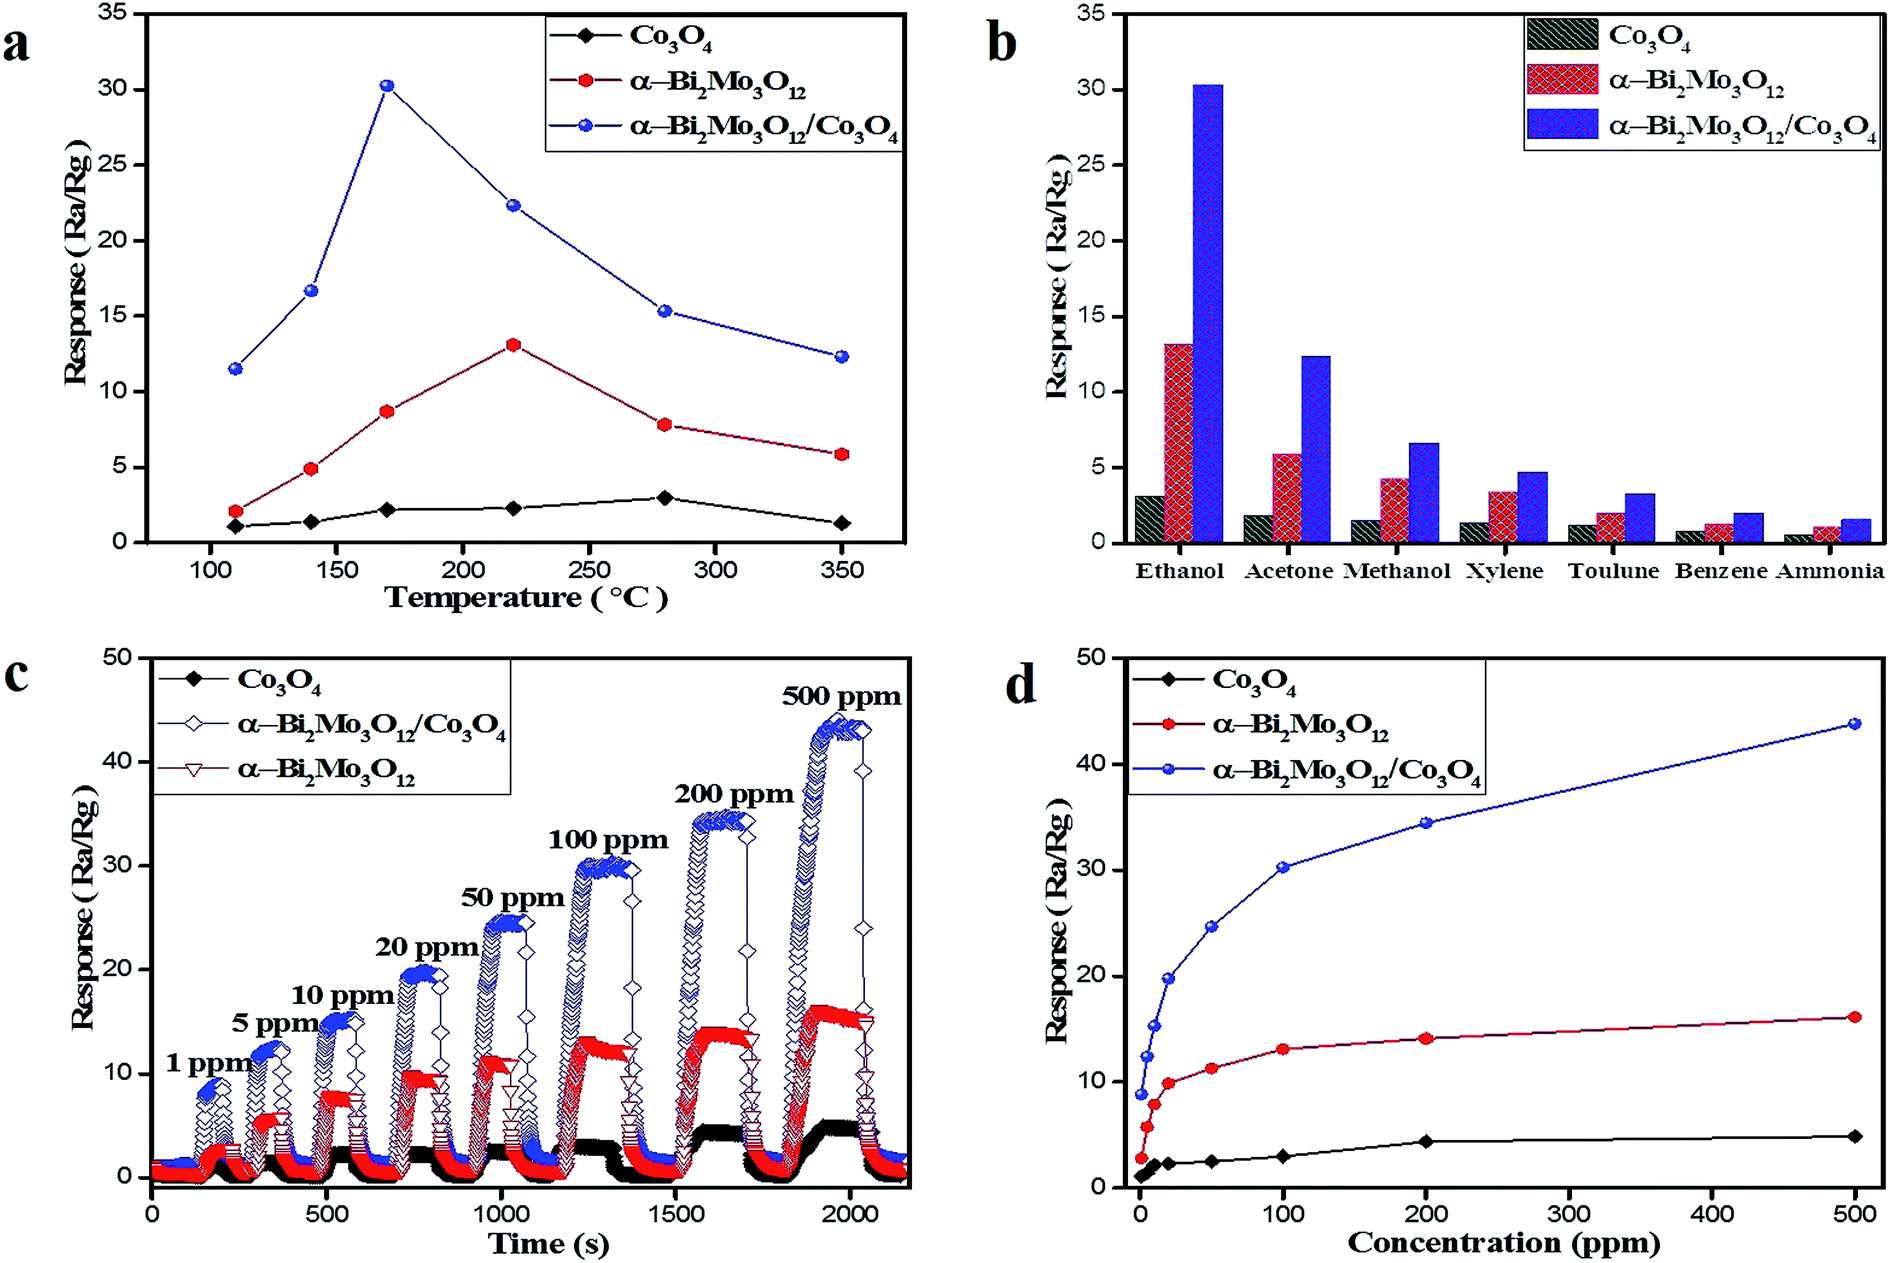 | ||
| Fig. 6 (a) Response of pure α-Bi2Mo3O12 nanofibers and the α-Bi2Mo3O12/Co3O4 composite towards 100 ppm ethanol at various operating temperatures. (b) Gas responses of pure Co3O4 nanoparticles, α-Bi2Mo3O12 nanofibers and composites based on α-Bi2Mo3O12/Co3O4 sensors to 100 ppm of various target gases at an optimal temperature of 170 °C. (c) Real-time sensing-response curves of the sensors based on pure Co3O4 nanoparticles, α-Bi2Mo3O12 nanofibers and the α-Bi2Mo3O12/Co3O4 composite to various ethanol concentrations at 170 °C. (d) Gas-responses of pure and composite based sensors as a function of various concentrations of ethanol. | ||
The good selectivity of the semiconductor-oxide sensors is also an important parameter, which is the ability of the sensor to respond to a specific gas in the presence of other gases. Accordingly, the sensing selectivity performance of the sensors based on the pristine Co3O4 nanoparticles, pure α-Bi2Mo3O12 nanofibers and the composite based on α-Bi2Mo3O12/Co3O4 nanotube-decorated particles were exposed to 100 ppm of various toxic gases such as ethanol, acetone, methanol, xylene, toluene, benzene and ammonia at 170 °C, as depicted in Fig. 6. The sensor based on α-Bi2Mo3O12/Co3O4 nanotube-decorated particles presents a superior response to all of the tested gases compared to that of the pure α-Bi2Mo3O12 nanofibers and Co3O4 nanoparticles, as shown in Fig. 6b. Similarly, the response of all of the as-prepared sensors to ethanol was excellent compared to other test gases. As reported, the best sensitivity and selectivity might be ascribed to various adsorption capacities, reducibility and working temperatures for the different testing gases on the surface of the sensing material.48 The low sensitivity of the sensors towards acetone gas as compared to ethanol gas could be possible owing to the reduced reactivity of acetone with the anion oxygen on the surface of the as-prepared sensors at the working temperature of 170 °C. Although the low sensitivity of the sensors towards toluene, xylene, benzene and ammonia gas could be due to large molecular sizes which can cause difficulties for molecules entering and diffusing into the surface of the as-prepared sensors resulting in less chance for these to react with the anion oxygen on the surface of the sensors.49 For a certain sensing material, various gases have different optimal working temperatures.50 Therefore, the highest sensitivity for different gases varies at the same temperature. It was shown that the sensor has a good anti-interference property. It was also demonstrated here that ammonia has a minimal interference with the detection of other gases, which has been a tough task using conventional n/p-type oxide semiconductor gas sensors. The maximum sensitivity and selectivity of the sensor based on the α-Bi2Mo3O12/Co3O4 composites for ethanol detection can be explained by the high adsorption capacity and reactivity with the anion oxygen to that of the other target gases at a temperature of 170 °C. Moreover, the formation of a p/n junction and the small-size catalytic effect of Co3O4 provide further active sites to adsorb a large amount of ionic oxygen species on the surface of the α-Bi2Mo3O12/Co3O4 composites and facilitate further electron ejections during the redox reaction between the ethanol molecules and the ionic oxygen species, which reflects its sensing selectivity.
We studied the real time sensitivity response of the sensor based on pristine Co3O4 nanoparticles, the pure α-Bi2Mo3O12 nanofibers and the composite based on α-Bi2Mo3O12/Co3O4 nanotube-decorated particles at a working temperature of 170 °C against an ethanol concentration range of 1–500 ppm as depicted in Fig. 6c. It has been perceived that the response was enhanced by the increase in the ethanol concentration from 1 to 500 ppm for all of the sensors and the progress gradually fell with the rise of ethanol to 500 ppm. Among the as-prepared sensors, the response of the composite sensor based on the α-Bi2Mo3O12/Co3O4 nanotube-decorated particles was obviously superior as compared to the other sensors towards the different ethanol concentrations tested, as revealed in Fig. 6d. Furthermore, we observed that the response of the sensor based on the Bi2Mo3O12/Co3O4 composites did not tend to saturate gradually if the ethanol concentration was raised to 500 ppm, even though the higher sensing response fell down with further raising of the ethanol concentration.
In addition, we observed that the sensor based on the α-Bi2Mo3O12/Co3O4 composite shows a much superior response to ethanol concentrations as compared to that of the pure Co3O4 nanoparticles and α-Bi2Mo3O12 nanofibers. This result can be seen from the plot in Fig. 6d. The result demonstrates that all sensors show superior response/recovery features towards ethanol concentrations ranging from 1–500 ppm. The response/recovery features of all of the as-prepared sensors at 170 °C towards 100 ppm ethanol concentration are depicted in Fig. S3a–c.† We observed that the response/recovery speeds of the composite based sensor were recorded at 34 s and 26 s, whereas for the pure α-Bi2Mo3O12 nanofibers and the Co3O4 nanoparticle sensor, it was recorded at 71 s and 64 s and 93 s and 85 s respectively, at an optimal temperature of 170 °C for an ethanol concentration of 100 ppm.
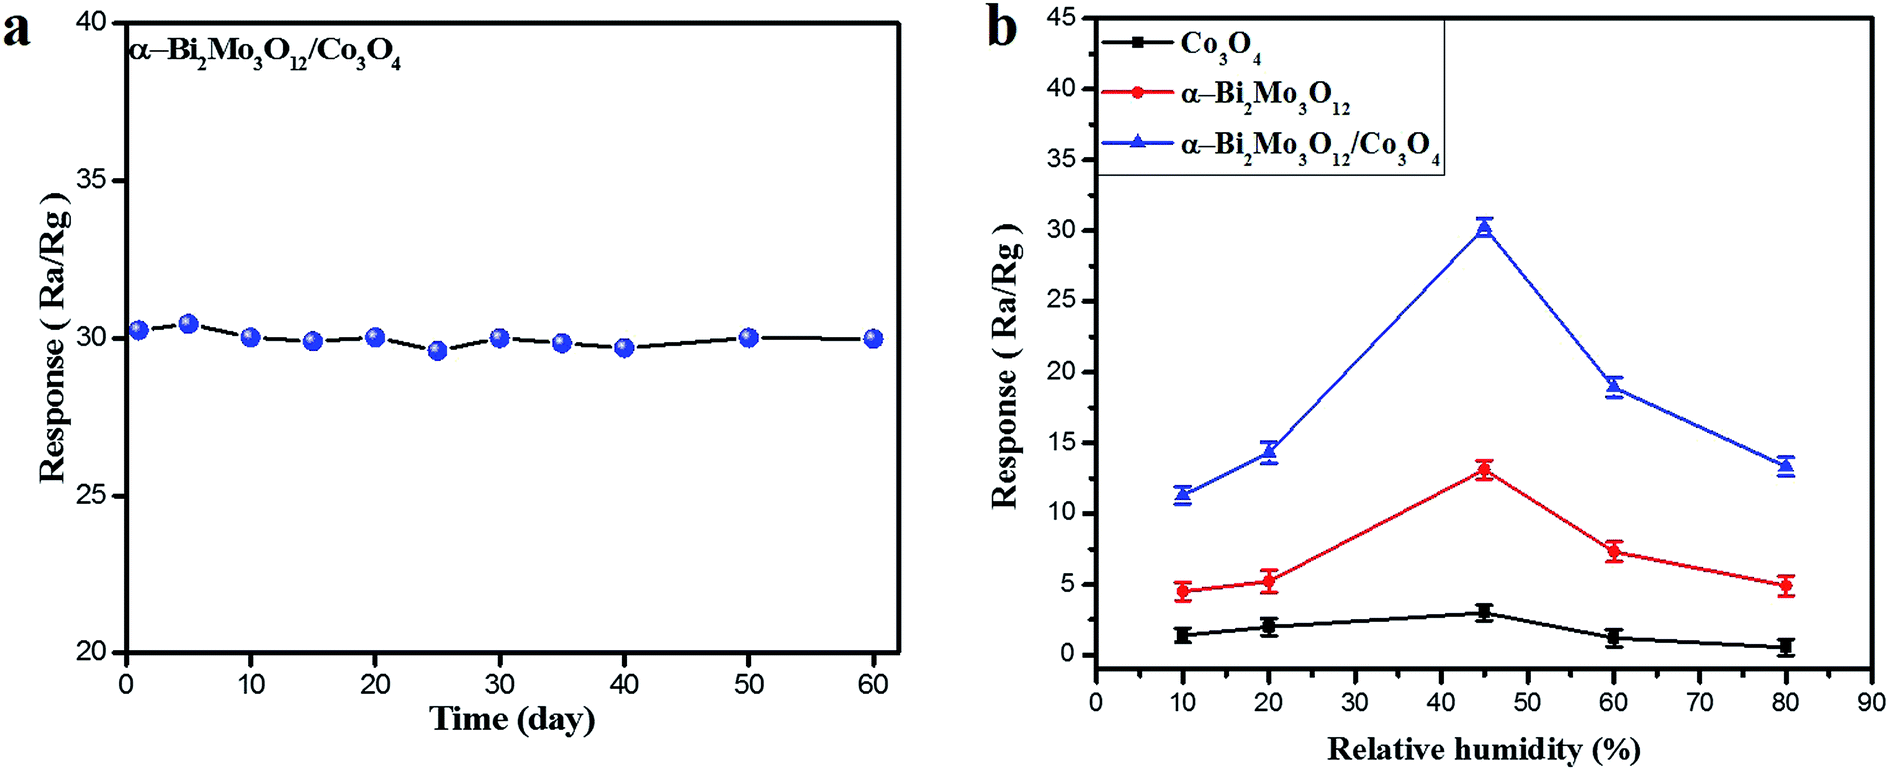
In order to check the long-term stability against a concentrated 100 ppm ethanol sample, the sensor based on the α-Bi2Mo3O12/Co3O4 composite was studied and tested periodically after one week, spanning a total duration of two months, as shown in Fig. 7a. It is interesting to note that the composite sensor seems immune to these changes in ethanol concentration within an error of ±0.40%. Moreover, the as-prepared sensor based on the pristine Co3O4 nanoparticles, pure α-Bi2Mo3O12 nanofibers and the composite α-Bi2Mo3O12/Co3O4 nanotube-decorated particles were examined at an optimal operating temperature of 170 °C for various known relative humidity (RH) effects at 10, 20, 45, 60 and 80% RH (error bars represent the standard error obtained in three measurements), as depicted in Fig. 7b. According to the dominant systematic mechanism proposed by Heiland and Kohl,51 H–O–H provides promising conditions for oxygen adsorption, electrons and oxygen vacancies. A certain amount of water adsorption should accelerate the oxygen adsorption, thereby increasing electron capture by vacant oxygen atoms. The disparity in the total concentration in adsorption sites is denoted by (St), in which
| [St] = [Sto] + Ko·ρH2O | (1) |
 | ||
| Fig. 7 (a) Long term stability of the α-Bi2Mo3O12/Co3O4 composite towards 100 ppm ethanol. (b) The response of pure Co3O4 nanoparticles, α-Bi2Mo3O12 nanofibers and the composite based α-Bi2Mo3O12/Co3O4 towards different relative humidity effects at the optimal temperature of 170 °C (error bars represent the standard error obtained in three measurements). | ||
The intrinsic concentration of the adsorption sites was denoted by [Sto], the adsorption constant for water vapor is [Ko] and ρH2O is the partial pressure of the water vapor. We also know that the RH is proportional to the partial pressure of water; if we increase the humidity level, the concentration of the adsorption sites increases and as a result the oxygen species and hydroxyl groups are transformed. Thus, the RH factor plays a crucial role in the sensitivity of both types of sensors along with the relative surface adsorption, coverage of the hydroxyl groups and the oxygen species.52 The superior sensor response for both samples to ethanol gas was explored at 45% RH. These sensors display a better result owing to the contribution of the small coverage of hydroxyl groups which cannot constrain the ethanol adsorption and as a result the coverage of the oxygen species enhances the sensitivity response. The sensing response of all of the as-prepared sensors has a remarkable behavior at a RH level of 45%, which might be attributed to the high porosity level, thereby enhancing the diffusion process of water. The small-size and catalytical effect of the Co3O4 nanoparticles in the composites based on α-Bi2Mo3O12/Co3O4 offers a larger surface area with a huge number of vacancies providing more active sites for the adsorption and dissociation of more oxygen species and ethanol gas molecules, which limits the coverage of hydroxyl groups originating from the moisture. Moreover, it supplies excellent channels and surface accessibility for the mass transportation of target gases.53 Thus, the improved humidity sensing selectivity response of the sensors based on α-Bi2Mo3O12/Co3O4 composites compared to that of the pure Co3O4 nanoparticles and α-Bi2Mo3O12 nanofibers might be owed to the small-size catalytic effect of the Co3O4 nanoparticles and the large number of p/n heterojunction effects between the α-Bi2Mo3O12 and Co3O4 composite, which leads to the enhancement of the ethanol adsorption kinetics.
Many research groups have previously studied the sensitivity properties of single/binary sensors of metal oxide-based semiconductors of n/p-type and nanostructures towards toxic reducing gases using different synthetic techniques. Herein, we have prepared a ternary metal oxide that exhibits a greater sensitivity as compared to the binary metal oxides which have an inadequate exposed area and reduced electron transportation.39 One of the most significant and impressive approaches is to combine the different physio-chemical characteristics of the metal oxide into a single system. Thus, our approach can be classified as a fabrication of the composite based on n/p-type metal oxides heterostructures.42,43 Moreover, the composite based on heterostructure formation is a productive way of promoting and enhancing the gas-sensing performance. In order to compare the current research work with the previous published literature, the enhanced sensing behavior towards ethanol molecules is listed in Table 1. Herein, we report a novel composite sensor based on α-Bi2Mo3O12/Co3O4 nanotube-decorated particles fabricated using a facile, highly efficient, scalable two step system via electrospinning and hydrothermal techniques in order to compare and determine the gas sensitivity features towards various hazardous gases, such as ethanol, acetone, methanol, xylene, toluene, benzene and ammonia. The gas response of the α-Bi2Mo3O12/Co3O4 nanotube-decorated particles gave the highest result at a low concentration of ethanol and a relatively low operating temperature of 170 °C, revealing a comparatively higher efficiency than those reported in the literature. Thus, it is believed that the α-Bi2Mo3O12/Co3O4 nanotube-decorated particles prepared in this work present a better performance and excellent guidelines for further examination in the promising field of advance gas sensing applications.
| Composite materials | C2H5OH sensing (100 ppm) | Synthesis techniques | Temp (°C) | Response time (s) | Recovery time (s) | Ref. |
|---|---|---|---|---|---|---|
| LaMnO3/SnO2 | 20/100 | Electrospinning | 260 | 6 | 34 | 54 |
| ZnO@In2O3 | 31.9/100 | Electrospinning | 225 | 3.7 | 52 | 55 |
| α-Fe2O3/SnO2 | 22.5/100 | Electrospinning + hydrothermal | 300 | — | 20 | 56 |
| Eu2O3–In2O3 | 44/50 | Electrospinning | 260 | 3 | 21 | 57 |
| ZnO/In2O3 | 170/100 | Solvothermal | 240 | 35 | 46 | 58 |
| GO/SnO2 | 85.3/100 | Electrospinning + dipping | 300 | 9 | 8 | 59 |
| Sn doped α-Fe2O3 | 45.5 | Nano-casting | 280 | 16 | 28 | 60 |
| In2O3/ZnS | 11.8 | Double hydrothermal | 260 | 21 | 34 | 61 |
| α-Bi2Mo3O12/Co3O4 | 30.25 | Electrospinning + hydrothermal | 170 | 34 | 26 | This work |
3.3 Mechanism of enhanced gas-sensing
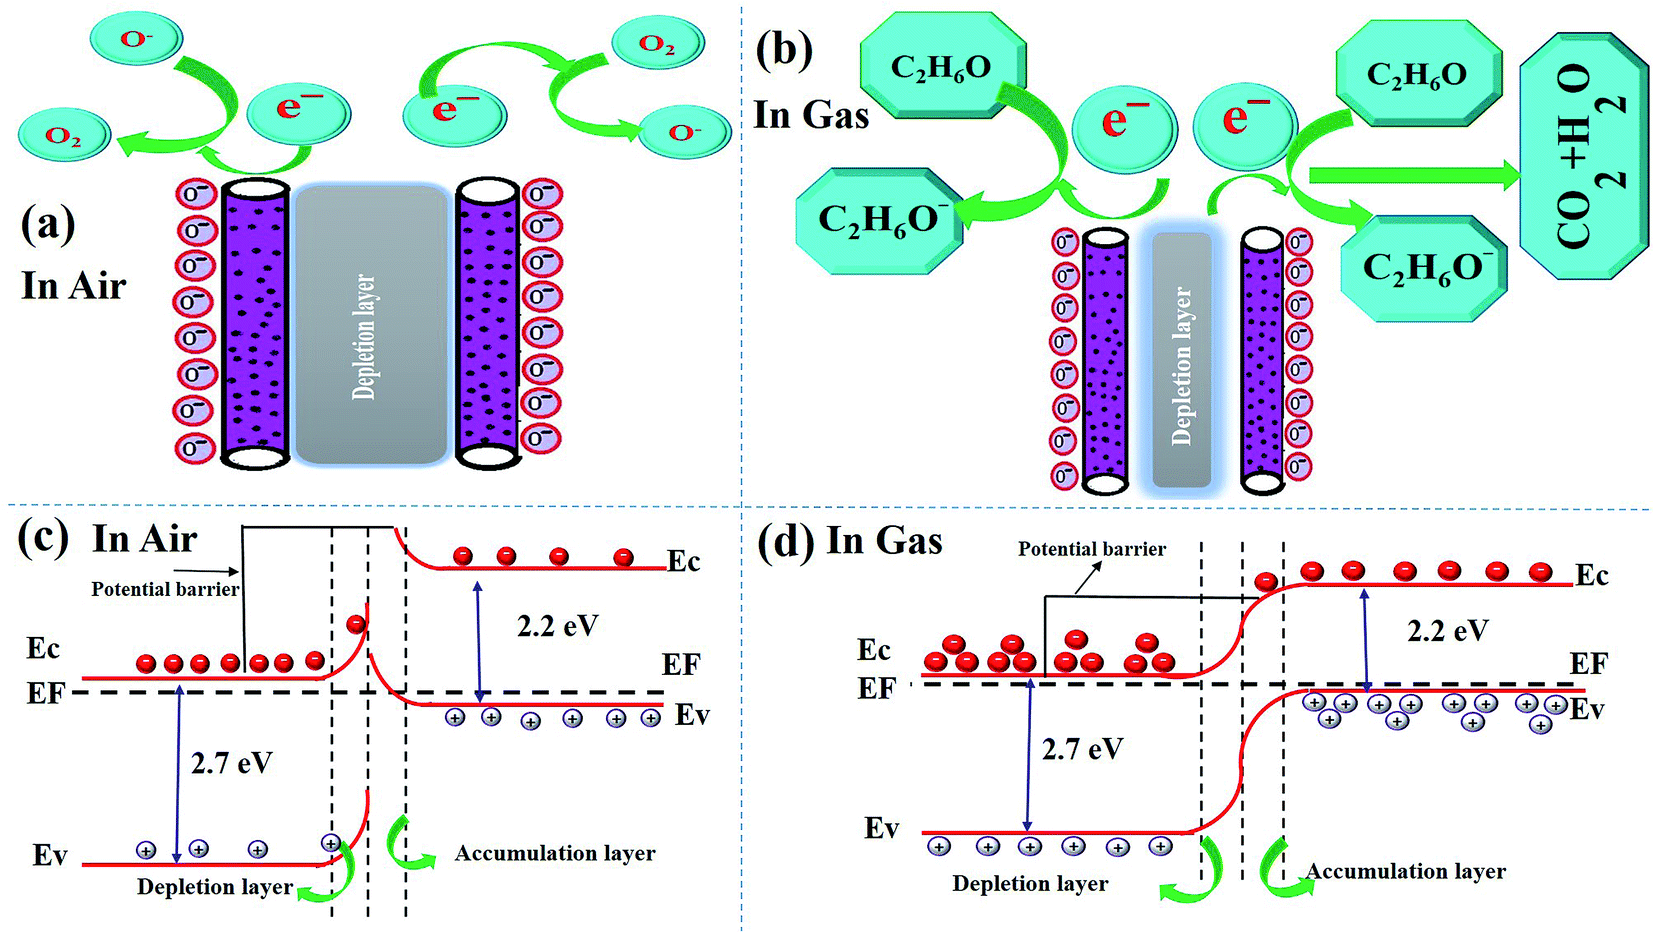
In this section, we analyze the dominant gas sensing mechanism of the above described composite sensor based on α-Bi2Mo3O12/Co3O4 nanotube-decorated particles. The proper sensing mechanism of the n/p type semiconductor metal oxides has been well studied in terms of the disparity between the electrical resistivity and conductivity, in which the chemical reaction of the gas molecules occurs during the gas adsorption, surface reaction and desorption process with oxygen species, as demonstrated by the space charge model.62,63Further studies show that the adsorption/desorption of the target gas molecules on the surface of the sensitive materials develop the reaction process and can exchange an electron, which can be enhanced by the surface adsorbed oxygen species Oδ− (O2−, O−, O2−)64,65. These electrons cause shifting variations in the resistance of the sensing layer, thereby enhancing and promoting the changes in the depletion layer, from being wide to becoming somewhat thinner. Henceforth, continuous and fast changes were witnessed in the sensitivity of the material. The photographic illustration demonstrates the impact of air and ethanol gas on the behavior of the as-prepared sensing material, as presented in Fig. 8a and b. It is quite remarkable to see what really contributes to the increased sensing response of the composite sensor based on the α-Bi2Mo3O12/Co3O4 nanotube-decorated particles in comparison to the one containing pure α-Bi2Mo3O12 nanofibers and Co3O4 nanoparticles. It seems quite obvious and plausible to argue that this profound character attributed to our sensing material comes from the creation of a p/n junction between the n-type α-Bi2Mo3O12 nanofibers and p-type Co3O4 nanoparticles. The electrical properties of α-Bi2Mo3O12 and Co3O4 have been discussed further using the Hall experiment to prove the n-type and p-type behavior in Table S1 in the ESI.† To compute the energy bandgap of the pure α-Bi2Mo3O12 nanofibers and the Co3O4 nanoparticles, a (α)2(hν)2 ∼ hν relation curve can be obtained from the UV-visible spectrum, as shown in Fig. S4a and b.† The band gap energies attributed to the n-type α-Bi2Mo3O12 nanofibers were found to be 2.7 eV and 2.2 eV for the Co3O4 nanoparticles. One can see from Fig. S4a,† that the optical spectra of the α-Bi2Mo3O12 nanofibers were observed in the visible region and the inset figure is a Tauc plot for the bandgap energy calculation. The absorption spectra signal lies in the visible region from 400–470 nm which occurs because of excitation of electrons from the valence band (VB) to the conduction band (CB). The observed results are in a good agreement with some of the previous results.66 The optical properties of the Co3O4 nanoparticles were examined by reflection measurement in the visible range 500–600 nm using a spectrophotometer, as shown in Fig. S4b,† while the inset figure shows the bandgap calculation. According to the above demonstration, the well-defined sensing mechanism of the composite based on the α-Bi2Mo3O12/Co3O4 nanotube-decorated particles before and after exposure to ethanol gas is graphically represented in Fig. 8a and b. The energy band configuration of the composite based on the α-Bi2Mo3O12/Co3O4 nanotube-decorated particles before and after exposure to ethanol gas is systematically presented in Fig. 8c and d.
 | ||
| Fig. 8 (a) and (b) Schematic sensing mechanism before exposure and after exposure of the ethanol target gas, (c) and (d) shows the bandgap energy in air and after exposure to the target gas, ethanol. | ||
Specifically, as seen in Fig. 8a, when exposing a metal oxide semiconductor to air, the adsorption of oxygen molecules takes place on the surface of the semiconductor. When the composite based on the fabricated sensor is exposed to air, a reaction occurs between the composite materials and the chemisorption of the oxygen molecules. The electrons are transferred from the CB to adsorb the oxygen atom on the surface of the sensing material to compensate for their deficiencies, which results in the formation of negatively charged oxygen species (O2−, O−, and O2−), and can be formed according to various equations.67
| O2(g) → O2(ads) | (2) |
| O2(ads) + e− → O2−(ads) | (3) |
| O2−(ads) + e− → 2O−(ads) | (4) |
| O−(ads) + e− → O2−(ads) | (5) |
However, when the α-Bi2Mo3O12/Co3O4 heterostructure is exposed to C2H5OH gas as illustrated in Fig. 8b, these exposed gases can react with the adsorbed oxygen Oδ−, and release various back scattered electrons to the CB of the fabricated sensor, which significantly reduces the potential barrier of the p/n heterojunction.68,69 When ethanol gas is injected and mixed with basic oxides such as α-Bi2Mo3O12 and Co3O4, then it could be decomposed into the intermediate species, acetaldehyde, according to the following equation:
| CH3CH2OH → CH3COH + H2 | (6) |
The chemisorbed oxygen atoms are further oxidized using the following equation:
| CH3COH + 5O− → 2CO2 + 2H2O + 5e− | (7) |
The relative opposite motion of the electrons and holes occur when the sensor is exposed to ethanol gas, this gives p/n junction interfaces that match the Fermi level energy (EF), which significantly alters the band bending. When the sensor is exposed to air, it adsorbs oxygen from the air on the surface of the composite based on the α-Bi2Mo3O12/Co3O4 sensor and forms negative oxygen species O2−, O− and O2− by capturing an electron from the CB of both the n-type α-Bi2Mo3O12 and p-type Co3O4.70 Thus, a wider depletion region arises with a higher potential barrier, which results in a low conductivity and resistivity. When the composite sensor is exposed to reductive ethanol gas, the ethanol molecule reacts chemically with the adsorbed oxygen species on the surface of the sensor and eventually breaks down to form CO2 and H2O with the release of the captured electrons back into the vacancies produced in the composite α-Bi2Mo3O12/Co3O4 crystal lattice. For this reason, the charge carrier concentration increases in the composite based on the α-Bi2Mo3O12/Co3O4 sensor, eventually leading to an improved quick response in the conductivity/resistivity. Moreover, the sensitivity response of the composite based on α-Bi2Mo3O12/Co3O4 nanotube-decorated particles shows a higher response towards ethanol owing to the decrease in the height of the potential barrier and narrowing of the depletion layer at the interface of the p/n junction effect, which increase the conductivity/resistivity of the nanocomposites as compared to the pure α-Bi2Mo3O12 nanofibers at an optimal temperature of 170 °C.
The sensing properties of the pure and composite based fabricated sample are associated with surface chemical compositional analysis and microstructures of the as-prepared sensors. Therefore, the O 1s peaks for the pristine and composite based samples were irregularly fitted into three different components,71 as shown in Fig. 4e and f. The peak binding energies are represented by the OL, Ov and Oc. The binding energies of these three deconvolution peaks were observed for the pristine sample percentile at 51.36% OL, 24.98% Ov and 23.64% Oc with ±0.2 eV errors. The percentage of the composite based sample shows the BE of the OL, Ov and Oc components sits respectively at 45.90%, 29.5% and 24.14% for the composite based on the α-Bi2Mo3O12/Co3O4 nanotube-decorated particles. The as-prepared composite based sensor has an enormous amount of Ov and Oc content on its surface, which competitively provides a stronger adsorption and active sites during the ethanol gas reaction, responsible for releasing a large number of electrons from the redox reaction leading to the enhanced gas sensing selectivity properties as compared to the pure one.44,72 Thus, our study demonstrates that an enhancement in the gas sensitivity behavior of the composite based on the α-Bi2Mo3O12/Co3O4 composite might occur due to the small size effect of the Co3O4 nanoparticles with a magnificent surface morphology that have a large number of surface oxygen species and synergetic effects boosted by the compact interfacial communication between the α-Bi2Mo3O12 nanofibers and the Co3O4 nanoparticles heterojunction.
4 Conclusion
In this work, we reported that α-Bi2Mo3O12 nanofibers were successfully synthesized using facile, highly efficient and scalable electrospun techniques, which were further functionalized and decorated by Co3O4 nanoparticles using a simple hydrothermal synthesis route followed by a calcination process at 500 °C. Based on the photographs obtained from the electron microscopy techniques, we observed that the porous nanotubes, which clearly indicate that the randomly oriented nanoparticles are deposited on the surface of nanotubes, can trigger strong bonding with the surface nanotubes. The as-prepared fabricated composite based on the α-Bi2Mo3O12/Co3O4 nanotube-decorated particles sensor shows an excellent sensing response and enhancement in the stability towards 100 ppm concentrated ethanol at an optimal lower working operating temperature of 170 °C in contrast to the pure α-Bi2Mo3O12 nanofibers and Co3O4 nanoparticles operating at 220 °C and 280 °C. The sensitivity responses of the pure Co3O4 nanoparticles, α-Bi2Mo3O12 nanofibers and the composite of the α-Bi2Mo3O12/Co3O4 nanotubes-decorated particles sensors were recorded to be 2.99, 13.10, and 30.25 respectively, corresponding to 100 ppm ethanol. The sensitivity response of the composite based on the α-Bi2Mo3O12/Co3O4 nanotubes-decorated particles sensor exhibits a higher sensing performance towards ethanol, which might arguably result from the enormous number of superficial oxygen species and interfacial effects occurring between the n/p types leading to a high charge carrier concentration. Moreover, the composite based sensor has shown a good selectivity, long term stability against a RH of 45% with an optimal operating temperature of 170 °C. In this novel work, we have demonstrated that the composite based on α-Bi2Mo3O12/Co3O4 nanotubes-decorated particles is much more effective and is a potential candidate for fabricating sensors, while making use of ethanol. It may also be used to synthesize other heterostructure materials for various applications, most notably in advanced gas sensing materials in the presence of toxic environmental gases.Conflicts of interest
We do not have any competing financial interests. All the work is based on an interest in Science and Technology.Acknowledgements
This work was supported by the National Natural Science Foundation of China (51572239, 51372224 and 91333203), and the Program for Innovative Research Team in University of Ministry of Education of China (IRT13037).References
- A. H. Jalal, F. Alam, S. Roychoudhury, Y. Umasankar, N. Pala and S. Bhansali, ACS Sens., 2018, 3, 1246–1263 CrossRef CAS PubMed.
- A. C. Rai, P. Kumar, F. Pilla, A. N. Skouloudis, S. Di, C. Ratti, A. Yasar and D. Rickerby, Sci. Total Environ., 2017, 607–608, 691–705 CrossRef CAS PubMed.
- K. Xu, C. Fu, Z. Gao, F. Wei, Y. Ying, C. Xu and G. Fu, Nanomaterial-based gas sensors: A review, Taylor & Francis, 2018, DOI:10.1080/10739149.2017.1340896.
- R. S. Andre, R. C. Sanfelice, A. Pavinatto, L. H. C. Mattoso and D. S. Correa, Mater. Des., 2018, 156, 154–166 CrossRef CAS.
- K. Vikrant, V. Kumar, Y. Sik, K. Kim and A. Deep, Trends Anal. Chem., 2018, 105, 263–281 CrossRef CAS.
- Y.-F. Sun, S.-B. Liu, F.-L. Meng, J.-Y. Liu, Z. Jin, L.-T. Kong and J.-H. Liu, Sensors, 2012, 12, 2610–2631 CrossRef CAS PubMed.
- A. Dey, Mater. Sci. Eng., B, 2018, 229, 206–217 CrossRef CAS.
- P. G. Choi, N. Izu, N. Shirahata and Y. Masuda, ACS Appl. Nano Mater., 2019, 2(4), 1820–1827 CrossRef CAS.
- X. Liu, K. Zhao, X. Sun, C. Zhang, X. Duan, P. Hou, G. Zhao, S. Zhang, H. Yang, R. Cao and X. Xu, Sens. Actuators, B, 2019, 285, 1–10 CrossRef CAS.
- Z. Zhang, X. Wang, J. Zhang, M. Yu, J. Zhang, H. Zhang and Y. Long, J. Alloys Compd., 2018, 752, 359–375 CrossRef CAS.
- A. Tereshchenko, M. Bechelany, R. Viter, V. Khranovskyy, V. Smyntyna, N. Starodub and R. Yakimova, Sens. Actuators, B, 2016, 229, 664–677 CrossRef CAS.
- X. Xu, X. Mei, P. Zhao, P. Sun, Y. Sun, X. Hu and G. Lu, Sens. Actuators, B, 2013, 186, 61–66 CrossRef CAS.
- Y. Ho, Y. Na, Y. Chan, I. Kim and J. Lee, Sens. Actuators, B, 2014, 195, 189–196 CrossRef.
- X. Chu, S. Liang, W. Sun, W. Zhang, T. Chen and Q. Zhang, Sens. Actuators, B, 2010, 148, 399–403 CrossRef CAS.
- Y. Lu, W. Zhan, Y. He, Y. Wang, X. Kong, Q. Kuang and Z. Xie, ACS Appl. Mater. Interfaces, 2014, 6(6), 4186–4195 CrossRef CAS PubMed.
- Z. Seidov, M. Aç, S. Kazan and F. Mikailzade, Ceram. Int., 2016, 42, 12928–12931 CrossRef CAS.
- K. Lokaiah, A. Kumar, S. Durgajanani, B. G. Jeyaprakash, J. Bosco and B. Rayappan, Sens. Actuators, B, 2013, 177, 19–26 CrossRef.
- Z. Lou, J. Deng, L. Wang, L. Wang and T. Zhang, Sens. Actuators, B, 2013, 182, 217–222 CrossRef CAS.
- S. Cao, P. Zhou and J. Yu, Chin. J. Catal., 2014, 35, 989–1007 CrossRef.
- L. Ye, Y. Su, X. Jin, H. Xie and C. Zhang, Environ. Sci.: Nano, 2014, 1, 90–112 RSC.
- L. D. Krenzke, J. Catal., 1980, 64, 295–302 CrossRef CAS.
- E. Luévano-hipólito, A. M. Cruz, Q. L. Yu and H. J. H. Brouwers, Appl. Catal., A, 2013, 468, 322–326 CrossRef.
- M. M. Bettahar, G. Costentin and L. Savary, Appl. Catal., A, 1996, 145, 1–48 CrossRef CAS.
- P. A. Batist, J. F. H. Bouwens and G. C. A. Schuit, J. Catal., 1972, 25, 1–11 CrossRef CAS.
- A. M. Cruz, S. M. G. M. Villarreal, L. M. Torres-martínez, E. L. Cuéllar and U. O. Méndez, Mater. Chem. Phys., 2008, 112, 679–685 CrossRef.
- F. Abraham, R.-N. Vannier, G. Nowogrocki and G. Mairesse, J. Solid State Chem., 1999, 142, 294–304 CrossRef.
- V. Marinova and M. Veleva, Opt. Mater., 2002, 19, 329–333 CrossRef CAS.
- T. Sekiya, A. Tsuzuki and Y. Torii, Mater. Res. Bull., 1986, 21, 601–608 CrossRef CAS.
- V. Demarne and A. Grisel, Sens. Actuators, 2007, 13, 301–313 CrossRef.
- Y. Xu and W. Zhang, Appl. Catal. B Environ., 2013, 140–141, 306–316 CrossRef CAS.
- X. Qin, H. Cheng, W. Wang, B. Huang, X. Zhang and Y. Dai, Mater. Lett., 2013, 100, 285–288 CrossRef CAS.
- A. F. van den Elzen and G. D. Rieck, Acta Crystallogr., Sect. B: Struct. Sci., Cryst. Eng. Mater., 1973, 29, 2433–2436 CrossRef CAS.
- X. Ge, C. D. Gu, X. L. Wang and J. P. Tu, J. Phys. Chem. C, 2014, 118(2), 911–923 CrossRef CAS.
- Y. Liang, Nat. Mater., 2011, 10, 780–786 CrossRef CAS PubMed.
- J. P. Cheng, X. Chen, J.-S. Wu, F. Liu, X. B. Zhang and V. P. Dravid, CrystEngComm, 2012, 14, 6702–6709 RSC.
- J. M. Xu, J. Zhang, B. B. Wang and F. Liu, J. Alloys Compd., 2015, 619, 361–367 CrossRef CAS.
- B. W. Li, L. Xu and J. Chen, Adv. Funct. Mater., 2005, 15, 851–857 CrossRef.
- X.-Yu Xue, S. Yuan, L.-L. Xing, Z.-H. Chen, B. He and Y.-J. Chen, Chem. Commun., 2011, 47, 4718–4720 RSC.
- K. Jain, R. P. Pant and S. T. Lakshmikumar, Sens. Actuators, B, 2006, 113, 823–829 CrossRef CAS.
- L. Li, C. Zhang and W. Chen, Nanoscale, 2015, 12133–12142 RSC.
- H. R. Kim, A. Haensch, I. D. Kim, N. Barsan, U. Weimar and J. H. Lee, Adv. Funct. Mater., 2011, 21, 4456–4463 CrossRef CAS.
- Z. Wen, L. Zhu, W. Mei, L. Hu, Y. Li and L. Sun, Sens. Actuators, B, 2013, 186, 172–179 CrossRef CAS.
- M. Haq, Z. Wen, Z. Zhang, S. Khan, Z. Lou and Z. Ye, Sci. Rep., 2018, 1–12 Search PubMed.
- E. Comini and G. Sberveglieri, Mater. Today, 2010, 13, 36–44 CrossRef CAS.
- S. Wlodek, K. Colbow and F. Consadori, Sens. Actuators, B, 1991, 3, 63–68 CrossRef CAS.
- W. C. Wen, T. I. Chou and K. T. Tang, Micromachines, 2019, 10, 598 CrossRef PubMed.
- L. Hou, C. M. Zhang, P. Ma, L. Li, K. K. Zhu, X. F. Kang and W. Chen, Chin. J. Anal. Chem., 2018, 46, e1854–e1862 Search PubMed.
- M. R. Alenezi, A. S. Alshammari, K. D. G. I. Jayawardena, M. J. Beliatis, S. J. Henley and S. R. P. Silva, J. Phys. Chem. C, 2013, 117, 17850–17858 CrossRef CAS PubMed.
- H. Kim and J. Lee, Sens. Actuators, B, 2014, 192, 607–627 CrossRef CAS.
- W. Li, X. Wu, N. Han, J. Chen, X. Qian, Y. Deng, W. Tang and Y. Chen, Sens. Actuators, B, 2016, 225, 158–166 CrossRef CAS.
- G. Heiland and D. Kohl, Physical and Chemical Aspects of Oxidic Semiconductor Gas Sensors, Kodansha Ltd, 2013 Search PubMed.
- Z. Bai, C. Xie, M. Hu, S. Zhang and D. Zeng, Mater Sci Eng B Solid State Mater Adv Technol, 2008, 149, 12–17 CrossRef CAS.
- C. Gu, Y. Cui, L. Wang, E. Sheng, J. J. Shim and J. Huang, Sens. Actuators, B, 2017, 241, 298–307 CrossRef CAS.
- D. Chen, J. Xu, Z. Xie and G. Shen, ACS Appl. Mater. Interfaces, 2011, 3(6), 2112–2117 CrossRef CAS PubMed.
- B. Huang, Z. Zhang, C. Zhao, L. Cairang and J. Bai, Sens. Actuators, B, 2018, 255, 2248–2257 CrossRef CAS.
- S. Yan, J. Xue and Q. Wu, Sens. Actuators, B, 2018, 275, 322–331 CrossRef CAS.
- H. Lian, Y. Feng, Z. Wang, L. Liu, X. Guo and X. Wang, Appl. Phys. A, 2017, 123, 1–6 CrossRef CAS.
- K. Zhang, S. Qin, P. Tang, Y. Feng and D. Li, J. Hazard. Mater., 2020, 391, 122191 CrossRef CAS PubMed.
- C. S. Reddy, G. Murali, A. S. Reddy, S. Park and I. In, J. Alloys Compd., 2020, 813, 152251 CrossRef CAS.
- J. N. Mao, B. Hong, H. D. Chen, M. H. Gao, J. C. Xu, Y. B. Han, Y. T. Yang, H. X. Jin, D. F. Jin, X. L. Peng, J. Li, H. L. Ge and X. Q. Wang, J. Alloys Compd., 2020, 827, 154248 CrossRef CAS.
- Q. Chen, S. Y. Ma, X. L. Xu, H. Y. Jiao, G. H. Zhang, L. W. Liu, P. Y. Wang, D. J. Gengzang and H. H. Yao, Sens. Actuators, B, 2018, 264, 263–278 CrossRef CAS.
- H. Kim and J. Lee, Sens. Actuators, B, 2014, 192, 607–627 CrossRef CAS.
- D. Ju, H. Xu, Z. Qiu, Z. Zhang, Q. Xu, J. Zhang, J. Wang and B. Cao, ACS Appl. Mater. Interfaces, 2015, 7(34), 19163–19171 CrossRef CAS PubMed.
- L. Li, M. Liu, S. He and W. Chen, Anal. Chem., 2014, 86(15), 7996–8002 CrossRef CAS PubMed.
- Y. Wang, S. Wang, H. Zhang, X. Gao, J. Yang and L. Wang, J. Mater. Chem. A, 2014, 7935–7943 RSC.
- H. Li, K. Li and H. Wang, Mater. Chem. Phys., 2009, 116, 134–142 CrossRef CAS.
- M. M. Hashemi, A. Nikfarjam, H. Hajghassem and N. Salehifar, J. Phys. Chem. C, 2020, 124(1), 322–335 CrossRef CAS.
- L. Zhu, W. Zeng, J. Yang and Y. Li, Ceram. Int., 2018, 44, 19825–19830 CrossRef CAS.
- J. Sun, L. Sun, S. Bai, H. Fu, J. Guo, Y. Feng, R. Luo, D. Li and A. Chen, Sens. Actuators, B, 2019, 285, 291–301 CrossRef CAS.
- K. Wetchakun, T. Samerjai, N. Tamaekong, C. Liewhiran, C. Siriwong, V. Kruefu, A. Wisitsoraat, A. Tuantranont and S. Phanichphant, Sens. Actuators, B, 2011, 160, 580–591 CrossRef CAS.
- X. Sun, X. Hu, Y. Wang, R. Xiong, X. Li, J. Liu, H. Ji, X. Li, S. Cai and C. Zheng, J. Phys. Chem. C, 2015, 119, 3228–3237 CrossRef CAS.
- M. R. Alenezi, A. S. Alshammari, K. D. G. I. Jayawardena, M. J. Beliatis, S. J. Henley and S. R. P. Silva, J. Phys. Chem. C, 2013, 117, 17850–17858 CrossRef CAS PubMed.
Footnote |
| † Electronic supplementary information (ESI) available. See DOI: 10.1039/d0ra02591g |
| This journal is © The Royal Society of Chemistry 2020 |