DOI:
10.1039/D0RA02329A
(Paper)
RSC Adv., 2020,
10, 18624-18631
Active control of salinity-based power generation in nanopores using thermal and pH effects†
Received
12th March 2020
, Accepted 7th May 2020
First published on 15th May 2020
Abstract
Harvesting blue energy from saline solutions has attracted much attention recently. Salinity-based power generation in nanopores is governed by both passive factors (e.g., the nanopore diameter, nanopore length, nanopore material, and pore density) and active factors (e.g., the concentration gradient, temperature, and pH environment). The present study performs COMSOL multiphysics numerical simulations based on the Poisson–Nernst–Planck equations, Navier–Stokes equations and heat transfer equation to examine the combined effects of the temperature gradient and pH level on the diffusion voltage and maximum power generation in single silica nanopores with lengths of 100 nm and 500 nm, respectively. In performing the simulations, the pH value is adjusted in the range of pH 5–11, the salinity concentration gradient is 100-fold and 1000-fold, respectively. Three different thermal conditions are considered, namely (1) isothermal-room temperature (298 K); (2) asymmetric thermal (temperature of low-concentration reservoir and high-concentration reservoir are 323 K and 298 K, respectively); and (3) isothermal-high temperature (323 K). The results show that the generated power varies significantly with both the pH level and the temperature conditions. In particular, the asymmetric thermal condition yields an effective improvement in the power generation performance since it reduces the surface charge density on the surface of the nanopore near the low-concentration end and therefore suppresses the ion concentration polarization (ICP) effect. The improvement in the energy harvesting performance is particularly apparent at pH levels in the range of 9–10 (about 100% higher than that of pH 7). Overall, the results confirm the feasibility of using active factors to enhance the power generation performance of salinity gradient-based nanopore systems.
1. Introduction
Electrokinetic energy conversion in nanopores was theoretically analyzed in the past.1–4 Recently, energy conversion from saline electrolytes has attracted great interest and led to the emergence of a new class of clean energy technology referred to as blue energy harvesting.5–7 Many methods have been proposed for generating power from ion concentration distributions within electrolyte solutions based on osmosis (e.g., forward osmosis, pressure-retarded osmosis, and reverse osmosis) or reverse electrodialysis (RED).8–14 In RED methods, a salt concentration gradient is established across a nanopore and the resulting ion flow produces an electrical current, which is collected by electrodes. However, boosting the power generation and improving the energy efficiency of nanofluidic RED (NRED) systems represents a major challenge in practical application or economic purpose.7 Among the various materials which have been proposed for nanopore applications, graphene, molybdenum disulphide, and boron nitride are among the most commonly used to improve the quality of nanopore.15–17 However, while these materials have a high surface charge density, an ultrathin characteristic and a nanoscale pore diameter, they are expensive and complicated in fabrication and have a limited ion flux and high entrance effect.5,18
The power generation in NRED strongly depends on salinity concentration transport through nanopore. Surface charge density of nanopore plays important role in ion-selectivity through the nanopore (i.e., nanopore with negative surface charge permits a higher counter-ion transport than that of co-ion). Due to the ion-selectivity, counter-ion from high-concentration reservoir can diffuse more easily than co-ion to low-concentration reservoir. Thus, the osmotic voltage is generated, and then blue energy can be harvested based on the ion transport process. Single nanopore provides an attractive solution for power generation since their small effective areas result in a high power density. However, generating sufficient power to realize small portable power supplies remains a formidable challenge.5,7 Several studies have attempted to increase the ion flux using large-scale 2D or 3D membranes.19–22 Such membranes have a high ion flux, good mechanical strength and the potential for large-scale production. However, as the nanopore density on the membrane surface increases, the pore–pore interaction and ion concentration polarization (ICP) effect also increase and result in a significant reduction in the power generation.23 For a given NRED system, the power generation is effectively constant for a given nanopore material, nanopore diameter, nanopore length and nanopore number (i.e., passive control factors). Thus, in recent years, the problem of enhancing the power generation by using active control factors such as the pH level and thermal condition to diminish the pore-to-pore interaction and reduce the ICP effect has attracted growing attention.
Some studies have shown that the pH level of the electrolyte in a NRED system has a direct effect on the performance of the electric double layer (EDL) in attracting and repelling counter-ions and co-ions, respectively.24–27 In particular, the appearance of protons within the nanofluidic channel activates protonation and deprotonation reactions of the functional groups on the nanopore wall. The balance between these two reactions may either strengthen or weaken, depending on the particular nanochannel material involved.24,26 For nanopore walls with silanol functional groups, the concentration of a large number of protons near the EDL suppresses the attraction of counter-ions to the nanochannel wall.28 As a result, the surface charge density is decreased as protons increase. Several studies have investigated the feasibility for utilizing low-grade waste or solar heat energy to enhance the performance of blue energy systems.29–31 The results have shown that for salinity-based gradient systems, ion transport inside the nanofluidic is an important process. Hence, the application of heat source to the NRED enhances the ion flux diffusion through the nanopore and improves the power generation performance as a result.32,33
However, while the literature contains many studies on the individual effects of the pH level and temperature condition on the ion transport process in nanopores,26,34–38 the combined effects of the two conditions are not well understood. Previous studies have demonstrated experimentally that both temperature and pH conditions influence on the copolymer structure of nanopore (i.e., copolymer poly(ethylene terephthalate)–poly(acrylic acid)).39,40 The present study performs multiphysics simulations to examine the combined effects of the pH level and temperature condition on the ion diffusion process in a single silica nanopore with a radius of 7.5 nm. The simulations consider pH values in the range of pH 5–11 and both isothermal and asymmetric thermal conditions. In general, the results show that the power generation performance of the nanopore system is enhanced through the application of a higher temperature to the low-concentration reservoir; particularly at pH values in the range of 9–10.
2. Related theory and numerical modeling
2.1 Theoretical model
The ion transport and potential interactions in the nanopore were modeled using the Nernst–Planck equation and Poisson equation, respectively. The flow field induced by the ion concentration gradient was modeled using the Navier–Stokes equations. Finally, the effect of temperature gradient on the chemical potential and Gibbs energy free mixing of the ion species was added into ionic flux.41,42 The governing equation for the flux of the ith ionic species through the nanopore was thus formulated as follows:| |
 | (1) |
| |
 | (3) |
where ϕ is the electric potential, εr is the relative permittivity in solution, ε0 is the permittivity of a vacuum, and F is the Faraday constant. In addition, ci is the concentration of the ith ionic species, while zi is the valence, Di is the diffusivity, and αi is the reduced Soret coefficient.
The temperature dependence of the relative charge permittivity was modeled as εr = exp[4.47 − 4.6 × 10⁻³(dT) + 2.695 × 10⁻⁷(dT)2], where dT = T − 273.15(K) and 0 ≤ dT ≤ 100. In addition, the temperature dependence of the diffusivity was modeled as31
| |
 | (4) |
where
λ0i is the limiting molar conductivity of the
ith ionic species (
i.e., K
+, Cl
−, H
+, and OH
−) in the present case).
Table 1 shows the change in
λ0i with respect to the temperature for each of the four species. In the present simulations, the inertial term in the Navier–Stokes equations was ignored for computational simplicity as
| |
 | (5) |
where
p,
u, and
μ are the pressure, flow field velocity and viscosity, respectively. The potential and temperature gradients both contribute a body force to the flow field. The last two terms on the left-hand side of
eqn (5) represent the Korteweg–Helmholtz electric body force, where the third term

represents the electrostatic body force produced by the interaction of the free charges in the fluid, while the fourth term

represents the dielectric body force produced by inhomogeneities in the permittivity of the electrolyte.
43–45 The viscosity of the electrolyte solution (KCl) varies in accordance with the temperature as
μT = 2.414 × 10
−5 × 10
247.8/(T−140), where the temperature is obtained from the heat transfer equation as
where
ρ,
Cp and
k are the density, specific capacity and thermal conductivity of the electrolyte, respectively.
Table 1 Change in λ0i with respect to temperature (note that δT is temperature difference between heat source and reference temperature of 298.15 K, i.e., δT = T − 298.15)
| λ0i |
×1 |
×(δT) |
×10−3(δT)2 |
×10−5(δT)3 |
| K+ |
73.5 |
1.43262 |
4.05 |
−3.183 |
| Cl− |
76.35 |
1.54037 |
4.65 |
1.285 |
| H+ |
349.85 |
4.816 |
−10.3125 |
−7.67 |
| OH− |
199.2 |
3.52 |
8.27 |
7.12 |
The deprotonation (protonation) reaction of the silanol functional group (SiOH) on the nanopore wall in the presence of the KCl electrolyte was modeled as SiOH ⇄ SiO− + H+ (SiOH + H+ ⇄ SiOH2+); with the equilibrium constants of the two reactions being expressed as kA = [SiO−][H+]/[SiOH] and kB = [SiOH2+]/([SiOH][H+]), respectively. A reduction of pH provides more protons remained in the electrolyte yielding to slow down the deprotonation reaction and increase the protonation reaction. Consequently, more positive functional group SiOH2+ appears in the surface of the nanopore. Therefore, the surface charge density is reduced. Similarly, as the pH increases, the electrolyte contains less proton and the deprotonation reaction is increased. As a result, the surface of the nanopore contains more negative functional group SiO− to yield higher negative surface charge density.
Finally, the surface charge density on the nanopore surface was modeled as28
| |
 | (8) |
where
σ0 is the basic charge density, p
KA is defined as −log
![[thin space (1/6-em)]](https://www.rsc.org/images/entities/char_2009.gif) kA
kA, p
KB is defined as −log
![[thin space (1/6-em)]](https://www.rsc.org/images/entities/char_2009.gif) kB
kB, and [H
+]
s is the surface proton concentration.
2.2 Numerical modeling
The equations given above were solved numerically by COMSOL multiphysics simulations (COMSOL, Inc.) with coupling relations between the transport dilute species, electrostatics, flow field, and heat transfer modules. The simulations aimed to investigate the combined effect of the thermal conditions and pH level on the variation of the power generation within a single nanopore (see Fig. 1). In solving the numerical model, the nanopore was assumed to have a radius of 7.5 nm and the pore length was set as 100 nm or 500 nm. Moreover, the widths and lengths of the two reservoirs were set as 1000 × 1000 nm2. The surface charge density on the nanopore wall was computed using eqn (8) with the basic charge (σ0) set equal to −0.16 C m−2 in accordance with the experimental results.46 The detailed power calculation is described in Section S.1 (ESI†). The pH level was set in the range of 5 to 11, while the deprotonation and protonation reaction constants (pKA and pKB) were set as 6.0 and 3.0, respectively.28 Finally, three thermal conditions were considered, namely (1) isothermal-room temperature (298L/298R K); (2) asymmetric (298L/323R K); and (3) isothermal-high temperature (323L/323R K) (note that subscripts L and R denote the left- and right-reservoirs in Fig. 1(b), respectively). Full details of the simulation process and verification settings are provided in ESI Sections S.2–S.5.†
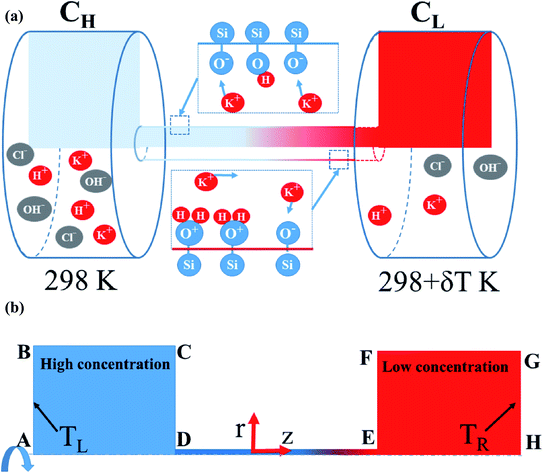 |
| | Fig. 1 (a) Schematic illustration showing diffusion of multi-ions through silanol nanopore. (b) Axisymmetric model. | |
3. Results and discussion
3.1 Comparison of power generation performance between isothermal and asymmetric thermal cases
Fig. 2 shows the diffusion voltage and maximum power generation within the nanopore for the three thermal conditions described above and pH values in the range of 5 to 11. Note that the pore length is 100 nm and a 100-fold concentration gradient is applied across the nanopore. For all three thermal conditions, the diffusion voltage increases as the pH level increases from 5 to 10, but then decreases as the pH level is further increased to 11. Furthermore, for all values of the pH, the voltage induced by the asymmetric thermal condition (298L/323R K) is greater than that produced by the isothermal-room temperature condition (298L/298R K) or isothermal-high temperature condition (323L/323R K). For example, at pH 10, the voltage produced under the asymmetric thermal condition is 25 mV higher than that produced under the isothermal-room temperature condition. In other words, the application of a uniform high temperature to both sides of the nanopore not only wastes thermal energy, but also reduces the diffusion voltage. For all values of the pH, the power generation performance under the isothermal-room temperature condition is lower than that under the other two conditions. The performance advantage of the asymmetric and room-temperature isothermal conditions becomes increasingly apparent at higher pH values. For example, the maximum power generation of the asymmetric condition (4.26 pW, pH 11) is around twice that of the isothermal-room temperature condition (2.19 pW, pH 11). For both high-temperature conditions, the maximum power generation increases continuously with increasing pH. At pH values in the range of 5–8, both conditions result in a similar power generation performance. However, as the pH value is further increased over the range of pH 9–11, a small performance improvement of the asymmetric thermal condition is observed. Fig. S7(a) (see ESI Section S.6†) shows the power generation under effect of thermal conditions at pH 7 which provides the explanation from experiment point of view for the finding in Fig. 2.
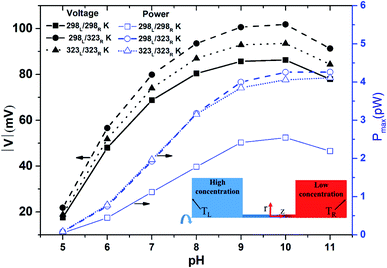 |
| | Fig. 2 Diffusion voltage and maximum power generation for different pH conditions with 100 nm pore length and 100-fold concentration. Three thermal conditions are considered: (1) isothermal-room temperature (298L/298R K); (2) asymmetric thermal gradient (298L/323R K); and (3) isothermal-high temperature (323L/323R K) (note that the solid line shows the isothermal-room temperature case, the dashed line shows the asymmetric thermal case, and the dotted line shows the isothermal-high temperature case). | |
Fig. 3(a) and (b) show the diffusion voltage and maximum power generation in a nanopore of length 500 nm given the use of 100-fold and 1000-fold concentration gradients, respectively. Previous studies have shown that the pore resistance in nanofluidic systems is proportional to the pore length.23 Moreover, a shorter nanopore length results in a stronger ion concentration polarization (ICP) effect.47 Thus, for a pore length of 500 nm, the pore resistance is increased compared to that for a pore length of 100 nm, while the ICP intensity is decreased. Under such conditions, the diffusion voltage difference between the asymmetric thermal condition and the isothermal-high temperature condition is much less than that for the shorter nanopore length of 100 nm under the same concentration gradient (100-fold) (cf. Fig. 2 and 3(a)). Although the higher pore resistance increases the power generation under the isothermal-high temperature condition, the maximum generated power approximates that produced under the asymmetric thermal condition. Lin et al. reported that a high-concentration gradient enhances the ion enrichment effect at the low-concentration end.48 Similarly, Cao et al. showed that the application of a high-concentration gradient over a small channel length leads to a significant reduction in the transference number.47 In other words, the imposition of a 1000-fold concentration gradient results in a stronger ICP effect than that produced under a 100-fold concentration gradient. Consequently, comparing Fig. 3(a) and (b), it is seen that for a larger concentration gradient, the effect of the asymmetric thermal condition in improving the voltage and generated power compared to the isothermal cases (both room temperature and high-temperature) is enhanced.
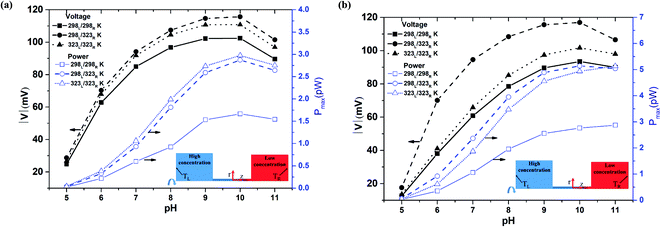 |
| | Fig. 3 Diffusion voltage and maximum power generation for different pH conditions and 500 nm pore length: (a) 100-fold concentration gradient, (b) 1000-fold concentration gradient. | |
3.2 Effect of thermal conditions and pH level on surface charge density
Previous studies have reported that the energy produced in nanofluidic energy harvesting systems increases as the surface charge density on the nanochannel surface increases.15,17 However, the ICP effect produced at the low-concentration end of the nanopore also increases with an increasing surface charge density, and tends to reduce the voltage diffusion accordingly.25,26,47 As shown in Fig. 2 and 3, the maximum power generation increases as the pH level increases from 5–10, but decreases as the pH is further increased to pH 11. Referring to eqn (8), the surface charge density increases with an increasing pH due to a lower proton concentration (see also ESI Section S.3†). For pH values in the range of 5–10, the effect of the surface charge density in prompting ion diffusion outweighs the effect of ICP in suppressing ion diffusion. Thus, the voltage increases with increasing pH. However, at pH 11, the surface charge density reaches its maximum value and maximizes the ICP effect, thereby reducing the diffusion voltage.
Fig. 4(a) and (b) show the variation of the surface charge density along the nanopore length under 100-fold and 1000-fold concentration gradients, respectively (note that the results relate to the open-circuit voltage case with pH 9 and a nanopore length of 500 nm). For both concentration gradients, the asymmetric thermal condition results in a slightly lower surface charge density than the isothermal cases. Moreover, a slight reduction in the surface charge density occurs immediately before the low-concentration end. Notably, both isothermal cases (i.e., room temperature and high temperature) result in a similar surface charge density. It is speculated that this may account for the difference in the induced voltage between the asymmetrical case and the isothermal cases shown in Fig. 2 and 3. Overall, the results presented in Fig. 2–4 suggest that the improved nanofluidic power generation performance achieved under isothermal-high temperature conditions compared to that under isothermal-room temperature conditions stems from the higher diffusivity coefficient in eqn (4).31 In the asymmetric thermal case, a slight reduction in the surface charge density at the low-concentration end leads to a higher diffusion voltage. Comparing Fig. 4(a) and (b), it is seen that the difference between the surface charge density produced under the asymmetric thermal condition and the isothermal conditions, respectively, increases under a larger concentration gradient. As a result, the difference between diffusion voltage produced under the asymmetric thermal and isothermal conditions with a 1000-fold concentration gradient is greater than that produced under a 100-fold concentration gradient (cf. Fig. 3(a) and (b)). The surface change density distributions obtained under pH 7 are similar to those shown in Fig. 4 (see Fig. S3 in ESI Section S.3†). However, the difference in the surface charge densities obtained under the asymmetric thermal condition and the isothermal conditions, respectively, at pH 7 is less pronounced than that at pH 9. Consequently, the diffusion voltage at pH 7 is less than that at pH 9 (as shown in Fig. 3(a) for a 100-fold concentration gradient, for example).
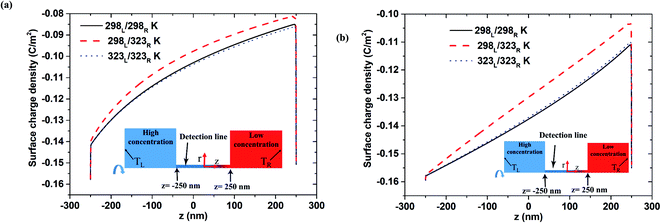 |
| | Fig. 4 Surface charge density distribution for 500 nm pore length and pH 9 condition in open-circuit voltage case: (a) 100-fold concentration gradient, (b) 1000-fold concentration gradient. | |
Fig. 5(a) shows the surface charge density distribution for the short-circuit case with pH 9, a 500 nm pore length, and a 1000-fold concentration gradient. As for the open-circuit case (Fig. 4(a)), a sudden drop in the surface charge density is observed at the low-concentration end under all three thermal conditions. This observation is consistent with that reported in previous studies, which showed that the lower surface charge density leads to a reduced ion enrichment effect.25,47 A similar tendency is also observed under lower pH conditions (pH 7; see Fig. S4†).
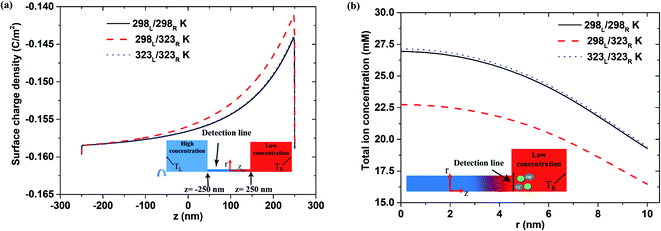 |
| | Fig. 5 (a) Surface charge density distribution and (b) total ion concentration at interface between nanopore (500 nm pore length) and low-concentration reservoir given pH 9 condition, short-circuit current case and 1000-fold concentration gradient. | |
Fig. 5(b) shows the total ion concentration distribution (i.e., K+, Cl−, H+ and OH−) near the interface between the nanopore and the low-concentration reservoir under the three thermal conditions. It is seen that the asymmetric thermal condition results in a significantly lower total ion concentration than the two isothermal cases. Furthermore, for the isothermal conditions, a higher temperature results in only a small increase in the total ion concentration. Hence, it is surmised that the ion enrichment effect at the low-concentration side is diminished primarily by the reduction in the surface charge density under asymmetric thermal case rather than the isothermal cases.
3.3 Effect of thermal conditions on flow field
Fig. 6 shows the velocity flow field near the interface between the low-concentration reservoir and the nanopore. For all three thermal conditions, the flow field has a U-shape velocity profile. However, the magnitude of the velocity obtained under lower temperature conditions is less than that under higher temperatures due to the corresponding reduction in the diffusion coefficient (eqn (4)). Generally speaking, ions tend to move from high- to low-concentration (or high- to low-density) regions. Under asymmetric thermal conditions, in which the ions concentrate near the low-concentration end, the ions diffuse readily to the low-concentration reservoir under the effects of the higher temperature in the reservoir. For the isothermal-high temperature case, the entire system is maintained at a high temperature, and hence the velocity profile is slightly higher than that for the asymmetric thermal case. Overall, however, the results presented in Fig. 6 show that the higher diffusion velocity obtained under elevated temperature conditions is the result primarily of the application of an asymmetric thermal condition rather than the imposition of a uniform higher temperature at both reservoirs.
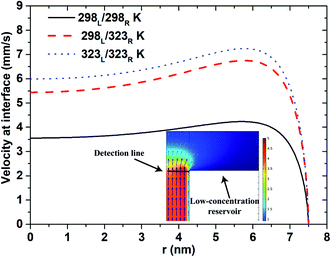 |
| | Fig. 6 Velocity profile at interface between nanopore (500 nm pore length) and low-concentration reservoir given pH 10 condition, short-circuit current case and 100-fold concentration gradient. | |
3.4 Effects of asymmetric thermal conditions on power generation
Fig. 7(a) compares the power generation performance under pH values of 7 and 10, respectively, as a function of the temperature gradient (δT = 0–45 K) across the nanopore length. As shown in ESI Section S.3,† the surface charge density at pH 10 is higher than that at pH 7. However, for both pH values, a temperature difference of 25 K between the two reservoirs leads to a lower surface charge density near the low-concentration reservoir (see Fig. S3 and S4†). As shown in Fig. 7(a), for pH 10, the diffusion voltage and power both increase proportionally with the magnitude of the temperature gradient. However, for pH 7, the diffusion voltage saturates at temperature gradients higher than δT = 35 K. Referring to Fig. 7(b), it is seen that the surface charge reduces with a higher value of δT. From Fig. 7(a), it is surmised that under lower pH conditions (pH 7), the reduction in the surface charge density at temperature gradients greater than δT = 35 K results in a serious degradation of the power generation performance. The experimental results shown in Fig. S7(b) (see ESI Section S.6†) further support to the simulation results in Fig. 7(a).
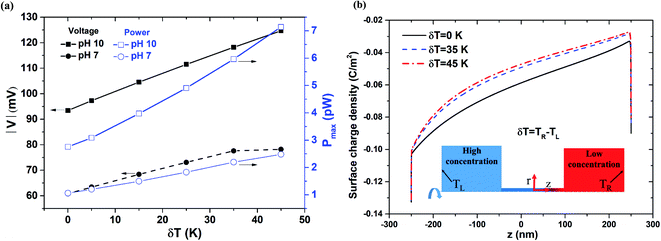 |
| | Fig. 7 (a) Diffusion voltage and maximum power generation change with respect to temperature gradient for 500 nm pore length, pH 7 and pH 10 conditions, and 1000-fold concentration gradient. (b) Surface charge density distribution along nanopore length for different temperature gradients. | |
4. Conclusion
This study has performed a numerical investigation into the combined effects of the pH level and temperature conditions on the power generation performance in a nanopore. In general, the results have shown that a higher pH level leads to the domination of the deprotonation reaction of the silanol functional groups and hence increases the surface charge density. The power generation increases as the pH level increases from pH 5 to pH 10, but reduces as the pH level further increases to pH 11 due to a strong ICP effect. Regarding the thermal conditions, it has been shown that an asymmetric thermal condition yields a significant improvement in the power generation performance compared to that achieved under isothermal conditions. The improved power generation can be attributed to the effects of the asymmetric thermal condition in reducing the surface charge density at the low-concentration end, which results in turn in a lower ion enrichment effect. In addition, higher temperature contributes to increasing ion velocity (ion flux) through the nanopore by increasing the ion diffusion. The results show that the increasing velocity is due to the high temperature at the low-concentration reservoir resulting ICP reduction. For pH 7, the application of a high temperature gradient (δT = 45 K) across the nanopore yields no significant improvement in the diffusion voltage compared to that obtained for δT = 35 K. However, for pH 10, the voltage and power both increase proportionally as the temperature difference between the two reservoirs increases from δT = 0 to δT = 45 K. Overall, the present results confirm that the pH level and thermal conditions are both viable factors for implementing the active control of the power generation performance of salinity gradient-based nanofluidic systems.
Author contributions
R. J. Y. directed the project and edited the manuscript. V. P. M. built the COMSOL models, and wrote the draft manuscript.
Conflicts of interest
There are no conflicts to declare.
Acknowledgements
The authors gratefully acknowledge the financial support provided to this study by the Ministry of Science and Technology (MOST) of Taiwan under Project No. 107-2221-E-006-127-MY3.
References
- X. Xuan and D. Li, J. Power Sources, 2006, 156, 677–684 CrossRef CAS
 .
. - C. Davidson and X. Xuan, J. Power Sources, 2008, 179, 297–300 CrossRef CAS
 .
. - C.-C. Chang and R.-J. Yang, Microfluid. Nanofluid., 2010, 9, 225–241 CrossRef
 .
. - C.-C. Chang and R.-J. Yang, Appl. Phys. Lett., 2011, 99, 083102 CrossRef
 .
. - K. Xiao, L. Jiang and M. Antonietti, Joule, 2019, 3, 2364–2380 CrossRef CAS
 .
. - Y.-Y. Sun, V.-P. Mai and R.-J. Yang, Appl. Energy, 2020, 261, 114435 CrossRef CAS
 .
. - A. Siria, M.-L. Bocquet and L. Bocquet, Nat. Rev. Chem., 2017, 1, 0091 CrossRef CAS
 .
. - N. Y. Yip and M. Elimelech, Environ. Sci. Technol., 2011, 45, 10273–10282 CrossRef CAS PubMed
 .
. - A. Altaee, J. Zhou, A. Alhathal Alanezi and G. Zaragoza, Appl. Energy, 2017, 206, 303–311 CrossRef
 .
. - H.-C. Yeh, C.-C. Chang and R.-J. Yang, RSC Adv., 2014, 4, 2705–2714 RSC
 .
. - L. Cao, W. Guo, W. Ma, L. Wang, F. Xia, S. Wang, Y. Wang, L. Jiang and D. Zhu, Energy Environ. Sci., 2011, 4, 2259–2266 RSC
 .
. - K. C. Hon, C. Zhao, C. Yang and S. C. Low, Appl. Phys. Lett., 2012, 101, 143902 CrossRef
 .
. - Y. Jiao, C. Yang and Y. Kang, J. Phys. Chem. C, 2014, 118, 10574–10583 CrossRef CAS
 .
. - Y. Jiao, C. Zhao, Y. Kang and C. Yang, Microfluid. Nanofluid., 2019, 23, 36 CrossRef
 .
. - A. Siria, P. Poncharal, A.-L. Biance, R. Fulcrand, X. Blase, S. T. Purcell and L. Bocquet, Nature, 2013, 494, 455 CrossRef CAS PubMed
 .
. - R. C. Rollings, A. T. Kuan and J. A. Golovchenko, Nat. Commun., 2016, 7, 11408 CrossRef CAS PubMed
 .
. - J. Feng, M. Graf, K. Liu, D. Ovchinnikov, D. Dumcenco, M. Heiranian, V. Nandigana, N. R. Aluru, A. Kis and A. Radenovic, Nature, 2016, 536, 197 CrossRef CAS PubMed
 .
. - C. Lee, L. Joly, A. Siria, A.-L. Biance, R. Fulcrand and L. Bocquet, Nano Lett., 2012, 12, 4037–4044 CrossRef CAS PubMed
 .
. - X. Sui, Z. Zhang, C. Li, L. Gao, Y. Zhao, L. Yang, L. Wen and L. Jiang, ACS Appl. Mater. Interfaces, 2019, 11, 23815–23821 CrossRef CAS PubMed
 .
. - X. Huang, Z. Zhang, X.-Y. Kong, Y. Sun, C. Zhu, P. Liu, J. Pang, L. Jiang and L. Wen, Nano Energy, 2019, 59, 354–362 CrossRef CAS
 .
. - W. Xin, Z. Zhang, X. Huang, Y. Hu, T. Zhou, C. Zhu, X.-Y. Kong, L. Jiang and L. Wen, Nat. Commun., 2019, 10, 3876 CrossRef PubMed
 .
. - Z. Zhang, X. Sui, P. Li, G. Xie, X.-Y. Kong, K. Xiao, L. Gao, L. Wen and L. Jiang, J. Am. Chem. Soc., 2017, 139, 8905–8914 CrossRef CAS PubMed
 .
. - J. Gao, X. Liu, Y. Jiang, L. Ding, L. Jiang and W. Guo, Small, 2019, 15, 1804279 CrossRef PubMed
 .
. - J.-P. Hsu, T.-C. Su, P.-H. Peng, S.-C. Hsu, M.-J. Zheng and L.-H. Yeh, ACS Nano, 2019, 13, 13374–13381 CrossRef CAS PubMed
 .
. - L.-H. Yeh, M. Zhang and S. Qian, Anal. Chem., 2013, 85, 7527–7534 CrossRef CAS PubMed
 .
. - L.-H. Yeh, F. Chen, Y.-T. Chiou and Y.-S. Su, Small, 2017, 13, 1702691 CrossRef PubMed
 .
. - J.-P. Hsu, S.-T. Yang, C.-Y. Lin and S. Tseng, J. Colloid Interface Sci., 2019, 537, 496–504 CrossRef CAS PubMed
 .
. - Y. Ma, L.-H. Yeh, C.-Y. Lin, L. Mei and S. Qian, Anal. Chem., 2015, 87, 4508–4514 CrossRef CAS PubMed
 .
. - T. Li, X. Zhang, S. D. Lacey, R. Mi, X. Zhao, F. Jiang, J. Song, Z. Liu, G. Chen, J. Dai, Y. Yao, S. Das, R. Yang, R. M. Briber and L. Hu, Nat. Mater., 2019, 18, 608–613 CrossRef CAS PubMed
 .
. - K. Chen, L. Yao, F. Yan, S. Liu, R. Yang and B. Su, J. Mater. Chem. A, 2019, 7, 25258–25261 RSC
 .
. - S. Tseng, Y.-M. Li, C.-Y. Lin and J.-P. Hsu, Nanoscale, 2016, 8, 2350–2357 RSC
 .
. - J.-P. Hsu, Y.-C. Chen, Y.-M. Chen and S. Tseng, J. Taiwan Inst. Chem. Eng., 2018, 93, 142–149 CrossRef CAS
 .
. - S. Marbach and L. Bocquet, Chem. Soc. Rev., 2019, 48, 3102–3144 RSC
 .
. - R. Long, Z. Kuang, Z. Liu and W. Liu, J. Membr. Sci., 2018, 561, 1–9 CrossRef CAS
 .
. - Z. Zeng, L.-H. Yeh, M. Zhang and S. Qian, Nanoscale, 2015, 7, 17020–17029 RSC
 .
. - L.-H. Yeh, Y.-H. Tai, N. Wang, J.-P. Hsu and S. Qian, Nanoscale, 2012, 4, 7575–7584 RSC
 .
. - Y. He, M. Tsutsui, R. H. Scheicher, F. Bai, M. Taniguchi and T. Kawai, ACS Nano, 2013, 7, 538–546 CrossRef CAS PubMed
 .
. - M. Zhang, C. Ngampeerapong, D. Redin, A. Ahmadian, I. Sychugov and J. Linnros, ACS Nano, 2018, 12, 4574–4582 CrossRef CAS PubMed
 .
. - X. Hou, F. Yang, L. Li, Y. Song, L. Jiang and D. Zhu, J. Am. Chem. Soc., 2010, 132, 11736–11742 CrossRef CAS PubMed
 .
. - A. Friebe and M. Ulbricht, Macromolecules, 2009, 42, 1838–1848 CrossRef CAS
 .
. - R. Long, Z. Kuang, Z. Liu and W. Liu, Natl. Sci. Rev., 2019, 6, 1266–1273 CrossRef
 .
. - D. Vigolo, S. Buzzaccaro and R. Piazza, Langmuir, 2010, 26, 7792–7801 CrossRef CAS PubMed
 .
. - J. H. Masliyah and S. Bhattacharjee, Electrokinetic and colloid transport phenomena, John Wiley &
Sons, 2006 Search PubMed
 .
. - D. Saville, Annu. Rev. Fluid. Mech., 1997, 29, 27–64 CrossRef
 .
. - S. Schmid, C. Hierold and A. Boisen, J. Appl. Phys., 2010, 107, 054510 CrossRef
 .
. - M. A. Brown, A. Goel and Z. Abbas, Angew. Chem., Int. Ed., 2016, 55, 3790–3794 CrossRef CAS PubMed
 .
. - L. Cao, F. Xiao, Y. Feng, W. Zhu, W. Geng, J. Yang, X. Zhang, N. Li, W. Guo and L. Jiang, Adv. Funct. Mater., 2017, 27, 1604302 CrossRef
 .
. - J.-Y. Lin, C.-Y. Lin, J.-P. Hsu and S. Tseng, Anal. Chem., 2015, 88, 1176–1187 CrossRef PubMed
 .
.
Footnote |
| † Electronic supplementary information (ESI) available. See DOI: 10.1039/d0ra02329a |
|
| This journal is © The Royal Society of Chemistry 2020 |
Click here to see how this site uses Cookies. View our privacy policy here.  Open Access Article
 and
Ruey-Jen Yang
 *
*


 represents the electrostatic body force produced by the interaction of the free charges in the fluid, while the fourth term
  represents the dielectric body force produced by inhomogeneities in the permittivity of the electrolyte.43–45 The viscosity of the electrolyte solution (KCl) varies in accordance with the temperature as μT = 2.414 × 10−5 × 10247.8/(T−140), where the temperature is obtained from the heat transfer equation as
![[thin space (1/6-em)]](https://www.rsc.org/images/entities/char_2009.gif) kA, pKB is defined as −log
kA, pKB is defined as −log![[thin space (1/6-em)]](https://www.rsc.org/images/entities/char_2009.gif) kB, and [H+]s is the surface proton concentration.
kB, and [H+]s is the surface proton concentration.


.
.
.
.
.
.
.
.
.
.
.
.
.
.
.
.
.
.
.
.
.
.
.
.
.
.
.
.
.
.
.
.
.
.
.
.
.
.
.
.
.
.
.
.
.
.
.
.


