 Open Access Article
Superior performance of surface-treated NaX@Pebax-1657 membranes for O2/N2 separation†
Mohammad Salehi Maleh and
Ahmadreza Raisi *
*
Department of Chemical Engineering, Amirkabir University of Technology (Tehran Polytechnic), Hafez Ave., P.O. Box 15875-4413, Tehran, Iran. E-mail: raisia@aut.ac.ir; Fax: +98 21 66405847; Tel: +98 21 64543125
First published on 30th April 2020
Abstract
In this study, the performances of mixed matrix composite membranes (MMCMs) containing surface-treated NaX nanocrystals (ST-NaX-NCs) were experimentally and theoretically investigated for O2/N2 separation. For this purpose, the MMCMs were fabricated by the casting solution method and characterized by various analyses. The results reveal that there is a robust interaction between the polymer chains and the ST-NaX-NCs, and that the ST-NaX fillers are uniformly dispersed in the polymer matrix. The incorporation of ST-NaX-NCs alters the PEBAX polymer chain packing arrangement resulting in decreased membrane transport behavior for both O2 and N2 gases. The MMCM containing 16.7% wt ST-NaX-NCs has drastically enhanced air separation properties, with a selectivity that is increased to 204% of that of the neat membrane. Moreover, the Lewis–Nielsen model was modified by considering non-ideal effects in mixed matrix membranes, like the clogging of filler pores and polymer chain hardening around the nanocrystals, to predict the gas permeation behavior through the MMCMs. The comparison of the experimental and model results reveals that the modified model can accurately predict the gas permeability and selectivity through the MMCMs.
Introduction
Oxygen is one of the most significant gases used in the chemical and petrochemical industries owing to its extreme reactivity and strong oxidizing potency. Besides, oxygen is employed in other applications, including medicine, metal manufacture, the paper industries, sewage treatment, and glass production. Most applications utilize oxygen-enriched air since oxygen constitutes only ∼21% of untreated air.1–3 For instance, the use of oxygen-enriched air instead of air offers noticeable gains in fuel combustion processes. It reduces fuel consumption, increases production efficiency, and, most importantly, reduces environmentally damaging effects, including emissions of smog, NOx, CO, and hydrocarbons.4,5 In this regard, the air separation process plays a substantial role in carbon capture and storage (CCS) through the oxy-fuel combustion process. This protocol can produce pure carbon dioxide flows as the lone by-product during oxy-fuel combustion which can be used for storage and sale without further separation.6,7 Conventionally, the main routes for the generation of high purity oxygen from atmospheric air are cryogenic distillation and pressure-swing adsorption (PSA). However, sustainable separation procedures, involving membrane-based gas separation technology have been considerably expanded due to their low energy consumption, high process safety, environmental compatibility, low requirement for capital investment, and simplicity of scale-up.8–10To date, two categories of materials, namely inorganic and polymeric, have been extensively used to prepare membranes for gas separation applications. The inorganic membranes have desirable properties such as mechanical, chemical and thermal stability and high permeability and selectivity compared to the polymeric membranes. However, their low flexibility and processing capability as well as their high fabrication costs have restricted their implementation on a large-scale. On the contrary, the polymeric membranes offer higher profits due to their lower fabrication costs and better processability.8–12 However, most polymeric membranes, especially those with dense structures, suffer from a recurrent trade-off between permeability and selectivity as described by the Robeson upper bound relationship. Given this drawback, thin-film nanocomposites (TFNCs) or mixed matrix composite membranes (MMCMs) have been investigated for their potential to merge the superior gas separation characteristics of inorganic materials with the high process capability of the polymeric materials, and surpass the upper bound restriction without incurring a substantial economic penalty.9–12 Currently, such technical tricks can be the most appropriate methods for fabricating high-performance membranes; the micro and nanoparticles are distributed homogeneously inside the polymeric layer. Many polymers such as poly(ether-block-amide) (PEBAX), polyimide (PI), polyurethane (PU), sulfonated poly(ether ether ketone) (SPEEK), polyethylene oxide (PEO), and cellulose acetate (CA) as well as a wide range of inorganic/organic/hybrid materials such as zeolite, ZIF, CNTs, COF, MIL, GO, CNC, and MoS2 have been used in the manufacture of MMCMs and TFNCs to regulate the overall solubility and diffusivity of the desired gas molecules.10,12–14
Nevertheless, one of the most prominent problems of MMCMs is the poor relationship between the polymer and the filler. The introduction of post-synthesis functionalization is one of the most appropriate techniques for minimizing this issue.12,14–16
The separation of oxygen from nitrogen is an uphill struggle due to the close physical and chemical properties of these gases. Many fillers do not have the appropriate molecular screening capability to achieve high O2/N2 selectivity. However, the presence of carbonyl groups on the nanoparticles (e.g., carboxylic groups) can significantly increase the O2/N2 selectivity. On the other hand, this functional group provides a good relationship with the polymer matrix and minimizes the formation of non-ideal surface morphologies, which has a negative impact on the overall air separation performance.16–18
In addition to the experimental studies, remarkable attempts have been made to predict the separation behavior of MMCMs, which has led to the development of the Maxwell, Lewis–Nielsen, Bruggeman, and Pal models.19–22 In many cases, these models are not capable of providing exact predictions for the gas permeation via nanoparticle-filled membranes. The low-precision predictions of the models mentioned above are due to issues including the existence of voids at the filler/polymer interface, the complicated distribution pattern of the fillers, the effects of the fillers on the polymer chain packing, and the interactions of the fillers with gases.10,12 Hence, the development of a mathematical model to describe transport properties through MMCMs is clearly needed. The use of such a model could minimize the number of expensive and time-consuming experiments required, and significantly reduce the cost of fabrication of MMCMs. Up to now, the performance of membranes containing functionalized nanoparticles has been investigated for CO2/N2 and CO2/CH4 separation but such membranes have rarely been used for air separation. Therefore, our aim in this work was to investigate the effect on the structure of mixed matrix membranes of the addition of zeolite functionalized nanoparticles and to assess the performance of the membranes for O2/N2 separation. We then sought to develop a model for predicting the separation behavior of the fabricated membranes. In this study, polyethersulfone (PES)/PEBAX composite membranes containing modified fillers were fabricated for O2/N2 separation. The effects of filler incorporation and operating pressure on the membrane performances were also investigated. Furthermore the Lewis–Nielsen model was modified after consideration of pore blocking and the hardening of the polymer chains around the nanoparticles.
Modelling the separation performance of MMCMs
As previously mentioned, mathematical models including the Maxwell, Bruggeman, Lewis–Nielsen, and Pal models have been widely used to predict gas permeability and the separation performance of MMCMs.21–26 Maxwell's equation applies to spherical fillers with low loading amounts, so that the volume fraction of the fillers is less than about 20%, and the streamlines are not affected by the presence of the particles.22 The Bruggeman and Pal models are implicit and require a trial-and-error approach, so they are not suitable for the development of a predictive model. Contrary to the Maxwell and Bruggeman models, the Lewis–Nielsen model includes morphological properties such as the size distribution, shape, and accumulation of the fillers.22 The Lewis–Nielsen model can be used to predict gas permeability in MMCMs containing quantities of fillers ranging from 0 to the maximum filler packing volume fraction (ϕm), where ϕm equals 0.59, 0.64 and 0.86 for loose random packing of uniform spheres, random close packing of uniform spheres, and binary packing of different-sized spherical particles, respectively.27,28The Lewis–Nielsen model is expressed as follows:27
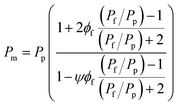 | (1) |
 | (2) |
The volume fraction of ST-NaX-NCs in the MMCMs can be calculated using the equation below:
 | (3) |
There are two limiting cases for this model: (i) If the fillers are completely impermeable (Pf = 0), eqn (1) simplifies to eqn (4); and (ii) if the permeability of the filler phase is exceedingly high (Pf → ∞), then eqn (1) simplifies to eqn (5), as follows:
 | (4) |
 | (5) |
In this work, inspired by the methods presented in the literature,26,27,29,30 we tried to apply interfacial modifications, including polymer chain rigidification around the fillers and filler pore obstruction, to the Lewis–Nielsen model. Thus, in the present modified model, a pseudo-three-phase composite is expressed:
(i) The first pseudo-phase contains the filler as a dispersed phase and the filler skin affected by the partial pore blockage as a continuous segment.
(ii) The second pseudo-phase comprises the first pseudo-phase as a dispersed segment and the rigidified polymer zone as a continuous phase.
(iii) The third pseudo-phase considers a dispersed phase composed of the polymer matrix as a continuous segment to give the overall phase of the MMCM.
The nomenclature and formulas for this modification are described below:
Pp: Permeability of the neat polymer (continuous phase); β′: permeability reduction factor; Pblo: permeability of the filler skin affected by the partial pore blockage (eqn (6))
 | (6) |
ϕblo: Volume fraction of the filler skin affected by the partial pore blockage in the whole MMCM; lblo: thickness of the pore blocking region; rf: filler diameter; ϕ1st: volume fraction of filler in the first pseudo-dispersed phase
 | (7) |
Ψ1st: Simplifying parameter; P1st: permeability of the first pseudo-dispersed phase
 | (8) |
β: Chain immobilization factor; Prig: permeability of the rigidified polymer region
 | (9) |
ϕrig: Volume fraction of the rigidified polymer region in the whole MMCM; lrig: thickness of the rigidified polymer region; ϕ2nd: volume fraction of the first pseudo-dispersed phase in the second pseudo-dispersed phase
 | (10) |
P2nd: Permeability of the second pseudo-dispersed phase
 | (11) |
PMMCM: Permeability of the second pseudo-dispersed phase
 | (12) |
The parameters lblo and lrig were estimated to be 5 nm and 32 nm, respectively, based on previous research data.29,30 The β′ and β coefficients were also calculated by MATLAB software based on previous reports,30 and were 13 and 3 for oxygen, and 10 and 8 for nitrogen, respectively.
In order to determine the deviation of the model prediction from the experimental data, the percentage of average absolute relative error (%AARE) between the reported experimental data and the model predictions is expressed as follows:
 | (13) |
Experimental
Materials
PEBAX-1657 (60% wt PEO/40% wt PA6, Arkema Inc., Paris, France) and PES (molecular weight of 58![[thin space (1/6-em)]](https://www.rsc.org/images/entities/char_2009.gif) 000 g mol−1, Ultrason E6020P, BASF, Ludwigshafen, Germany) were used as membrane materials. Organic solvents such as N,N-dimethyl-formamide (DMF) and ethanol (EtOH) were purchased from Merck Co., Ltd. (Darmstadt, Germany). Sodium hydroxide (NaOH) (Merck, Darmstadt, Germany), sodium aluminate (NaAlO2) (Sigma-Aldrich, USA), fumed silica (7 nm, Sigma-Aldrich, USA), and chloroacetic acid (ACS) (Merck, Darmstadt, Germany) were used for the synthesis of surface-treated NaX nanocrystals. All chemicals with a purity of higher than 99% were used without further purification. Deionized (DI) water was used in all experiments.
000 g mol−1, Ultrason E6020P, BASF, Ludwigshafen, Germany) were used as membrane materials. Organic solvents such as N,N-dimethyl-formamide (DMF) and ethanol (EtOH) were purchased from Merck Co., Ltd. (Darmstadt, Germany). Sodium hydroxide (NaOH) (Merck, Darmstadt, Germany), sodium aluminate (NaAlO2) (Sigma-Aldrich, USA), fumed silica (7 nm, Sigma-Aldrich, USA), and chloroacetic acid (ACS) (Merck, Darmstadt, Germany) were used for the synthesis of surface-treated NaX nanocrystals. All chemicals with a purity of higher than 99% were used without further purification. Deionized (DI) water was used in all experiments.
Synthesis of surface-treated NaX nanocrystals
The surface-treated zeolite nanocrystals (ST-NaX-NCs) were synthesized by the hydrothermal method reported in our previous work (the details are given in the ESI file†).11,31Preparation of mixed matrix composite membranes
The mixed matrix composite membranes (MMCMs) containing ST-NaX-NCs were prepared through the solution casting and solvent evaporation techniques (the synthesis methods are described in the ESI file†).11,31 The weight percentage of each component in the polymer dope solution of the selective-layer membranes and ultimate MMCMs is listed in Table 1.| Membrane | Polymer dope solutions | Ultimate MMCMs | |||
|---|---|---|---|---|---|
| Nanocrystals (%wt) | PEBAX (%wt) | Solvent (%wt) | Nanocrystals (%wt) | PEBAX (%wt) | |
| PX0 | 0.0 | 10 | 90.0 | 0.0 | 100 |
| PX1 | 0.5 | 10 | 89.5 | 4.8 | 95.2 |
| PX2 | 1.0 | 10 | 89.0 | 9.1 | 90.9 |
| PX3 | 2.0 | 10 | 88.0 | 16.7 | 83.3 |
Measurement of gas permeation
A constant volume and variable pressure system was applied to evaluate the permeability of pure oxygen and nitrogen gases through the MMCMs at 25 °C. The operational stability of the MMCMs was examined under different feed pressures of 2, 4, and 6 bar. Before each test, the gases in the membrane and the downstream gases were removed using a vacuum pump. The gas permeability was calculated using the following equation:
 | (14) |
 | (15) |
Results and discussion
Characterization of nanoparticles
The morphologies of the ST-NaX-NCs were inspected by FESEM. The functionalized NaX had characteristic identical spherical shapes with particle sizes of about 100 nm (Fig. S1a†).Fig. S1b† illustrates the XRD pattern of the synthesized ST-NaX-NCs. The reflections fitting to the (111), (220), (311), (331), (440), (533), (642), (733) and (555) crystallographic planes of the ST-NaX-NCs corresponded to the diffraction peaks at 2θ values of 6.3, 10.2, 11.9, 15.3, 20.4, 23.5, 26.9, 29.5 and 31.3°, respectively. All diffraction peaks for the particles are in good agreement with those previously reported in the literature.32,33 According to the Scherrer relation, the particle size was estimated to be 16 nm from the main peak (2θ = 6.3°).
Moreover, according to the BET analysis, the surface area and mean pore diameter of the ST-NaX-NCs were determined to be 520 m2 g−1 and 0.77 nm, respectively. According to our previous research, we expected the physical measurements of the modified nanocrystals (like the BET surface area, total pore volume and mean pore size) to be lower than those of the pure crystals.16,31 This is consistent with the incorporation of carboxyl functional groups into the vacuities in the ST-NaX-NCs micropores, which partially blocks the pores.31,35 The adsorption–desorption isotherms and the pore size distribution of the ST-NaX-NCs are presented in Fig. S2 and S3,† respectively.
The FTIR spectrum of the ST-NaX-NCs fillers is revealed in Fig. S4.† The primary characteristic peaks of the chemical structure of the ST-NaX-NCs are identified on the FTIR spectrum. As can be observed, the peak at around 1720 cm−1 corresponded to stretching of the free carboxylic acid C![[double bond, length as m-dash]](https://www.rsc.org/images/entities/char_e001.gif) O. Also, the broad peak at around 3422 cm−1 indicated the carboxylic acid O–H bond.34
O. Also, the broad peak at around 3422 cm−1 indicated the carboxylic acid O–H bond.34
Characterization of membranes
SEM analysis was performed to survey the morphologies of the membranes, the dispersion of the fillers in the polymer matrixes, and the facets of the polymer/filler interfaces. Fig. 1 shows the surface and cross-sectional images of the prepared MMCMs. Fig. 1a–d show that the structure of the neat PEBAX membrane was smooth and had no defects. As revealed in Fig. 1e and f, the ST-NaX fillers showed as visible spots dispersed within the MMCM surface. As expected, greater amounts of ST-NaX could be observed in the MMCM surface and cross-section after more filler was incorporated. The SEM images confirmed that the prepared MMCMs were flawless and had a uniform structure. Suitable interfacial interactions and dispersion of filler were perceived at the loading of 16.7% wt ST-NaX (Fig. 1e–h).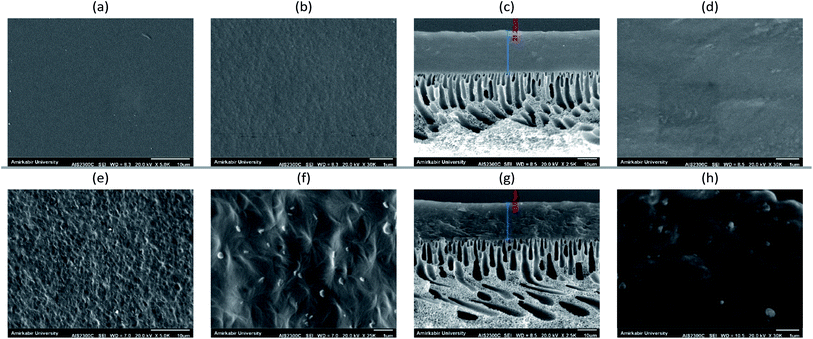 | ||
| Fig. 1 SEM micrographs of neat PEBAX (surface (a and b), cross-section (c and d)) and MMCMs comprising 16.7% wt ST-NaX-NCs (surface (e and f), cross-section (g and h)). | ||
Fig. 2 shows surface SEM images of two MMCMs, one containing 28.6% wt NaX without surface modification and the other containing NaX with surface modification. As shown in Fig. 2a in the MMCM containing 28.6% wt NaX without surface modification, the zeolite nanoparticles were highly agglomerated and due to the weak interaction of the filler with the polymer, surface voids were formed, as indicated by red circles in the surface SEM images. In contrast, as can be realized from Fig. S4† and 3, the existence of suitable interactions between the carboxyl groups of the ST-NaX-NCs and the PEBAX chains intensified stress at the PEBAX/filler interfaces. There were no palpable “surface voids” around the fillers, and thus the ST-NaX-NCs were well surrounded by the PEBAX chains (Fig. 1 and 2b).
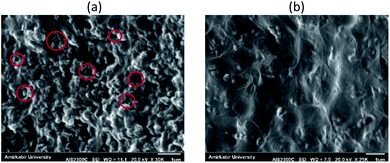 | ||
| Fig. 2 Surface SEM images of the MMCMs comprising 28.6% wt NaX without surface modification (a) and NaX with surface modification (b). | ||
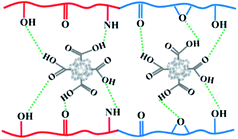 | ||
Fig. 3 Schematic showing the hydrogen bond interactions of –COOH groups on the ST-NaX-NCs with C![[double bond, length as m-dash]](https://www.rsc.org/images/entities/char_e001.gif) O, –OH, –NH, and –O– groups in the PEBAX matrix. O, –OH, –NH, and –O– groups in the PEBAX matrix. | ||
The degrees of crystallinity of the hard, soft and total phases of MMCMs are given in Table 2. Subsequently, by incorporating ST-NaX-NCs, both PA and PEO segments exhibited enriched crystallinity. This signifies an increase in the rigidity of the PEBAX matrix after the incorporation of fillers owing to the formation of hydrogen bonding between the PEBAX chains and ST-NaX.
| Sample name | Crystallinity (%) | ||
|---|---|---|---|
| PEO | PA | Total phases | |
| PX0 | 14.45 | 25.08 | 18.7 |
| PX1 | 17.14 | 25.45 | 20.46 |
| PX2 | 19.37 | 27.32 | 22.55 |
| PX3 | 22.44 | 30.14 | 25.52 |
To scrutinize the chemical properties of the MMCMs, FTIR spectroscopy was conducted. As can be seen in Fig. S4 and S5,† there were characteristic peaks for the soft and glassy sections of the MMCMs. As shown in the FTIR spectra of the MMCMs, the intensity of the characteristic peaks at wavenumbers of 800–1200, 1500–1800 and 2800–3500 cm−1 changed with increasing NaX-NC loading, and simultaneously the wavenumbers of these peaks shifted to lower frequency. The peak at 800–1200 cm−1 was related to the interactions between the NaX-NCs and the C–O–C groups of the soft PEO segment, and the peaks at 1500–1800 and 2800–3500 cm−1 could be attributed to the interactions of the NaX-NCs with the N–H, H–N–C![[double bond, length as m-dash]](https://www.rsc.org/images/entities/char_e001.gif) O and O–C
O and O–C![[double bond, length as m-dash]](https://www.rsc.org/images/entities/char_e001.gif) O groups of the hard PA6 segment. Fig. 3 schematically shows the interactions between the ST-NaX-NCs and PEBAX chains. The incorporation of the nano-fillers within the polymer changed the characteristic peaks of the C–O–C, N–H, H–N–C
O groups of the hard PA6 segment. Fig. 3 schematically shows the interactions between the ST-NaX-NCs and PEBAX chains. The incorporation of the nano-fillers within the polymer changed the characteristic peaks of the C–O–C, N–H, H–N–C![[double bond, length as m-dash]](https://www.rsc.org/images/entities/char_e001.gif) O, O–C
O, O–C![[double bond, length as m-dash]](https://www.rsc.org/images/entities/char_e001.gif) O, and –O–H groups, and these changes showed the strength of interactions between the filler particles and the polymer. Previous research has confirmed that NaX-NCs can form hydrogen bonds with the carbonyl and amine groups of the PA segment and the ether groups of the PEO section.11,31,36
O, and –O–H groups, and these changes showed the strength of interactions between the filler particles and the polymer. Previous research has confirmed that NaX-NCs can form hydrogen bonds with the carbonyl and amine groups of the PA segment and the ether groups of the PEO section.11,31,36
Gas permeation through MMCMs
The gas permeation properties of the prepared MMCMs, measured at the operating temperature of 25 °C and the feed pressure of 4 bar are indicated in Fig. 4. The gas transportation through the dense polymeric MMCMs followed the solution-diffusion transport mechanism. According to the solution-diffusion model, the gas permeation in dense polymeric membranes is determined by the solubility and diffusivity of the gases in the MMCMs.37 The gas solubility can be affected by the gas critical temperature (condensability), and the interplay of the gases with the polymer and the nanocrystals. Moreover, the penetrant size, partial FFV, interfacial voids, polymer chain flexibility, pore diameter, and pore obstruction by the nanocrystals have significant effects on the diffusivity of the gases.31 In order to evaluate the influence of ST-NaX-NC loading on the selectivity of the prepared MMCMs, the selectivity enhancement factor (λ), which represents the change in the selectivity of the membrane due to the incorporation of the nano-fillers is defined as follows:
 | (16) |
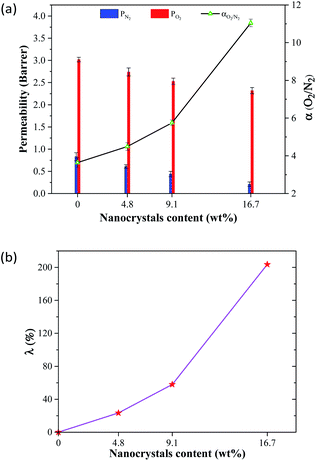 | ||
| Fig. 4 The effect of incorporation of ST-NaX-NCs into the membrane on the gas separation performance (a), and the selectivity enhancement factor (b), at 4 bar and 25 °C. | ||
As exhibited in Fig. 4b, the incorporation of ST-NaX-NCs into the MMCMs drastically improved the O2/N2 selectivity. The best performance was observed for the PX3 (16.7% wt NCs/PEBAX) membrane, for which the O2/N2 selectivity was amplified by a selectivity enhancement factor of 204 relative to that of the performance of the PX0 (0% wt NCs/PEBAX) membrane. The excellent improvement in the selectivity was predominantly due to the superiority of oxygen permeability over that of nitrogen. Oxygen has a higher critical temperature (154.6 K), and lower kinetic diameter (3.46 Å) than nitrogen (126.2 K and 3.64 Å), and therefore it was better absorbed into the polymer and had higher diffusivity. Oxygen and nitrogen are non-polar gases, which have low solubility.38 The incorporation of the modified nanoparticles had significant effects on the structure of the thin-film membrane. Specifically, strong interactions between the carboxyl functional groups and the polymer chains hardened the layers around the nanoparticles, resulting in the partial clogging of the voids.15,16,31 Moreover, as can be deduced from the results of the DSC analysis, increasing the content of filler augmented the crystallinity of the membrane. These are the major reasons for the reduction in gas permeability, and the enhancement in gas selectivity.
Fig. 5 demonstrates the influence of the operational pressure on the gas permeability and O2/N2 selectivity of the PX3 membrane. It was found that the permeabilities of oxygen and nitrogen gases were almost constant with varying operating pressures from 2 to 6 bar. Furthermore, the O2/N2 selectivity remained roughly constant, as exhibited in Fig. 5. The data obtained on O2/N2 separation showed that these non-polar penetrants were less affected by pressure enhancement.39
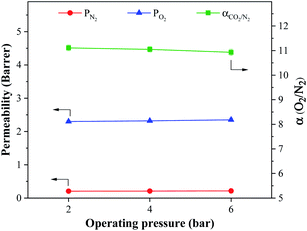 | ||
| Fig. 5 The effect of operating pressure on the gas permeability and O2/N2 selectivity of the MMCM comprising 16.7% wt ST-NaX-NCs at 25 °C. | ||
The performances of the prepared membranes were assessed against Robeson's upper bound.40 As shown in Fig. 6a, the performances of the MMCMs improved as the concentration of ST-NaX-NCs increased, and the membrane comprising 16.7% wt NCs was able to pass the Robeson's upper limit. Moreover, a comparison with literature data (Fig. 6b) revealed that our membranes possessed superior performance compared to membranes reported so far. For comparison purposes, the separation performances of the MMCMs containing 4.8, 9.1 and 16.7% wt unmodified zeolite for the separation of O2/N2 are provided in Fig. 6a. As shown in this figure, the separation performances of the MMCMs containing unmodified zeolite were significantly lower than those of the MMCMs containing surface-modified zeolite.
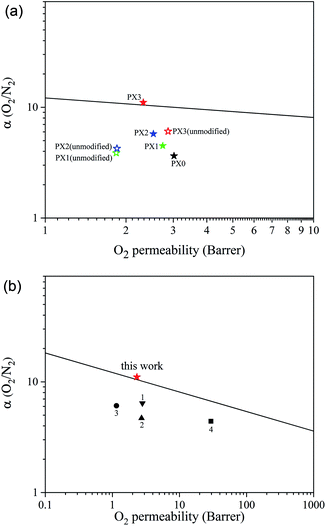 | ||
| Fig. 6 A comparison of the performance of the MMCMs (solid stars: zeolite with surface modification; hollow stars: zeolite without surface modification) (a), and PX3 with membranes from other studies (b), for the separation of O2/N2 mixtures given Robeson's upper bound ((1) CNT-NH2,41 (2) CNT-COOH,41 (3) amino grafted nano-silica42 and (4) amorphous amino-modified silica43). | ||
Validation of modelling results
The experimental gas permeation results were compared with the results predicted by the Lewis–Nielsen and modified Lewis–Nielsen models. In Fig. 7, the results of the Lewis–Nielsen model are compared with the experimental data. By calculating the AARE percentages (eqn (13)), one can detect the discrepancy between the model and the experimental results. The AAREs for oxygen and nitrogen permeabilities and O2/N2 selectivity were 6.94, 78, and 29%, respectively. It can be seen that the deviation of the predicted results from the experimental data increased as the ST-NaX-NC content of the MMCMs was enhanced. This is due to the effect of the nanoparticles on the polymer chain packing, and the non-ideal nano-filler/polymer interactions, as confirmed by SEM, FTIR, and DSC analyses. Therefore, increasing the nanoparticle content increased the non-ideality behavior of the membranes and gradually enhanced the difference between the predicted values and experimental results. This lack of agreement indicates that the prepared membranes were not entirely ideal.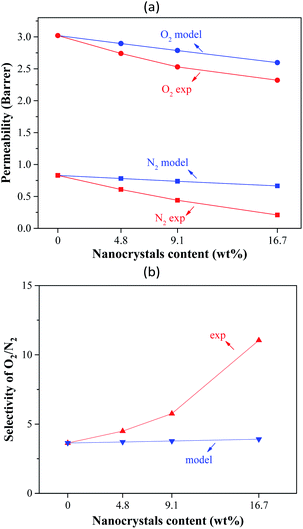 | ||
| Fig. 7 Comparison of the experimental O2 and N2 permeabilities and selectivities of the MMCMs compared to the results of the Lewis–Nielsen model. | ||
Fig. 8 compares the experimental oxygen and nitrogen permeabilities of the MMCMs with the limiting cases of the Lewis–Nielsen model. The results show that the permeability for oxygen and nitrogen gases were near the lower bound. There were two main reasons for these observations: (i) the partial pore clogging by the ST-NaX nanoparticles present in the polymer matrix, so that the penetration of N2 gas became much harder, and (ii) the presence of carboxyl functional groups that could affect polymer chain packing and cross-linking. Therefore, the modelling data was not entirely consistent with actual data, so some modifications to the Lewis–Nielsen model were needed.
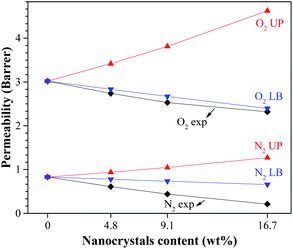 | ||
| Fig. 8 Comparison of the experimental permeability results with the limiting cases of the Lewis–Nielsen model (UP: upper bound and LB: lower bound). | ||
Fig. 9 reveals the comparison between the results of the modified Lewis–Nielsen model and the experimental data. It can be seen that the predicted values for the gas permeability and selectivity by the modified Lewis–Nielsen model were in good agreement with the experimental data; the AARE values for the oxygen and nitrogen permeabilities as well as the selectivity were 1.3, 2.2 and 1.1%, respectively. This shows that the modified model improved the gas permeability prediction and significantly reduced the AARE values. By applying the permeability reduction factor (β′) and the chain immobilization factor (β), the initial model was refined and was able to predict the effects of the clogging of the filler pores as well as the polymer chain hardening around the nanoparticles, resulting in a significant improvement in the model accuracy. Similar observations have previously been reported for the modification of other theoretical models. For example, Pakizeh et al.44 used a modified Maxwell model to predict the performance of zeolite 4A/PVAc MMM for the separation of oxygen from nitrogen. They were able to significantly improve the prediction of the gas separation performance for the mentioned membrane by applying a partial clogging factor and a polymer chain hardening factor within the Maxwell model.
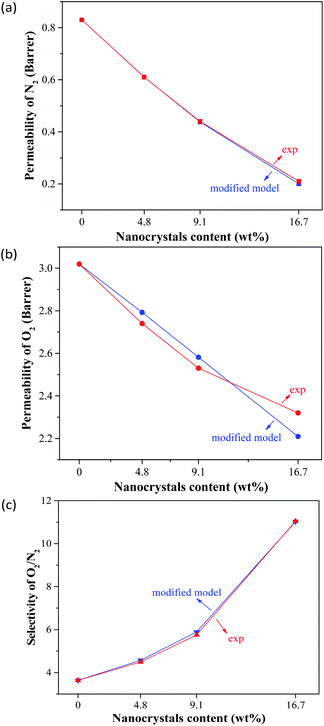 | ||
| Fig. 9 Comparison of the experimental N2 (a) and O2 (b) permeabilities and O2/N2 selectivities (c) of the MMCMs with the results of the modified Lewis–Nielsen model. | ||
Conclusions
MMCMs were upgraded for air separation applications by incorporating surface-treated NaX nanocrystals into PEBAX polymer. The influences of the filler content and operating pressure on the gas separation performance of the membranes were scrutinized. The ST-NaX-NCs were successfully synthesized and characterized by FESEM, XRD, FTIR, and BET analyses. It was observed that the ST-NaX-NCs were strongly compatible with the polymer due to the presence of carboxylic groups and this resulted in the abolition of the voids at the filler/polymer interface. The MMCM comprising 16.7% wt ST-NaX-NCs showed ∼200% greater O2/N2 selectivity compared to that of the neat PEBAX membrane. The modification of NaX-NCs did, however, affect membrane permeability negatively due to polymer chain hardening and partial pore blocking. An investigation into the effect of feed pressure showed that permeability and selectivity were not greatly affected by an increase in pressure. The MMCM containing 16.7% wt nanocrystals was able to pass Robeson's upper bound limit successfully. This fact suggests that this MMCM could be an acceptable membrane for air separation applications. Furthermore, gas permeation through the prepared MMCMs was modelled using a theoretical Lewis–Nielsen model by considering non-ideal effects, including polymer chain rigidification and partial pore blockages. It was found that the modified Lewis–Nielsen model could predict the experimental results well. The AARE values for oxygen and nitrogen permeability as well as O2/N2 selectivity were 1.27, 2.18, and 1.12%, respectively.Conflicts of interest
There are no conflicts to declare.References
- P. Baskar and A. Senthilkumar, Int. J. Eng. Sci. Technol., 2016, 19, 438–443 Search PubMed.
- E. F. da Silva and A. M. Booth, Environ. Sci. Technol., 2013, 47, 659–660 CrossRef PubMed.
- K. Chong, S. Lai, H. Thiam, H. Teoh and S. Heng, J. Eng. Sci. Technol, 2016, 11, 1016–1030 Search PubMed.
- M. A. Rodrigues, J. de Souza Ribeiro, E. de Souza Costa, J. L. de Miranda and H. C. Ferraz, Sep. Purif. Technol., 2018, 192, 491–500 CrossRef CAS.
- A. Beltrame, P. Porshnev, W. Merchan-Merchan, A. Saveliev, A. Fridman, L. Kennedy, O. Petrova, S. Zhdanok, F. Amouri and O. Charon, Combust. Flame, 2001, 124, 295–310 CrossRef CAS.
- D. Barker, S. Turner, P. Napier-Moore, M. Clark and J. Davison, Energy Procedia, 2009, 1, 87–94 CrossRef CAS.
- D. M. D'Alessandro, B. Smit and J. R. Long, Angew. Chem., Int. Ed., 2010, 49, 6058–6082 CrossRef PubMed.
- W. Zhu, X. Li, Y. Sun, R. Guo and S. Ding, RSC Adv., 2019, 9, 23390–23399 RSC.
- D. Huang, Q. Xin, Y. Ni, Y. Shuai, S. Wang, Y. Li, H. Ye, L. Lin, X. Ding and Y. Zhang, RSC Adv., 2018, 8, 6099–6109 RSC.
- X. Y. Chen, H. Vinh-Thang, A. A. Ramirez, D. Rodrigue and S. Kaliaguine, RSC Adv., 2015, 5, 24399–24448 RSC.
- M. S. Maleh and A. Raisi, Chem. Eng. Res. Des., 2019, 147, 545–560 CrossRef.
- A. E. Amooghin, S. Mashhadikhan, H. Sanaeepur, A. Moghadassi, T. Matsuura and S. Ramakrishna, Prog. Mater. Sci., 2018, 102, 222–295 CrossRef.
- S. Wang, X. Li, H. Wu, Z. Tian, Q. Xin, G. He, D. Peng, S. Chen, Y. Yin, Z. Jiang and M. D. Guiver, Energy Environ. Sci., 2016, 9, 1863–1890 RSC.
- R. Lee, Z. Jawad, A. Ahmad and H. Chua, Process Saf. Environ. Prot., 2018, 117, 159–167 CrossRef CAS.
- H. Sanaeepur, A. Kargari and B. Nasernejad, RSC Adv., 2014, 4, 63966–63976 RSC.
- R. Abedini, M. Omidkhah and F. Dorosti, RSC Adv., 2014, 4, 36522–36537 RSC.
- M. Z. Rong, M. Q. Zhang and W. H. Ruan, Mater. Sci. Technol., 2013, 22, 787–796 CrossRef.
- T.-S. Chung, L. Y. Jiang, Y. Li and S. Kulprathipanja, Prog. Polym. Sci., 2007, 32, 483–507 CrossRef CAS.
- S. Maghami, A. Mehrabani-Zeinabad, M. Sadeghi, J. Sánchez-Laínez, B. Zornoza, C. Téllez and J. Coronas, Chem. Eng. Sci., 2019, 205, 58–73 CrossRef CAS.
- A. Ghadimi, T. Mohammadi and N. Kasiri, Sep. Purif. Technol., 2016, 170, 280–293 CrossRef CAS.
- A. Shariati, M. Omidkhah and M. Z. Pedram, Chem. Eng. Res. Des., 2012, 90, 563–575 CrossRef CAS.
- R. Nasir, H. Mukhtar and Z. Man, RSC Adv., 2016, 6, 30130–30138 RSC.
- L. Hu, J. Liu, L. Zhu, X. Hou, L. Huang, H. Lin and J. Cheng, Sep. Purif. Technol., 2018, 205, 58–65 CrossRef CAS.
- Q. Qian, A. X. Wu, W. S. Chi, P. A. Asinger, S. Lin, A. Hypsher and Z. P. Smith, ACS Appl. Mater. Interfaces, 2019, 11, 31257–31269 CrossRef CAS PubMed.
- R. S. Bhavsar, T. Mitra, D. J. Adams, A. I. Cooper and P. M. Budd, J. Membr. Sci., 2018, 564, 878–886 CrossRef CAS.
- C. I. Chaidou, G. Pantoleontos, D. E. Koutsonikolas, S. P. Kaldis and G. P. Sakellaropoulos, Sep. Sci. Technol., 2012, 47, 950–962 CrossRef CAS.
- H. Vinh-Thang and S. Kaliaguine, Chem. Rev., 2013, 113, 4980–5028 CrossRef CAS PubMed.
- S. Maghami, M. Sadeghi, A. Mehrabani-Zeinabad, M. Zarabadi and B. Ghalei, Ind. Eng. Chem. Res., 2019, 58, 11022–11037 CrossRef CAS.
- T. T. Moore, R. Mahajan, D. Q. Vu and W. J. Koros, AIChE J., 2004, 50, 311–321 CrossRef CAS.
- Y. Li, T. Chung, C. Cao and S. Kulprathipanja, J. Membr. Sci., 2005, 260, 45–55 CrossRef CAS.
- M. S. Maleh and A. Raisi, RSC Adv., 2019, 9, 15542–15553 RSC.
- B.-Z. Zhan, M. A. White, M. Lumsden, J. Mueller-Neuhaus, K. N. Robertson, T. S. Cameron and M. Gharghouri, Chem. Mater., 2002, 14, 3636–3642 CrossRef CAS.
- Y. Yurekli, J. Hazard. Mater., 2019, 378, 120743 CrossRef CAS PubMed.
- J. Coates, Encyclopedia of analytical chemistry: applications, theory and instrumentation, 2006 Search PubMed.
- X. Wang, H. Li and X.-J. Hou, J. Phys. Chem. C, 2012, 116, 19814–19821 CrossRef CAS.
- K. Zarshenas, A. Raisi and A. Aroujalian, J. Membr. Sci., 2016, 510, 270–283 CrossRef CAS.
- K. Xie, Q. Fu, G. G. Qiao and P. A. Webley, J. Membr. Sci., 2019, 572, 38–60 CrossRef CAS.
- H. Lin and B. D. Freeman, J. Membr. Sci., 2004, 239, 105–117 CrossRef CAS.
- H. Ha, J. Park, S. Ando, C. B. Kim, K. Nagai, B. D. Freeman and C. Ellison, J. Membr. Sci., 2016, 518, 131–140 CrossRef CAS.
- L. M. Robeson, J. Membr. Sci., 2008, 320, 390–400 CrossRef CAS.
- S. A. Habibiannejad, A. Aroujalian and A. Raisi, RSC Adv., 2016, 6, 79563–79577 RSC.
- E. Nezhadmoghadam, M. P. Chenar, M. Omidkhah, A. Nezhadmoghadam and R. Abedini, Korean J. Chem. Eng., 2018, 35, 526–534 CrossRef CAS.
- C.-C. Hu, P.-H. Cheng, S.-C. Chou, C.-L. Lai, S.-H. Huang, H.-A. Tsai, W.-S. Hung and K.-R. Lee, J. Membr. Sci., 2019, 595, 117542 CrossRef.
- M. Pakizeh, S. Ofoghi and S. H. R. Shooshtari, Korean J. Chem. Eng., 2016, 33, 3194–3202 CrossRef CAS.
Footnote |
| † Electronic supplementary information (ESI) available. See DOI: 10.1039/d0ra02255a |
| This journal is © The Royal Society of Chemistry 2020 |
