DOI:
10.1039/D0RA02150D
(Paper)
RSC Adv., 2020,
10, 17270-17279
In vivo and in vitro evaluation of dihydroartemisinin prodrug nanocomplexes as a nano-drug delivery system: characterization, pharmacokinetics and pharmacodynamics†
Received
7th March 2020
, Accepted 27th March 2020
First published on 4th May 2020
Abstract
To develop new, more effective and lower toxicity antitumor dihydroartemisinin (DHA) nanocomplexes, a DHA prodrug synthesized in this study was used to prepare DHA prodrug self-assembled nanocomplexes (DHANPs) by molecular self-assembly technology. The optimization, pharmacokinetics and in vitro and in vivo antitumor efficiency of DHANPs were assessed. The results showed that the entrapment efficiency, drug loading, particle size and zeta potential of the optimized formulation were 92.37 ± 3.68%, 76.98 ± 3.07%, 145.9 ± 2.11 nm and −16.0 ± 0.52 mV, respectively. DHANPs had a uniform size distribution and good stability during storage. The release of DHA prodrugs from DHANPs was slow in a PBS solution (pH 7.4). The pharmacokinetic study indicated that DHANPs could significantly improve the blood concentration of DHA. DHANPs exhibited lower cytotoxicity to 4T1 cells. More importantly, DHANPs could increase the quality life of mice in comparison with that of the DHA solution in 4T1 tumor-bearing mice. In short, the optimized DHA prodrug nanocomplexes show good long-term stability during the experimental time, extend the life-cycle of DHA in rats and can act as a prospective nano-drug delivery system for future artemisinin-based anti-tumor drugs.
Introduction
Dihydroartemisinin (DHA), an important derivative and active metabolite of artemisinin (ART), possesses a 1,2,4-trioxane ring system with an endoperoxide bridge, which is essential to its potency as an anti-malarial drug.1,2 Recent studies have reported that DHA also possesses a potential and broad antitumor effect in many different kinds of tumor cell lines through inducing apoptosis, preventing cell proliferation, and decreasing tumor angiogenesis.3–6
The antitumor effect of DHA is mostly related to the free radicals produced by the cleavage of the endoperoxide bridge in the drug, and it is important for the treatment of cancer.7,8 The anti-tumor efficacy of DHA on glioblastoma is enhanced under the presence of total transferrin.9 DHA has shown a time- and dose-dependent inhibition of ovarian cancer cell proliferation in vitro and prohibited the synthesis of DNA through a dose-dependent manner in MHCC97-L cells.6,10 In addition, DHA is widely used as a potential antitumor drug for the treatment of breast cancer.11–13 However, as a small chemotherapeutic drug, DHA also has some disadvantages, such as poor solubility, short half-life and quick metabolism, and most of it is degraded before being delivered to tumor sites.14–17 Thus, there is a strong desire to develop a new strategy for DHA with a good therapeutic index. To improve the treatment efficiency of DHA, a lot of DHA prodrugs and nano-drug delivery systems were employed to increase its anticancer-therapy activities.18–21 More importantly, prodrug-loaded self-assembled nanoparticles exhibited obvious advantages such as easy preparation, high drug-loading efficiency, long-term stability, and low toxicity to normal cells.19,22–24 Therefore, these nanocomplexes integrating the drug and carrier were used as a prospective strategy to produce lower toxicity to normal tissues and more effective antitumor activities.
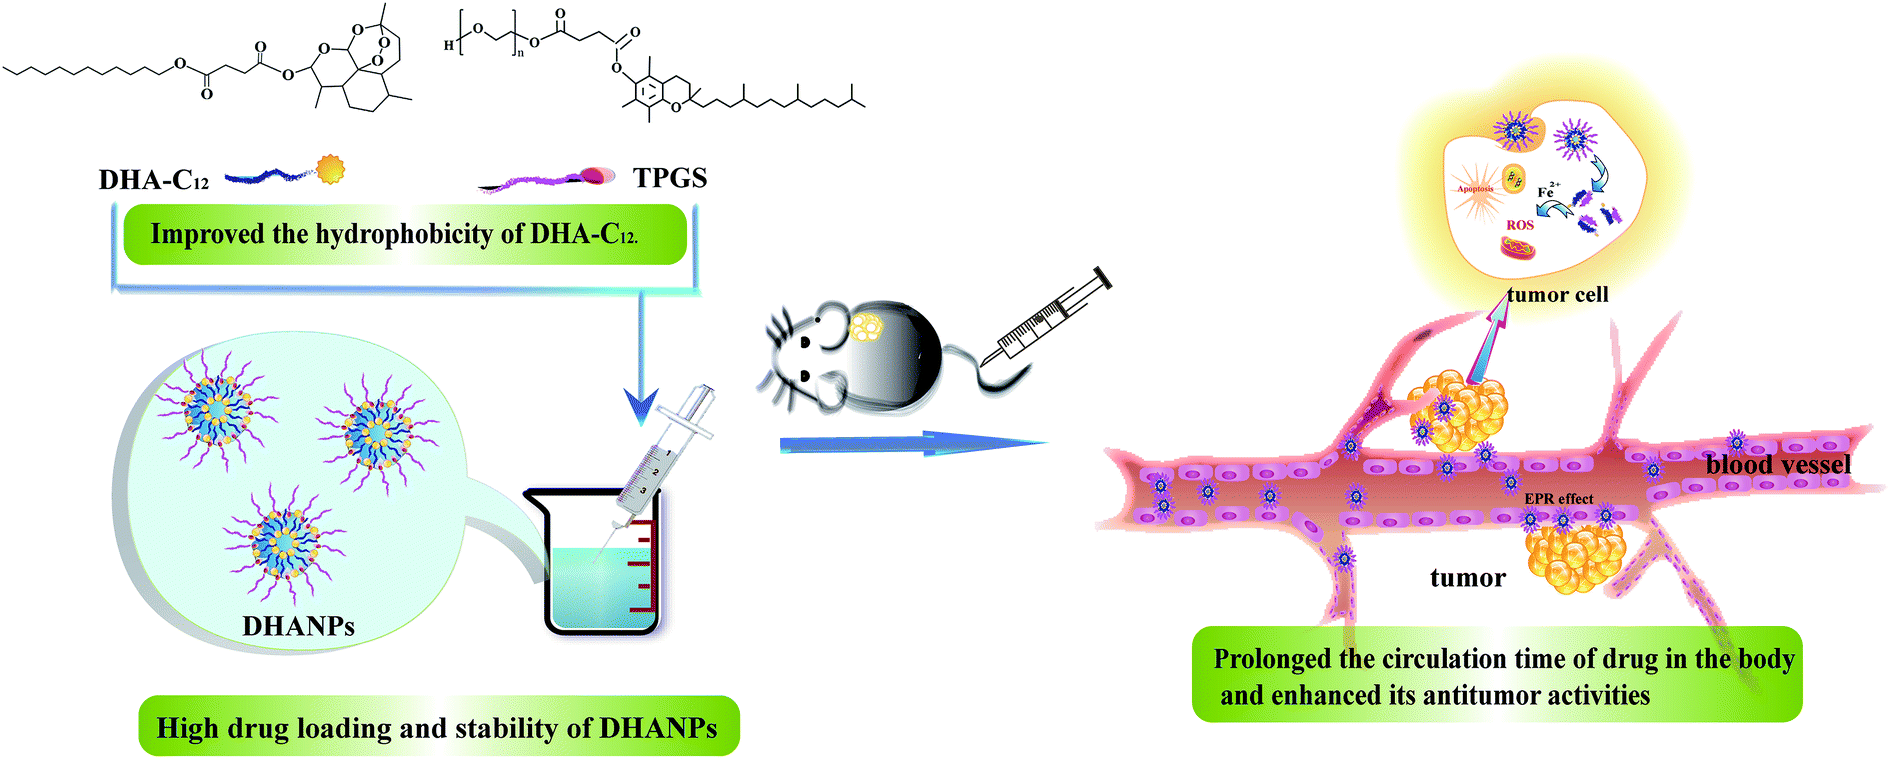
In our previous paper, a prodrug of DHA to lauryl alcohol (C12) with a disulfide bond as the linker (DHA–S–S–C12) was synthesized and prepared to form self-assembled nanoparticles (DSCNs).25 The pharmacokinetic study showed that DSCNs significantly extended the plasma circulation time of DHA in rats. In order to compare the influence of different linkers between DHA and C12 on the pharmacokinetic study, a highly hydrophobic prodrug with a disulfide bond as the linker between DHA and C12 (DHA–C12) was designed and synthesized in this paper. Then, it was fabricated into the DHA prodrug self-assembled nanoparticles (DHANPs) using molecular self-assembly technology. The in vitro release behavior was investigated by the method of high-performance liquid phase post-column derivatization. Moreover, the stability of the preparation was examined for two months and it was optimized with respect to the particle size, PDI and zeta potential. The pharmacokinetics and correlative pharmacodynamics experimental study was also performed to evaluate the circulation time and antitumor activities of DHANPs (Fig. 1). Taken together, these spontaneous self-assembled and integrated nanocomplexes provide a new and potent anticancer strategy to prolong the circulation time of the drug in the body and enhance its antitumor activities.
 |
| | Fig. 1 Schematic illustration of the DHA prodrug nanocomplexes and the distribution of DHANPs in tumor. | |
Materials and methods
Materials
Artesunate (ARS) was purchased from Chongqing Holley Wuling Mountain Pharmaceutical Co., LTD. 1,2-Distearoyl-sn-glycero-3-phosphoethanolamine-N-[methoxy (polyethylene glycol)-2000] (DSPE-PEG2000) was purchased from Shanghai Advanced Vehicle Technology Pharmaceutical Ltd (Shanghai, China). D-α-Tocopheryl polyethylene glycol succinate (TPGS), C12, 1-ethyl-(3-dimethylaminopropyl) carbonyl diamide hydrochloride (EDCI), and 4-dimethylaminopyridine (DMAP) were purchased from Aladdin Industrial Corporation (Shanghai, China). Methanol and acetonitrile (chromatography pure) were purchased from Tianjin Kemeng Chemical Industry & Trade Co., LTD. The dialysis bag (intercept molecular weight: 12–14 kDa) was bought from Shanghai Green Bird Technology Development Co., LTD. Acetonitrile (chromatography pure) was purchased from Fisher Scientific (USA). Formic acid and ammonium acetate were purchased from Dikma Technologies, Inc. All other ingredients were analytically pure.
Cell line
The 4T1 cell line was a murine mammary carcinoma cell line, which was kindly provided by the Department of Pathology in the Institute of Medicinal Biotechnology at Peking Union Medical College.
Animals
12 Sprague-Dawley (SD) rats (200–250 g) and 18 female BABL/c mice (18–20 g) were used for the pharmacokinetic study and in vivo antitumor study, respectively, which were provided by the laboratory animal center of Shanxi Medical University. All animal experiments were performed in accordance with the Guidelines for the Care and Use of Laboratory Animals of Shanxi Medical University, and approved by the Animal Ethics Committee of Shanxi Medical University.
Synthesis and appraisal of DHA prodrug
C12 was added to a solution of EDCI, DMAP, and ARS in anhydrous dichloromethane. The mixture was stirred for another 24 h and the endpoint of the reaction was monitored by thin-layer chromatography (TLC). Subsequently, the pure DHA product (DHA–C12) was obtained by liquid–liquid extraction. DHA–C12 was identified by mass spectrometry (MS) and high-resolution mass spectra (HRMS). Furthermore, the chemical structure of DHA–C12 was optimized by molecular dynamics simulation software.
Preparation of the DHA prodrug self-assembled nanoparticles
Molecular self-assembly technology was used to prepare the DHA prodrug self-assembled nanoparticles (DHANPs).24 Briefly, 400 μL of DHA–C12 ethanol solution (10 mg mL−1) and TPGS (2 mg mL−1) were slowly poured into distilled water. Subsequently, DHANPs were obtained and then stored at 4 °C.
Optimization of the DHA prodrug self-assembled nanoparticles
The effects of several parameters on the preparation of DHANPs were investigated to obtain optimized self-assembled nanoparticles. The influence of five single factors, i.e., the preparation concentration of DHA–C12, rotation speed, stabilizer, injection rate and preparation temperature on the preparation of DHANPs was investigated. These factors were the preparation concentration of DHA–C12 of 1, 5 and 10 mg mL−1, rotation speeds of 600, 800 and 1000 rpm, slow and quick injection rates, and preparation temperatures of 25 °C and 37 °C. The different stabilizers such as polyethylene glycol monostearate (PEG, n = 25, 40, 55), TPGS and DSPE-PEG2000 were selected to prepare DHANPs at the ratios of 5%, 10% and 20% (TPGS/DHA–C12, w/w). The particle size, PDI and zeta potential were determined at the defined points (0, 2, 7, 9, 14, 21, 28 d), which were used as evaluation indexes to select the best preparation process and stabilizer.
Characterization of the DHA prodrug self-assembled nanoparticles
Particle size, PDI and zeta potential of the DHA prodrug self-assembled nanoparticles. The particle size, PDI and zeta potential were determined at the equilibrated time of 60 s and the temperature of 25 °C by the Malvern Zetasizer Nano-ZS90 particle potential analyzer. The data were represented as the mean ± SD (n = 3).
Study of the morphology of the DHA prodrug self-assemblednanoparticles. The prepared solution of DHANPs was placed on the copper network with the carbon support membrane. After drying, a negative transfection was carried out with 2% (w/v) phosphotungstic acid. Then, the dried samples were evaluated by the JEM-1200EX (120 kV) transmission electron microscope (TEM).
Determination of the entrapment efficiency (EE) and drug-loading (DL) of the DHA prodrug self-assembled nanoparticles
High-speed centrifugation was used to determine the EE and DL of DHANPs. DHANPs were centrifuged at the speed of 11![[thin space (1/6-em)]](https://www.rsc.org/images/entities/char_2009.gif) 525 × g for 20 min. After centrifugation, 1.6 mL of the upper fluid and the pre-centrifugation solution were respectively taken into a 10 mL volumetric flask, followed by the addition of methanol. The content of DHA–C12 was determined by the method of high-performance liquid chromatography (HPLC)-post-column derivatization on a reverse ODS Agilent-C18 column (250 mm × 4.6 mm, 5 μm) with a methanol/acetonitrile/buffer solution (20:50:30, v/v/v) as the eluting solution. The samples were detected using an ultraviolet-visible detector at 289 nm wavelength and delivered at a flow rate of 1 mL min−1. The EE and DL of DHANPs were calculated using the following equations (eqn (1) and (2)):
525 × g for 20 min. After centrifugation, 1.6 mL of the upper fluid and the pre-centrifugation solution were respectively taken into a 10 mL volumetric flask, followed by the addition of methanol. The content of DHA–C12 was determined by the method of high-performance liquid chromatography (HPLC)-post-column derivatization on a reverse ODS Agilent-C18 column (250 mm × 4.6 mm, 5 μm) with a methanol/acetonitrile/buffer solution (20:50:30, v/v/v) as the eluting solution. The samples were detected using an ultraviolet-visible detector at 289 nm wavelength and delivered at a flow rate of 1 mL min−1. The EE and DL of DHANPs were calculated using the following equations (eqn (1) and (2)):| |
 | (1) |
| |
 | (2) |
where M was the total weight of DHA–C12 in the pre-centrifugal nanoparticle solution, M1 was the weight of DHA–C12 in the nanoparticle solution after centrifugation, and M2 was the total weight of the carrier and DHA–C12 in the centrifuged solution.
High-performance liquid chromatography (HPLC)-post-column derivatization chromatography
Validation of analysis method of HPLC-post-column derivatization. The validation of the HPLC-post-column derivatization method was carried out with specificity, linearity, precision, accuracy, detection limit and quantitation limit. The specificity was investigated by comparing the response of the DHA ethanol solution with that of the drug-free solution. The linearity of the method was determined by operating the sample of DHA solution (DHA-Sol) at 1.0, 2.5, 5.0, 10.0, 20.0 and 50.0 μg mL−1. Then, the chromatogram of DHA was evaluated to validate the method. The precision and accuracy were evaluated by analyzing DHA samples in the same day and in three consecutive days at the concentrations of 2.5, 10.0 and 48.0 μg mL−1. The detection limit of DHA was the lowest concentration for the HPLC-post-column derivatization method to detect, and the signal-to-noise ratio of DHA-Sol was 3:1. The quantitative limit of DHA was stated as the lowest concentration for the HPLC-post-column derivatization method to detect precisely and accurately. The corresponding signal-to-noise ratio of DHA-Sol was 10:1.
In vitro release of the DHA prodrug self-assembled nanoparticles
2 mL of DHANPs were injected into the dialysis bag, and then it was placed into 20 mL of pH 7.4 PBS containing 30% anhydrous ethanol and subsequently put into a 37 ± 2 °C constant temperature water bath with an oscillator. At predetermined time points (0, 3, 6, 9, 12, and 24 h), a sample of 0.1 mL was taken and the same volume of the release medium was added. The content of DHA–C12 and DHA (including alpha and beta configurations) were determined by the HPLC-post-column derivatization method.
Long-term stability investigation of the DHA prodrug self-assembled nanoparticles
The particle size, PDI and zeta potential were used to evaluate the stability of DHANPs at 4 °C. The data of the indexes were recorded at defined times (1, 2, 4, and 8 weeks).
Pharmacokinetic study of the DHA prodrug self-assembled nanoparticles
Sprague-Dawley rats (200–250 g) were selected to study the pharmacokinetics of DHANPs. The rats were randomly divided into two groups (n = 6) and were kept from eating for 12 hours. DHA-Sol and DHANPs with equivalent DHA doses (0.02 mmol DHA kg−1) were injected via the tail vein.25 At predesigned time intervals (0.083, 0.25, 0.5, 0.75, 1, 2, 4, 6, 8, 12, 24, 36, 48 h), 300 μL of blood was collected into heparin tubes, and centrifuged at 13000 × (g) for 10 min to obtain the plasma. Then, the plasma samples were frozen at −20 °C until the analysis. Finally, the concentration of DHA in the blood was measured by liquid chromatography/tandem mass spectrometry (LC-MS/MS).
Plasma sample preparation
50 μL of plasma samples and 100 μL of internal standard solution (ART-Sol) were taken into the tube. Then, 100 μL of the mobile phase and 200 μL of pH 7.4 phosphate buffer were added. After the mixture was vortexed for 2 min, 3 mL of anhydrous ether used as the extraction solvent was added into the tube. Subsequently, the samples were vortexed for 3 min and centrifuged for 10 min at 1200 × (g). The upper organic phase was taken into a tube, which was dried with nitrogen gas in a water bath at 40 °C. 100 μL of the mobile phase was added to the tube to dissolve the dried residues. After the mixture was vortexed for 2 min, it was centrifuged for 10 min at 11525 × (g). 10 μL of the sample was subjected to LC-MS/MS analysis.
Liquid chromatography/tandem mass spectrometry
Chromatographic conditions25. Chromatography separation was performed on an Agilent 1200 series liquid chromatography system. A zorbax-C18 (150 mm × 4.6 mm, 5 μm, Agilent) was used as the analytical column eluted with the solution of 10 mM ammonium acetate (containing 0.1% formic acid) solution and acetonitrile at 0.3 mL min−1 (ammonium acetate/acetonitrile, v/v, 10:90). DHA was detected with an ESI source in the positive multiple reaction monitoring mode using Q1/Q3 ion transitions at m/z 302.1/163.1 as the qualifier. IS (ART) was detected at m/z 300.0/209.0. The source parameters were set as follows: GS1, 65 arbitrary units; and GS2, 20 arbitrary units. The decluster potential and collision energy were optimized as 55 V and 20 V, respectively, by infusing standard DHA-Sol into the mass spectrometer. The capillary temperature was set at 200 °C. DHA was quantified by calibrating for each run through a 1/x weighted least squares regression. The scanning time was 0.1 s with the ionic peak [M + NH4]+ as the parent ion.
Validation of bioanalytical method. The validation of the bioanalytical method was carried out by performing specificity, linearity, lower limit of quantification (LLOQ), precision, accuracy, recovery and matrix effect experiments. The specificity was analyzed by comparing the chromatography of blank rat samples with that of the DHA- and ART-spiked rat plasma samples and practical samples. The linearity was studied using the concentrations of DHA in rat plasma at 5, 10, 20, 40, 100, 200, 500, 1000, 2000, 5000 and 10000 ng mL−1. LLOQ samples were prepared at a concentration of 5 ng mL−1. Quality control (QC) samples were performed at three respects of low, medium and high concentrations (10.0, 500.0 and 8000.0 ng mL−1) to evaluate the precision and accuracy of the bioanalytical method. The recovery of the QC and IS samples was obtained by calculating the peak area ratio between the peak areas of extracted analytes and those of the reference solutions added to the extracted blank plasma samples. The matrix effect was evaluated by comparing the response of DHA (10.0, 500.0 and 8000.0 ng mL−1) and ART (1000.0 ng mL−1) in the rat matrix with respect to that in the solvent.
Cytotoxicity assay of the DHA prodrug self-assembled nanoparticles
The cytotoxicity assay of DHA-Sol and DHANPs was assessed in 4T1 cells using the MTT assay. 4T1 cells were grown in 1640 supplemented with 5% FBS and 1% streptomycin/penicillin under an incubator with 5% CO2 and 95% humidity at 37 °C. Briefly, 4T1 cells were seeded in 96-well plates at the density of 2000 cells per well for 24 h. Then, the cells were treated with DHA-Sol and DHANPs at different concentrations. After incubation for 48 h and 72 h, the cells were washed twice with PBS (4 °C) and incubated with 200 μL of fresh medium and 50 μL of MTT (2 mg mL−1) for 4 h. After that, the medium was discarded and 150 μL of DMSO was added to each well to solubilize the formazan crystal. The absorbance of the samples was evaluated using a microplate reader at the wavelength of 570 nm. The inhibition rate was evaluated based on the formula below:
where Otest was the absorbance value of DHA-Sol and DHANPs, and Ocontrol was the absorbance value of the control.
In vivo antitumor study and histological evaluation
Female BABL/c mice implanted with 4T1 cells were used to evaluate the antitumor efficacy of DHA-Sol and DHANPs. 0.1 mL of 4T1 cells (1 × 10⁷ mL−1) were injected into the mice at the fourth pair of breast pads. Until the tumor volume in the mice reached the range of 50–100 mm3, the mice were randomly selected and divided into three groups (n = 6). The day was recorded as “Day 0”. The mice were then injected via the tail with DHA-Sol and the DHANPs group at the dose of 0.07 mmol DHA kg−1 on days 1, 3, 5, 7 and 9. Saline was used as the control group. The tumor volume and body weight of the mice were recorded every other day. The tumor volume was calculated according to the formula: (L × W2)/2, where L was the length of the tumor and W was the width of the tumor. At day 14, the mice were sacrificed. The organs (heart, liver, lung, spleen, kidney and tumor) of the mice were removed and stored in a 10% formaldehyde solution for hematoxylin and eosin (H&E).
Statistical analysis
All data were expressed as the mean ± SD (n = 3). The statistical difference analysis was performed using SPSS software version 21 (IBM). A value of p < 0.05 was defined as statistically significant, and p values of 0.01 or less were considered as very statistically significant.
Results and discussion
Synthesis and characterization of DHA–C12
The synthetic route for DHA–C12 and the optimal molecular docking model for the two reactants in this reaction are shown in Fig. 2, respectively. The reaction yield was 81.71%. Furthermore, the characterization of DHA–C12 is shown in Fig. 2C and D. The exact mass of DHA–C12 was determined using the mass spectrometer, which showed two appropriate peaks, [M + Na]+ at 575.14 and [M + NH4]+ at 570.28. The accurate ion of m/z 570.4001 was detected as the ammonium adduct ([C31H56O8N1]+ ion) for DHA–C12, which was also in agreement with the calculated m/z value. The result indicated that the synthesis product was correct.
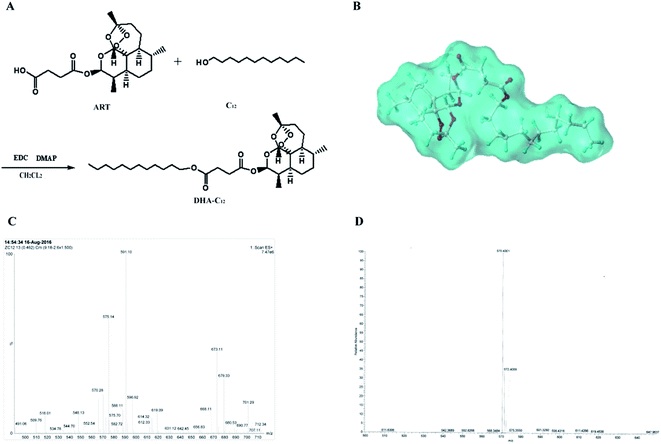 |
| | Fig. 2 The synthetic route (A), molecular docking simulation (B), the mass spectrogram (C) and high-resolution mass spectrogram (D) of DHA–C12. | |
Optimization of the preparation conditions for the DHA prodrug self-assembled nanoparticles
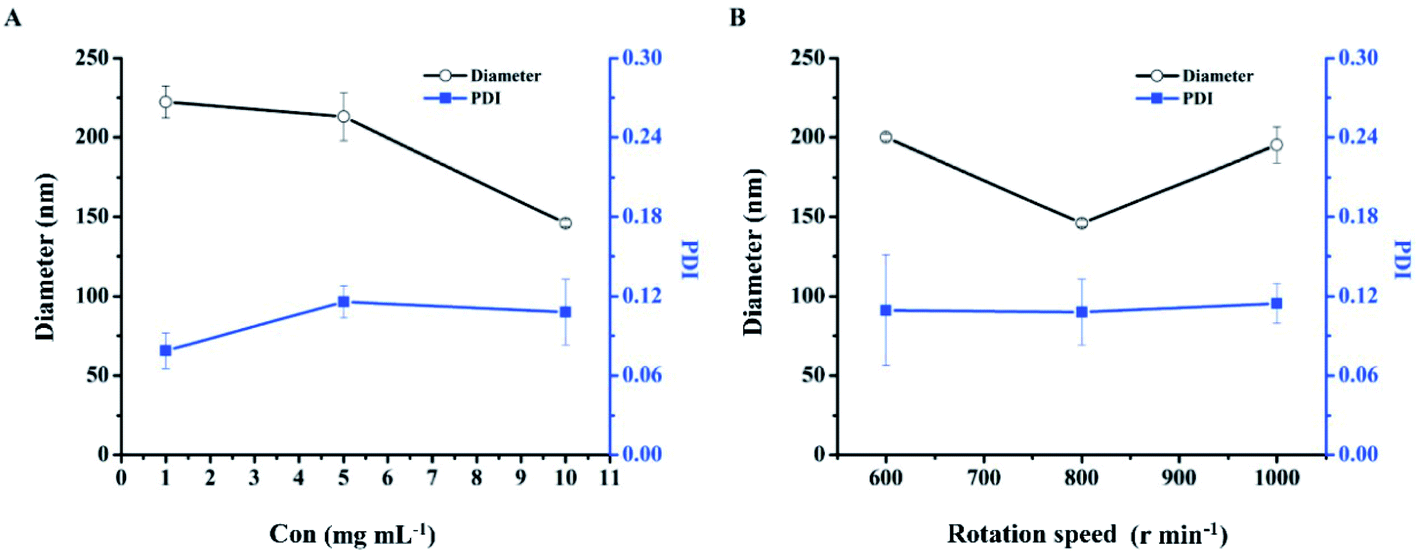
Optimization of the preparation concentration. The effect of the concentration of DHA–C12 on the particle size and PDI of DHANPs is shown in Fig. 3A. It can be seen that the particle size decreased with an increase in the preparation concentration of DHA–C12. Additionally, the PDI was less than 0.20 when the concentration of DHA–C12 was 10 mg mL−1. Furthermore, in order to reduce the amount of ethanol injection in the subsequent pharmacokinetic studies, 10 mg mL−1 of DHA–C12 was selected as the preparation concentration.
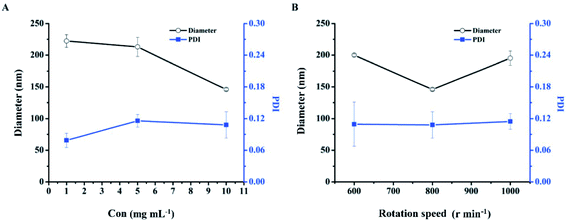 |
| | Fig. 3 The particle size and PDI of DHANPs at different preparation concentrations of DHA–C12 (A) and rotation speeds (B). | |
Optimization of the rotation speed. Fig. 3B shows the effect of the rotation speed on the particle size and PDI of DHANPs. DHANPs had a stable PDI at the speeds of 600, 800 or 1000 rpm. To obtain a smaller particle size, 800 rpm was selected as the rotation speed.
Optimization of the injection rate and preparation temperature. The effects of the injection rate of DHA–C12 and the preparation temperature of the dispersion medium on the particle size and PDI of DHANPs were investigated. The particle size of DHANPs prepared by a slow injection rate of DHA–C12 (145.9 ± 2.107 nm) was smaller than that of those prepared by a fast injection rate (210.1 ± 12.813 nm) when the temperature of the dispersion medium was 25 °C. At 37 °C, the particle size was larger at both fast injection rate (215.2 ± 10.701 nm) and slow injection rate (195.1 ± 8.749 nm). In general, a slow injection rate of DHA–C12 at 25 °C in water was selected to prepare DHANPs.
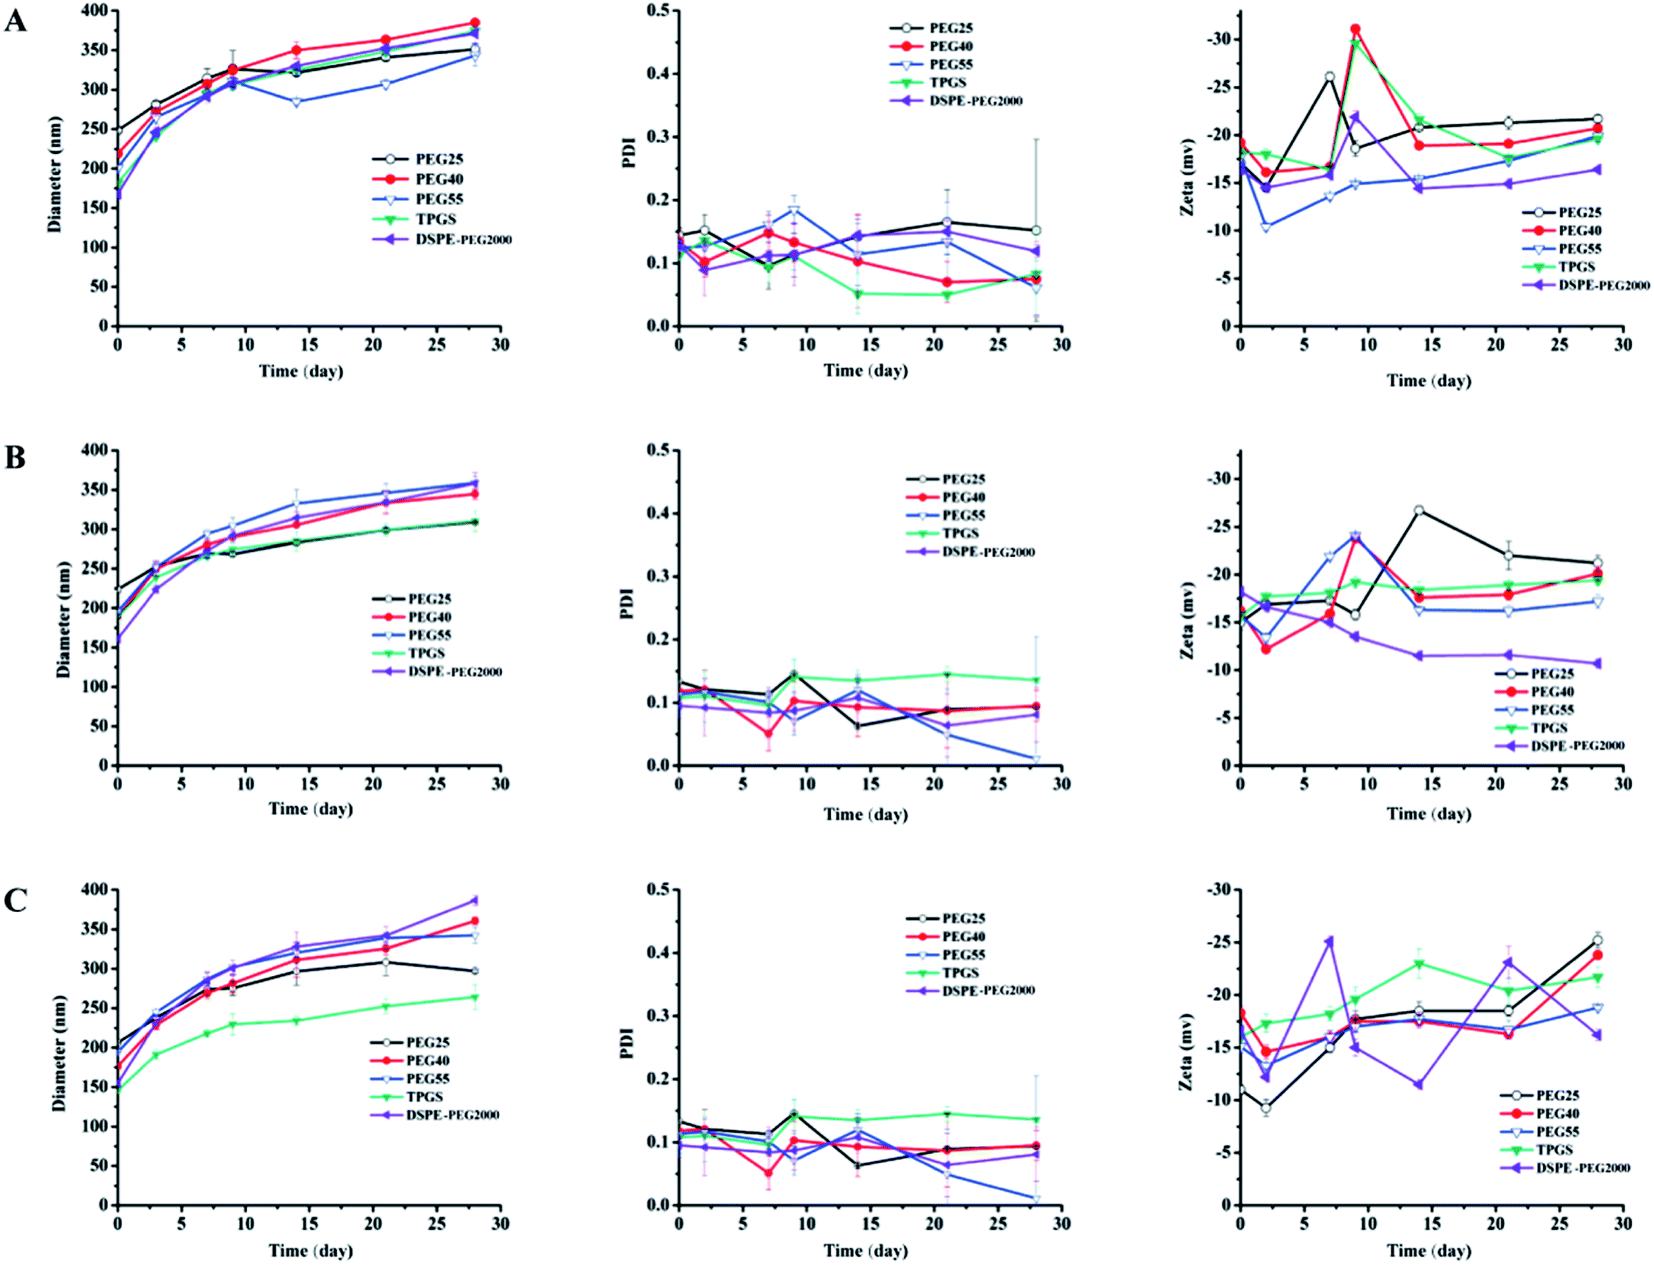
Optimization of the stabilizer. The use of stabilizer was very important for the stability of DHANPs. Fig. 4 shows the effect of different PEG stabilizers (n = 25, 40, 55), TPGS and DSPE-PEG2000 in different ratios on the stability of DHANPs. An increase in the particle size of DHANPs was observed with the increase in shelf-life. When the ratio of stabilizer/DHA–C12 was 5% and 10% (w/w), the particle size increased rapidly and the PDI fluctuated greatly compared with that of the ratio at 20%. When TPGS was selected as the stabilizer, the growth rate of the particle size of DHANPs was relatively slow. In addition, the change was not particularly large compared with the other stabilizers. Furthermore, TPGS was a derivative of vitamin E, which was synthesized from the esterification of polyethylene glycol 1000 (PEG1000) and a-tocopheryl succinate. Many studies showed that TPGS could be used as a P-glycoprotein (P-gp) inhibitor to increase the therapeutic effect of anticancer drugs.26–28 In addition to this, it could be used as a stabilizer, absorption enhancer, emulsifier and a carrier for nano-drug delivery systems.29–31 As a stabilizer, TPGS contained the advantages of PEG, and was approved to improve the colloidal stability of nanoparticles and prolong the systemic circulation of nanoparticles in the bloodstream.32–35 More importantly, TPGS had already been approved as a pharmaceutically safe excipient by the United States' Food and Drug Administration (FDA).1,34 Combined with the experimental results, TPGS was selected as the optimal stabilizer, and a ratio of 20% for the stabilizer/DHA–C12 was used to achieve the better-stabilized nanoparticles.
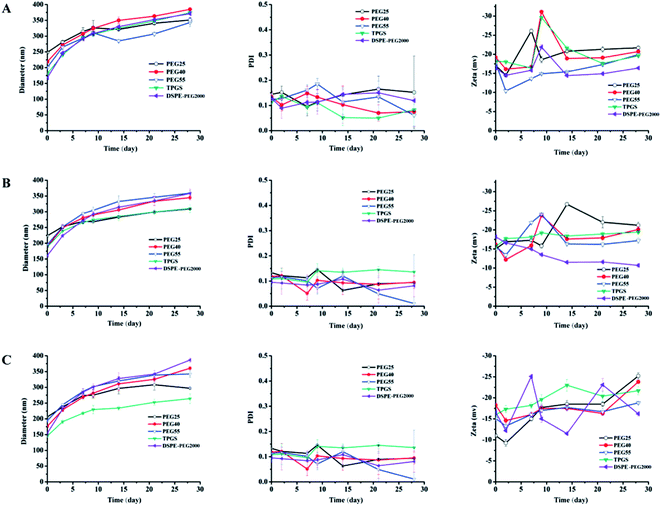 |
| | Fig. 4 The particle size, PDI and zeta potential of DHANPs with different stabilizers ((A) 5%; (B) 10%; (C) 20%; w/w, DHA prodrug/stabilizer). | |
The preparation and characterization of the DHA prodrug self-assembled nanoparticles
The particle size, PDI and zeta potential of the optimized DHANPs were 145.9 ± 2.107 nm, 0.108 ± 0.025 and −16.0 ± 0.52 mV, respectively. Fig. 5 shows the photograph, TEM and dynamic light scattering of DHANPs. DHANPs were light blue opalescent, and the morphology of DHANPs was round and spherical with relatively uniform particle size distribution. The easy preparation of the self-assembled nanoparticles of the DHA prodrug could be explained by the fabrication of the nanoparticles only requiring the prodrug and water.
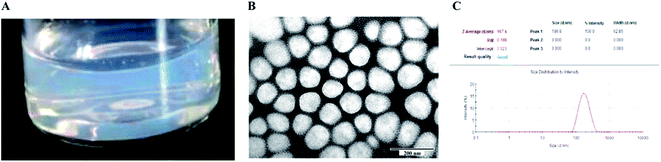 |
| | Fig. 5 The photograph (A), transmission electron micrograph image (B) and particle size distribution (C) of DHANPs. | |
High-performance liquid chromatography (HPLC)-post-column derivative chromatography
Fig. S1† shows the specificity of the HPLC-post-column derivative assay of DHA. Under the optimized conditions of the HPLC-post-column derivative chromatography, the solvent did not interfere with the determination of DHA. The specificity of the method satisfied the experimental requirements. The calibration curve of DHA was A = 6644.7C + 5796 (r2 = 0.9994). The results showed that DHA had good linearity throughout the concentration range of 1.0–50 μg mL−1. Table S1† shows the result of precision. It can be seen from Table S1† that the RSD of the intra-day and inter-day precision was less than 2%. The recovery of DHA at low, medium and high concentrations ranged from 98% to 102%, and the RSD of each concentration was less than 2% (Table S2†). Under the chromatographic condition, the quantitative limit and detection limit of DHA were 1 μg mL−1 and 500 ng mL−1, respectively. It was expected that the method in this chromatographic condition was accurate and applicable for determining the concentration of DHA.
Determination of EE and DL of the DHA prodrug self-assembled nanoparticles
The DHA prodrug self-assembled nanoparticles prepared by molecular self-assembly technology had higher EE and DL values, which were 92.37 ± 3.68% and 76.98 ± 3.07%, respectively. The reason for this might be that the use of the carbon chain in DHA–C12 increased the hydrophobicity of DHA compared with that of DHA only. The solubility of DHA–C12 in anhydrous ethanol was better than its solubility in water. On account of the differences in solubility, the DHA prodrug molecules gathered quickly in the water to form molecular aggregates. As a result, this principle could be used to prepare self-assembled nano-preparations for high DL.
In vitro release of the DHA prodrug self-assembled nanoparticles
The high-performance liquid phase post-column derivatization method was used to measure the content of DHA released from DHANPs. The results are shown in Fig. 6A. According to Fig. 6A, the release of DHA from DHANPs could not be observed within 24 h, and the release speed was very slow. The cumulative release of the DHA–C12 prodrug from DHANPs was 45.34% at 6 h, and the release subsequently decreased gradually. Consequently, the stability of DHA in the release medium was investigated in our previous study, which showed that DHA was stable in the anhydrous ethanol, but it degraded quickly in the release medium.25 The reason might be attributed to the fact that the DHA prodrug with the non-reducing sensitive ester bond between DHA and C12 maintained drug stability in the release medium, which might help DHA maximize its cumulative effect on the tumor cells. Therefore, the release of the prodrug still needs to be further studied in our future study.
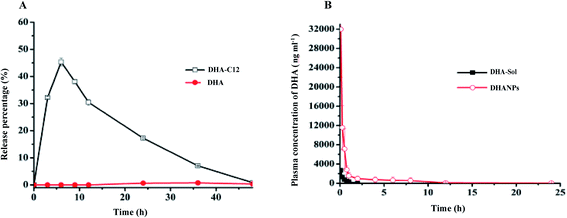 |
| | Fig. 6 In vitro release of DHANPs in PBS (A) and plasma concentration–time profiles of DHA in rats after intravenous administration of DHA-Sol and DHANPs (0.02 mmol DHA kg−1) (B). | |
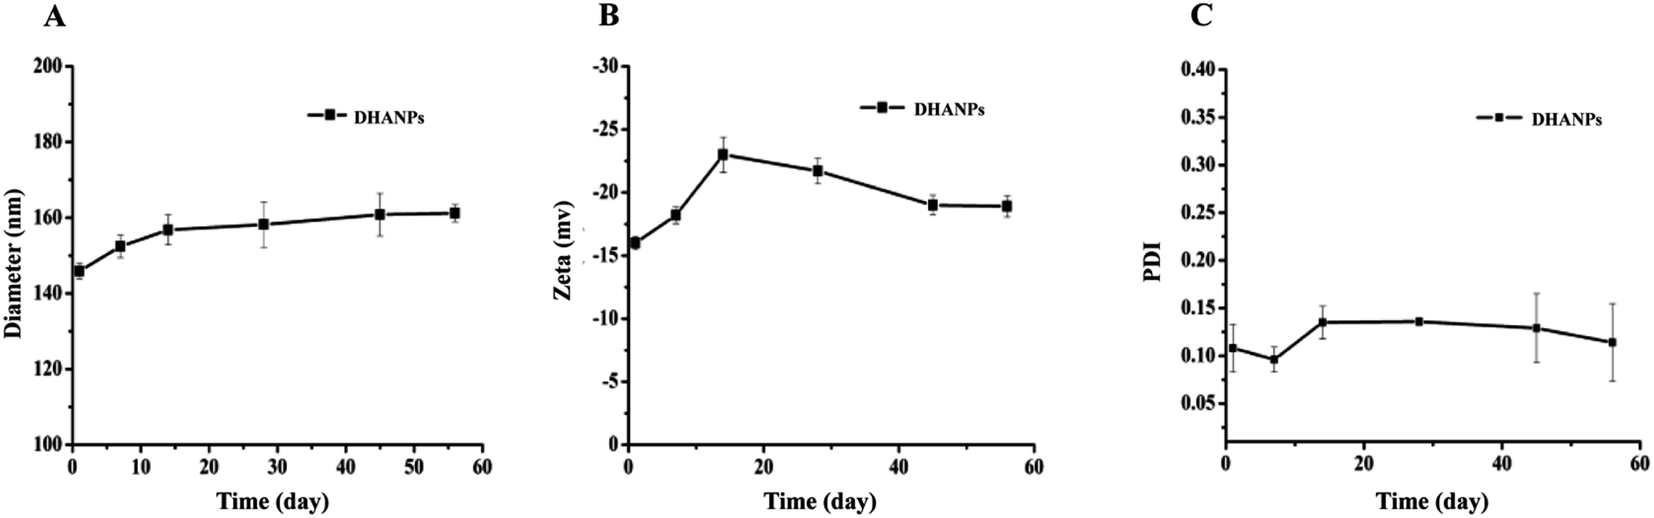
Long-term stability investigation of the DHA prodrug self-assembled nanoparticles
The measurements of the particle size, PDI and zeta potential of DHANPs at predesigned time points are shown in Fig. 7. As time progressed, the particle size of DHANPs showed the trend of slow growth, the overall fluctuation of PDI was in the 0.08–0.22 range, and the zeta potential was in the range from −25 to −15. Consequently, these results indicated that DHANPs remained relatively stable for two months when preserved at 4 °C. The reasons for the long-term stability include: (i) the DHA prodrug with an ester bond between DHA and C12 maintained the drug stability and (ii) the chains increased the hydrophobicity of the drug.
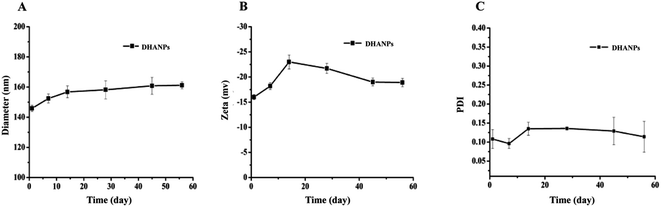 |
| | Fig. 7 The particle size (A), PDI (B) and zeta potential (C) of DHANPs during the storage. | |
Liquid chromatography/tandem mass spectrometry
The result of specificity is shown in Fig. S2.† Fig. S2† shows that the endogenous plasma components in the rat plasma did not interfere with the analysis of DHA and the internal standard (ART) under the chromatographic conditions of HPLC-MS/MS. Both drugs were individually analyzed. The regression calibration curve was Y = 0.564X + 0.519 (r2 = 0.9959), which was calculated by the weighted least square method. The linearity of the calibration curve was good within the concentration range of 5–10000 ng mL−1. The accuracy and precision of DHA at LLOQ are shown in Table S3.† The LLOQ of DHA in rat plasma was 5.0 ng mL−1. The accuracy and intra- and inter-day precision of the method for DHA in rat plasma are shown in Table S4.† It showed that the RSD of DHA in the intra-day and inter-day precision and accuracy was less than 11% and 14%, respectively. The recovery and matrix effect were investigated during the period of the method development, which were consistent with the requirements of the methodological requirement. The recoveries of DHA for low, medium and high concentrations and the internal standard were 95.6%, 98.3%, 102.4% and 96.6%, respectively. The matrix effect of DHA for low, medium and high concentrations and the internal standard was 94.3%, 102.5%, 99.4% and 103.6%, respectively. In all, this method could be used for the measurement of DHA and ART in rat plasma.
Pharmacokinetic study of the DHA prodrug self-assembled nanoparticles
SD rats were treated with DHA-Sol and DHANPs via tail intravenous injection. The average blood drug concentration–time curve is shown in Fig. 6B. The pharmacokinetic parameters of the DHA-Sol and DHANPs groups are presented in Table S5.†25 The DHA concentrations in plasma versus time curves after intravenous administration of DHA-Sol and DHANPs showed that the blood concentration and circulating time of the DHA of DHANPs were significantly higher compared with those of DHA-Sol. After administration of DHANPs, the area under the blood concentration versus time curve from 0 to 24 h (AUC0–24) (p < 0.01) was 16.12 times, and the half-life period t1/2 (p < 0.01) was 12.67 times higher than that of DHA-Sol. Compared with our previous result of the pharmacokinetic study of DSCNs,25 the AUC0–24 and t1/2 of DHANPs were significantly higher than that of DSCNs. It was suggested that DHA–C12 with an ester bond as the linker could improve the plasma concentration of DHA more significantly than the DHA–S–S–C12 with a disulfide bond as the linker. It might be that DHANPs could improve the stability of DHA in the plasma. These results demonstrated that DHANPs significantly increased the DHA concentration in the area under the curve, and extended the life-cycle of DHA in the rats.
Cytotoxicity assay of the DHA prodrug self-assembled nanoparticles
The results of the inhibition rate of 4T1 cells after treatment with different concentrations of DHA-Sol and DHANPs for 48 h and 72 h are shown in Fig. S3.† The inhibition rate of the 4T1 cells could be improved with increasing drug concentration and prolonged incubation time. It showed that the anti-proliferation ability of DHA-Sol and DHANPs on the 4T1 cells was time- and dose-dependent. The in vitro antitumor effects of the DHA-Sol and DHANPs were also evaluated by the half-maximal inhibitory concentration (IC50). The result of the IC50 study is shown in Table S6.† After the 4T1 cells were treated with DHA-Sol and DHANPs for 48 h, the IC50 of DHA-Sol and DHANPs was 2.31 ± 0.10, and 2.47 ± 0.15 (μmol L−1), respectively. When the incubation time was 72 h, the IC50 value was found to be up to 0.62 ± 0.02 and 1.79 ± 0.13 (μmol L−1), respectively, for DHA-Sol and DHANPs. The cytotoxicity of DHA-Sol was higher than that of DHANPs. It might be that the release of the DHA prodrug was slow, and the content of DHA in the 4T1 cells was lower than that of DHA-Sol.
In vivo antitumor study and histological evaluation
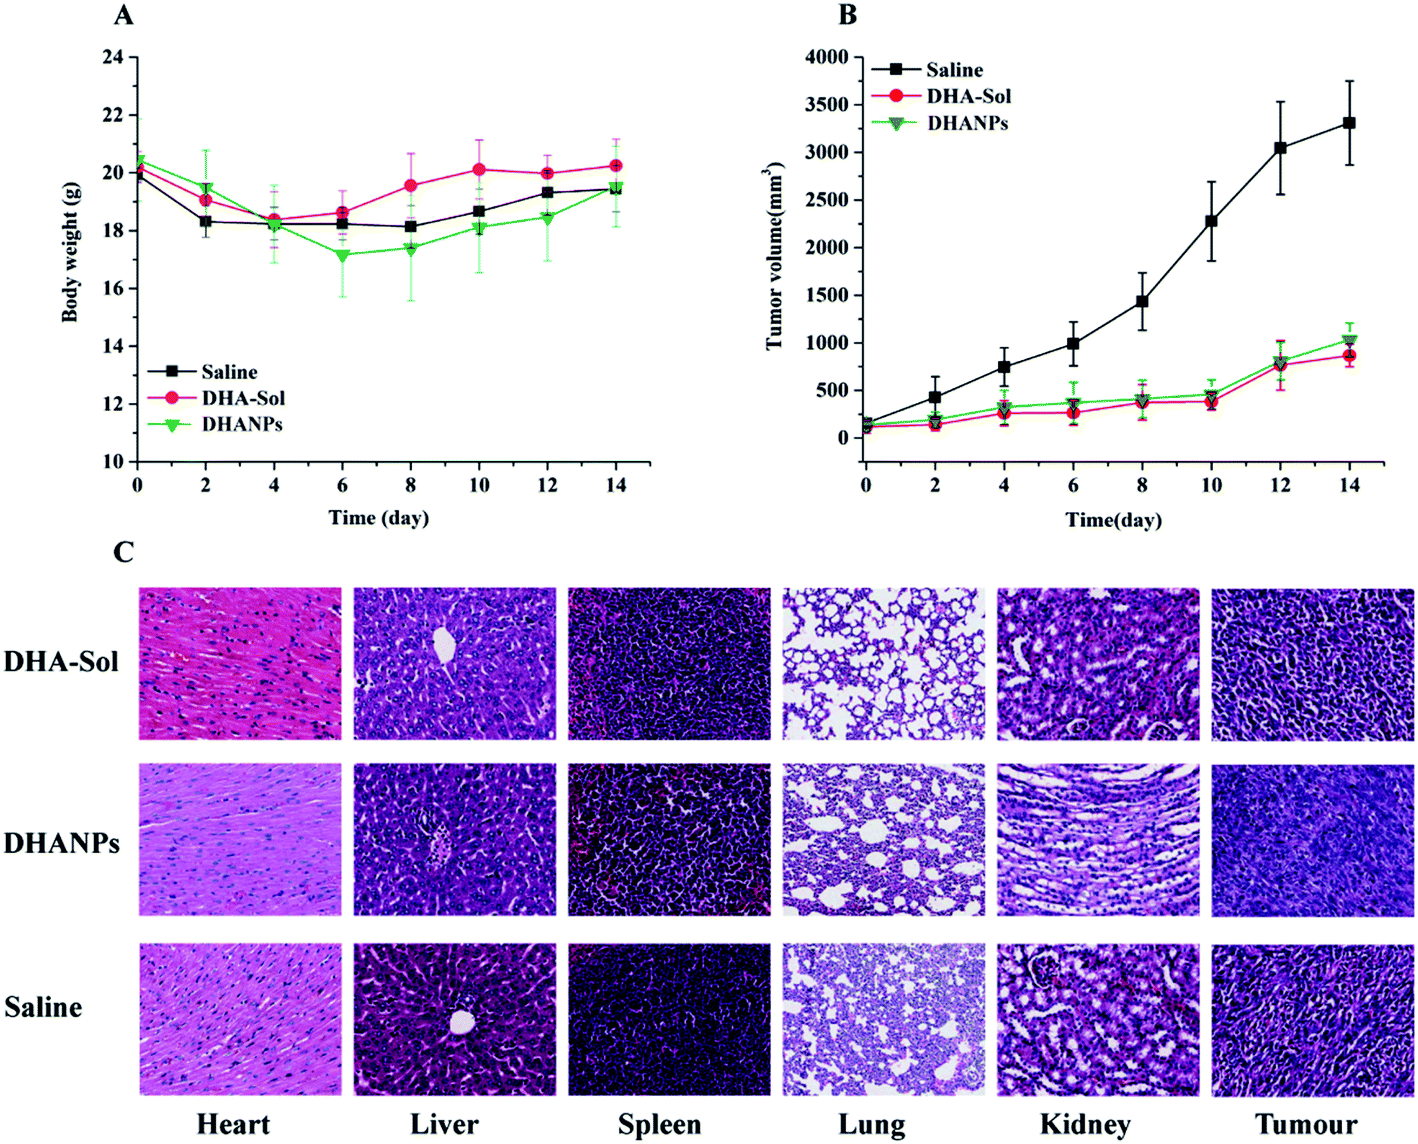
The in vivo antitumor efficacy of the DHA-Sol and DHANPs groups was studied by the 4T1 cell tumor-bearing xenograft model. The result is shown in Fig. 8. Fig. 8B shows that the tumor growth of the DHA-Sol and DHANPs groups was slow, while the tumor volume of the saline group grew faster. After 14 days, the tumor volume of the saline group (3309.68 ± 441.61 mm3) was much bigger than that of the DHA-Sol (867.27 ± 117.43) and DHANPs groups (1031.92 ± 177.34 mm3) (p < 0.1). In addition, there were no statistically significant differences in the tumor volume of mice between the DHA-Sol group and DHANPs group (p > 0.1). However, two mice treated with the DHA-Sol group died during the experiment. In contrast, all mice in the DHANPs group were alive. As shown in Fig. 8A, a significant change in the body weight of rats was not observed between the saline group, DHA-Sol group and DHANPs group at the end of the experiment (p > 0.1), suggesting that the DHANPs group improved the quality of life of the mice without increasing the toxicity. An H&E study was carried out to analyze the toxicity of the DHA-Sol and DHANPs groups on different tissues (Fig. 8C). It showed that the toxicity of the DHA-Sol and DHANPs groups on the tissues of the heart, liver, lung, spleen and kidney was low in comparison with those of the saline group. However, the tumor tissue of mice receiving the treatment with DHANPs displayed the most serious apoptosis, the least proliferation and the lowest quantity of tumor cells. The results of the in vivo antitumor study and histological evaluation demonstrated that DHANPs could be a prospective and effective nano-drug delivery system.
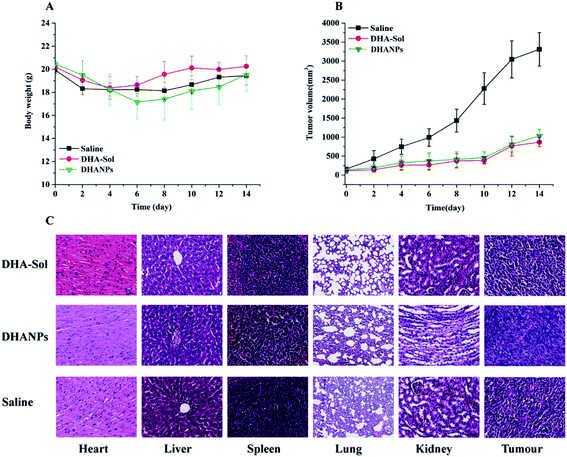 |
| | Fig. 8 The changes of tumor volume (A) and body weight (B) of the mice administered with saline, DHA-Sol and DHANPs at 1, 3, 5, 7, 9 day. Each group was intravenously treated five times at a dosage of 0.07 mmol DHA kg−1. The histological examination of heart, liver, spleen, lungs, kidney and tumor tissues in xenograft model of 4T1 cells in saline, DHA-Sol and DHANPs-treated groups at the end of the experiment (C). | |
Conclusions
In the present study, a DHA ester prodrug was successfully synthesized, which was further fabricated into self-assembled nanoparticles through the molecular self-assembly technology. The results of the study of properties of the self-assembled nanoparticles (including particle size, zeta potential, morphology, stability, EE and DL) indicated that DHANPs were spherical, well-rounded and possessed high EE (>92%) and DL (>76%). Further, they remained stable for up to two months. At 37 ± 2 °C, the release of DHA from DHANPs could not be observed within 24 h, and the rate of release of DHA–C12 from DHANPs was very slow, which could be the reason for the accumulation of a higher concentration of the prodrug in tumor cells. DHA-Sol and DHANPs showed time-and dose-dependent cytotoxicity against 4T1 cells. As we expected, the pharmacokinetic study showed that DHANPs prepared by DHA–C12 with an ester bond as the linker could significantly increase the DHA concentration in the area under the curve, and extended the life-cycle of DHA in the body. Compared to the DHA-Sol group, the quality of life of the mice treated with DHANPs was improved. Therefore, DHA prodrug nanocomplexes as a nano-drug delivery system are expected to be used successfully as a prospective nano-drug delivery system for artemisinin-based anti-tumor drugs.
Conflicts of interest
The authors report no conflicts of interest.
Acknowledgements
This work was supported by the Startup Foundation for Doctors of Shanxi Medical University (03201619), the Science and Technology Innovation Project of Higher School of Shanxi Province (2017148), the Applied Basic Research Project of Shanxi Province (201701D221162), the Science and Technology Innovation Project for Outstanding Talents of Shanxi Province [201805D211002] and the Education and Teaching Innovation Project of Shanxi Medical University (XJ2018036).
References
- J. Tao, Z. Tan, L. Diao, Z. Ji, J. Zhu, W. Chen and Y. Hu, RSC Adv., 2018, 8, 21735–21744 RSC.
- L. Wang, J. Li, X. Shi, S. Li, P. M. Tang, Z. Li, H. Li and C. Wei, Phytomedicine, 2019, 52, 147–156 CrossRef CAS PubMed.
- S. S. Chen, W. Hu, Z. Wang, X. E. Lou and H. J. Zhou, Cancer Biol. Ther., 2015, 16, 770–779 CrossRef CAS PubMed.
- J. Zhao, Y. Pan, X. Li, X. Zhang, Y. Xue, T. Wang, S. Zhao and Y. Hou, Cell. Physiol. Biochem., 2017, 43, 589–601 CrossRef CAS PubMed.
- R. Shen, J. Li, D. Ye, Q. Wang and J. Fei, Acta Biochim. Biophys. Sin., 2016, 48, 894–901 CrossRef CAS PubMed.
- L. Wu, Y. Cheng, J. Deng, W. Tao and J. Ye, J. Evidence-Based Complementary Altern. Med., 2019, 2019, 9581327 Search PubMed.
- A. K. Das, Ann. Med. Health Sci. Res., 2015, 5, 93–102 CrossRef CAS PubMed.
- F. Gao, Z. Sun, F. Kong and J. Xiao, Eur. J. Med. Chem., 2020, 188, 112044 CrossRef CAS PubMed.
- S. H. Kim, S. H. Kang and B. S. Kang, Nutr. Res. Pract., 2016, 10, 393 CrossRef CAS PubMed.
- Y. Liu, S. Gao, J. Zhu, Y. Zheng, H. Zhang and H. Sun, Cancer Med., 2018, 7, 5704–5715 CrossRef CAS PubMed.
- G. Wu, J. Lu, J. Guo, M. Huang, L. Gan, X. Chen and Y. Wang, Pharmacol. Rep., 2013, 65, 453–459 CrossRef CAS PubMed.
- M. Lucibello, S. Adanti, E. A. Dezi, S. Ciafrè, M. L. Carcangiu, M. Zonfrillo, G. Nicotera, L. Sica, F. D. Braud and P. Pierimarchi, Oncotarget, 2015, 6, 5275–5291 CrossRef PubMed.
- Y. Yao, Q. Guo, Y. Cao, Y. Qiu, R. Tan, Z. Yu, Y. Zhou and N. Lu, J. Exp. Clin. Cancer Res., 2018, 37, 282 CrossRef CAS PubMed.
- L. Dai, L. Wang, L. Deng, J. Liu, J. Lei, D. Li and J. He, Sci. Rep., 2014, 4, 5871 CrossRef CAS PubMed.
- K. T. Batty, K. E. Iletr, S. M. Powell, J. Martin and T. M. E. Davis, Am. J. Trop. Med. Hyg., 2002, 66, 130–136 CrossRef CAS PubMed.
- X. Zhang, J. Liu, H. Qiao, H. Liu, J. Ni, W. Zhang and Y. Shi, Powder Technol., 2010, 197, 120–128 CrossRef CAS.
- J. Chen, G. Li, Q. Liu, Y. Liang, M. Liu, H. Wu and W. Gao, nanomaterials, 2019, 9, 1–10 Search PubMed.
- T. Frohlich, A. Kiss, J. Wolfling, E. Mernyak, A. E. Kulmany, R. Minorics, I. Zupko, M. Leidenberger, O. Friedrich, B. Kappes and F. Hahn, et al., ACS Med. Chem. Lett., 2018, 9, 1128–1133 CrossRef PubMed.
- K. Liu, L. Dai, C. Li, J. Liu, L. Wang and J. Lei, Sci. Rep., 2016, 6, 29461 CrossRef CAS PubMed.
- X. A. Yu, M. Lu, Y. Luo, Y. Hu, Y. Zhang, Z. Xu, S. Gong, Y. Wu, X. N. Ma, B. Y. Yu and J. Tian, Theranostics, 2020, 10, 371–383 CrossRef PubMed.
- W. N. Omwoyo, P. Melariri, J. W. Gathirwa, F. Oloo, G. M. Mahanga, M. Lonji Kalombo, B. Ogutu and H. Swai, Nanomedicine, 2016, 12, 801–809 CrossRef CAS PubMed.
- B. Sun, C. Luo, H. Yu, X. Zhang, Q. Chen, W. Yang, M. Wang, Q. Kan, H. Zhang, Y. Wang and Z. He, et al., Nano Lett., 2018, 18, 3643–3650 CrossRef CAS PubMed.
- C. Luo, J. Sun, B. Sun, D. Liu, L. Miao, T. J. Goodwin, L. Huang and Z. He, Small, 2016, 12, 6353–6362 CrossRef CAS PubMed.
- G. Ren, P. Chen, J. Tang, R. Wang, S. Duan, R. Wang, Y. Xie and S. Zhang, Drug Dev. Ind. Pharm., 2018, 44, 598–607 CrossRef CAS PubMed.
- P. Chen, G. Ren, W. Guo, J. Tang, R. Wang and S. Zhang, Chin. J. Pharm., 2018, 53, 1477–1484 Search PubMed.
- N. Duhem, F. Danhier and V. Préat, J. Controlled Release, 2014, 182, 33–44 CrossRef CAS PubMed.
- H. Zhu, H. Chen, X. Zeng, Z. Wang, X. Zhang, Y. Wu, Y. Gao, J. Zhang, K. Liu, R. Liu and L. Cai, et al., Biomaterials, 2014, 35, 2391–2400 CrossRef CAS PubMed.
- S. Zafar, S. Akhter, N. Garg, A. Selvapandiyane, G. K. Jain and F. J. Ahmad, Eur. J. Pharm. Biopharm., 2020, 148, 10–26 CrossRef CAS PubMed.
- H. Choudhury, B. Gorain, M. Pandey, S. A. Kumbhar, R. K. Tekade, A. K. Iyer and P. Kesharwani, Int. J. Pharm., 2017, 529, 506–522 CrossRef CAS PubMed.
- M. R. Vijayakumar, K. Y. Vajanthri, C. K. Balavigneswaran, S. K. Mahto, N. Mishra, M. S. Muthu and S. Singh, Colloids Surf., B, 2016, 145, 479–491 CrossRef CAS PubMed.
- J. Shen, Q. Yin, L. Chen, Z. Zhang and Y. Li, Biomaterials, 2012, 33, 8613–8624 CrossRef CAS PubMed.
- C. Luo, J. Sun, D. Liu, B. Sun, L. Miao, S. Musetti, J. Li, X. Han, Y. Du, L. Li and L. Huang, et al., Nano Lett., 2016, 16, 5401–5408 CrossRef CAS PubMed.
- R. Guo, Y. Long, Z. Lu, M. Deng, P. He, M. Li and Q. He, Acta Pharm. Sin. B, 2019, 1–12 Search PubMed.
- C. M. Neophytou, C. Constantinou, P. Papageorgis and A. I. Constantinou, Biochem. Pharmacol., 2014, 89, 31–42 CrossRef CAS PubMed.
- H. Youk, E. Lee, M. Choi, Y. Lee, J. Chung, S. Kim, C. Lee and S. Lim, J. Controlled Release, 2005, 107, 43–52 CrossRef CAS PubMed.
Footnote |
| † Electronic supplementary information (ESI) available. See DOI: 10.1039/d0ra02150d |
|
| This journal is © The Royal Society of Chemistry 2020 |
Click here to see how this site uses Cookies. View our privacy policy here. 
 Open Access Article
 This Open Access Article is licensed under a Creative Commons Attribution-Non Commercial 3.0 Unported Licence
 a,
Pei Chen
a,
Pei Chen