 Open Access Article
Facile preparation of a Ag/graphene electrocatalyst with high activity for the oxygen reduction reaction†
Yaqi Renab,
Hong Zhao*c,
Jianpeng Lid,
Rui Wanga and
Zhaohuan Wei *ef
*ef
aSchool of Materials and Environmental Engineering, Chengdu Technological University, Chengdu, 611730, China
bCenter of Big Data for Smart Environmental Protection, Chengdu Technological University, Chengdu 611730, China
cSchool of Materials Science and Energy Engineering, Foshan University, Foshan, 528225, China. E-mail: mezhaohong@gmail.com
dSchool of Chemistry and Materials Engineering, Huizhou University, Huizhou, 516007, China
eSchool of Physics, University of Electronic Science and Technology of China, Chengdu, 611731, China. E-mail: zhwei@uestc.edu.cn
fGuangdong Provincial Key Laboratory of Energy Materials for Electric Power, Shenzhen 518055, China
First published on 20th April 2020
Abstract
Small Ag nanoparticles are well dispersed onto graphene sheets via a simple and environmentally friendly route using disposable paper-cups. The obtained Ag/graphene materials exhibit much higher catalytic activity for the oxygen reduction reaction than the conventional Ag/graphene catalyst does in alkaline media.
1. Introduction
Alkaline anion exchange membranes fuel cells have recently received increasing interest as the alkaline medium enables fast kinetics and improved stability even with non-Pt catalysts.1,2 Many researches have been done to synthesize non-Pt electrocatalysts for alkaline anion exchange membranes fuel cells with different materials including Pd, Ag, Ni, and Mn-oxides.3–6 Among them, Ag is one of the most suitable non-Pt electrocatalyst candidate for the oxygen reduction reaction (ORR) in alkaline media, as Ag is not only about 50 times cheaper than Pt, but also stable at high pH in terms of its thermodynamics and electrochemistry.7–13 However, an issue with the conventional method to form Ag nanoparticles (Ag NPs) is that the particles are large in size (7–500 nm) and are not well dispersed.14 As a result, the Ag-based catalysts formed with conventional methods have low electrochemical surface areas, and hence low electrochemical activities.To form the electrocatalyst, it is essential to load Ag NPs onto a support material. An excellent support could maximize the active surface area for electrocatalytic reaction, minimize catalyst cost, as well as provide high electronic conductivity for electrochemical reactants. Graphene is now widely used for electronic, energy storage and catalytic applications due to an excellent conductivity and mechanical property. In the electrocatalytic field, graphene is regarded as an excellent support material, mainly because the intimate contact between the graphene support and metal particles enables the catalysts to be formed to have high activity.15–17 However, it is difficult to obtain small and well-dispersed graphene supported Ag NPs since Ag NPs are easy to agglomerate with each other to reduce the surface energy, unless adding stabilizers or surfactants. However, the utilization of surfactants could contaminate the metal catalyst surface, which can seriously impact the performance of the catalyst. Meanwhile, because it is difficult or high cost to produce graphene with high quality in a high yield, which could limit the application of graphene as catalyst support in fuel cells.18–22
As a result, it is very important and urgent to find a feasible route for both preparing high quality graphene with low cost and small sized and well dispersed Ag NPs without using any surfactants to improve the ORR activity of the Ag nanoparticles in alkaline media. Some previous works have focused on high quality graphene on a large scale from disposable paper-cups as a carbon source, as well as well dispersed metal NPs with small sizes supported on graphene nanosheets, which provides a good reference for us to carry out this mission.23–25
In this work, we extend the procedures reported in the previous works as follows: first, graphene with Fe is synthesized from disposable paper-cups with Fe2+ where Fe2+ plays the role of catalyst, in which the resources are environmentally friendly and cheap. Subsequently, after adding the as-prepared Fe/graphene materials into Ag+ solutions, Ag+ would react with Fe via a galvanic replacement process. After this simple route, well dispersed Ag NPs with small sizes are anchored onto graphene sheets without aggregation. Besides, the graphene prepared via this method has little defects, which is benefit for increasing the electrocatalytic activity. Furthermore, no surfactant is used during the synthesis process, clearing off the passive impact of electrocatalytic sites. Based on the above advantages, this Ag/graphene structure could help improve the electrocatalytic performance compared with the Ag/C catalyst prepared by conventional method.26
2. Materials and methods
On the basis of the previous work,23 a disposable paper-cup was cut into small pieces and dispersed in 1.0 M KOH aqueous solution. After stirring for 72 h, the solid was washed and centrifuged for several cycles with distilled water until neutral, obtaining K+-doped paper-cups pulp. Then the pulp was put into 1 M (NH4)2Fe(SO4)2 solution with stirring for 48 h under nitrogen condition. After repeating the procedure for three times, the Fe2+-paper-cup pulp was obtained. The Fe2+-pulp was then calcined at 1100 °C under N2 atmosphere for 30 min. After cooling to room temperature, the sample was stirred in 1 M HCl for 1.5 h to eliminate the redundant Fe species. Finally, dispersed Fe/graphene in 0.1 mM AgNO3 solution under ultrasound condition for 5 hours, filtered and washed for 3 times, as well as dried in vacuum at 80 °C for 6 h, to obtain the Ag/graphene sample.The structures of the samples were characterized by means of transmission electron microscopy (TEM, JEM-2010), X-ray photoelectron spectroscopy (XPS, ESCALAB 250 system, VG), Raman spectrometer (Jobin Yvon HR 800), X-ray diffraction (XRD, Rigaku D/Max 2500/PC) and thermogravimetric analysis (STA449F3 Jupiter).
Linear sweep voltammograms (LSV) curves were tested in a conventional three-electrode system in 0.1 M KOH media. A platinum wire, Hg/HgO electrode (0.1 M KOH, 0.164 V vs. SHE) and rotating disc electrode (RDE) were used as the counter electrode, reference electrode and working electrode, respectively. A homogeneous ink was processed by dispersing 4 mg catalysts in Nafion–ethanol solution (2 mL, 1 vol%) with sonication for 1 h and dried with an infrared lamp. Then the catalyst ink was coated onto the GC electrode for the ORR test. For comparison, the ORR property of Ag/C (Vulcan XC72) sample prepared with conventional method26 was tested in the same condition.
3. Results and discussion
The formation mechanism of the as prepared Ag/graphene from disposable paper-cups is shown as Fig. 1. Paper cups are made from wood, which mainly contain lignin and hemicellulose. Lignin and hemicellulose are amorphous, polyphenolic, and highly cross-linked polymer, made of C–C bonds and C–O bonds. After KOH activating, many oxygen-containing groups in lignin and hemicellulose combine with K+, forming K+ coordination structures. When immersing in (NH4)2Fe(SO4)2 solution, Fe2+ coordination structures are formed by ion-exchange process between K+ and Fe2+ ions. In the subsequent heating process, Fe phase is reduced, and carbon atoms penetrated into Fe phase, in a manner similar to graphitization, to form a dense template FeC3 layer. Next, as the temperature decreased, the activated carbon atoms in FeC3 spread to the surface of the Fe phase, forming a dense two-dimensional layer of carbon atoms (graphene). As excess carbon atoms were deposited on the previously formed graphene layer, multiple layers of graphene were formed.23,27 When Ag+ adsorbed on the graphene, Ag ions react with Fe via a galvanic replacement process. The chemical equation is shown in eqn (1) as follows. Thermodynamically, the standard electrode potentials of Fe2+/Fe and Ag+/Ag are −0.447 V and 0.800 V, respectively. During the replacement reaction, the concentration of Ag+ is 0.1 mM, and we can calculate that the conditional electrode potential is 0.563 V according to Nernst equation. The concentration of Fe2+ is unknown, so we use the standard data approximately. As a result, the potential difference of Fe–Ag is calculated to be 1.01 V, which means that this reaction is feasible and can go in the end. Meanwhile, both the Ag+-linked and unlinked Fe NPs are activated since graphene could help transfer electrons from Fe to Ag+ for the unlinked Fe.28 As a result, high dispersed Ag NPs are anchored on graphene in spite that Fe NPs distribution are not very uniform.| Fe + 2Ag+ = 2Ag + Fe2+ | (1) |
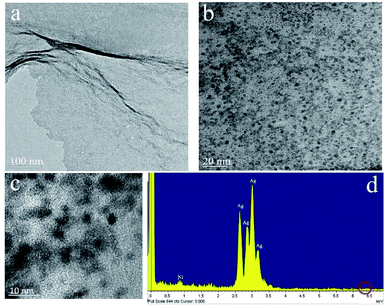
As seen from the TEM image at different magnifications of Fig. 2, the well dispersed Ag NPs with small sizes are anchored onto graphene sheets, and the average size of Ag NPs is about 3 nm. The energy dispersive energy dispersive spectrometer (EDS) analysis of confirms the nanostructure contains Ag and C elements. A small amount of Ni is also detected, which results from carbon-coated nick grids used during testing samples. Besides, the signal peak of Fe at 6.398 keV is invisible, which means that Fe is removed thorough from the displacement reaction of Ag+ and Fe mostly.
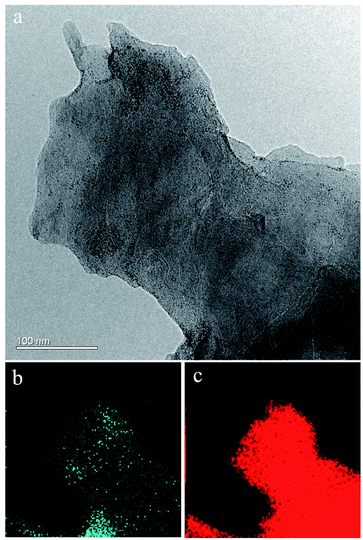
Fig. 3 shows the results of TEM examination together with EDS mapping for both C and Ag elements. The blue-green and red regions relative to the Ag and C elements, respectively, indicating that Ag nanoparticles are distributed uniformly throughout the whole area of C. The uniform distribution of Ag nanoparticles in graphene is attributed to the in situ synthesis of Ag/graphene, as described in the experimental part.
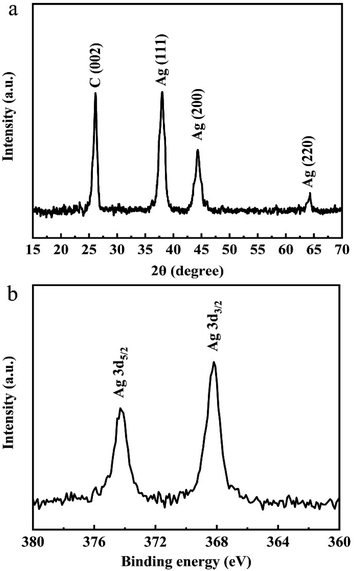
Furthermore, Fig. 4a shows the XRD diffraction pattern of Ag/graphene. The diffraction peak located at 2θ = 26.2° can be observed, which corresponds to (002) crystal planes of graphite. Meanwhile, the XRD pattern still has peaks at 2θ = 38.0°, 44.3°, and 64.3°, corresponding to the (111), (200), and (220) planes of metal Ag, respectively.29 This result is consistent with the high resolution TEM image (Fig. 2) of the hybrid sample. The XPS pattern of the as-prepared Ag/graphene is shown in Fig. 4b. The two individual peaks at 379.1 and 368.2 eV correspond to the 3d5/2 and 3d3/2 binding energies of Ag, respectively.30
In addition, to further confirm whether the Fe is replaced by Ag completely, the intensity of Fe is also presented in Fig. S1.† From the barely formed peak of XPS curve for Fe as shown in Fig. S1,† we can conclude that Fe is almost replaced as proposed. Also, as shown in Fig. S2,† the signal peak from oxygen is very weak, and the ratio of O/C is about 0.05, which indicates that the content of oxygen is low. To be clear, the existing small amount of oxygen may be attributed to the adsorption of oxygen on the surface of graphene.
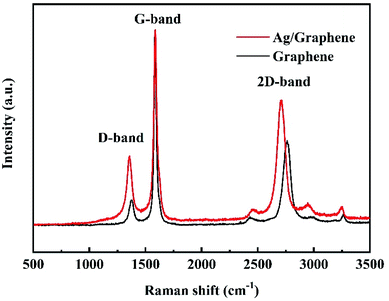
Raman is powerful tool to confirm the doping of graphene sheets with Ag NPs.31 As shown in Fig. 5, three differences can be observed through comparing the Raman spectra of graphene and Ag/graphene samples. First, the value of ID/IG increases from 0.16 for graphene to 0.30 for Ag/graphene, which can be explained as the action of silver on carbon change the structure of graphene, leading to a disordered structure after Ag decorating on graphene.32 Meanwhile, the low ID/IG value of graphene verifies that the sample is graphene rather than graphene oxides (GO) since the ratio of ID/IG for GO is close to 1.0.33 Second, the 2D band shifts from 2762 cm−1 to 2711 cm−1, and the G band shifts from 1585 cm−1 to 1588 cm−1 for graphene and Ag/graphene, respectively. This can be attributed to the influence of electron properties during the double resonance process,34,35 and indicates n-doping of graphene with Ag deposition.36 Third, all the density of D-, 2D-, and G-peaks increase greatly for Ag/graphene, which is mainly due to the strong interaction between Ag and graphene.36 These characterization results confirm that the formation of Ag NPs onto graphene sheets.
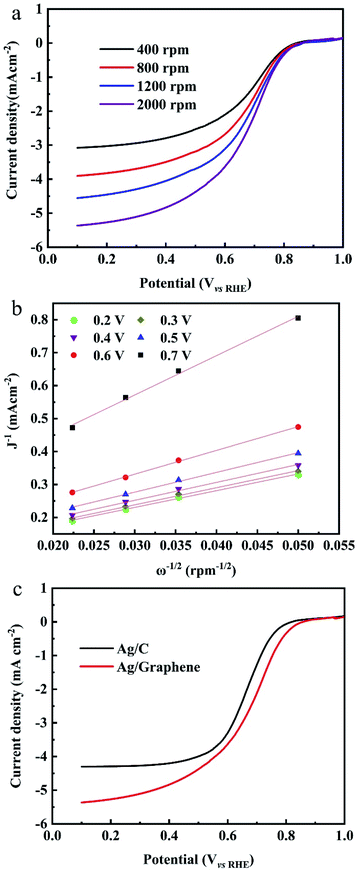
The ORR measurements are evaluated in O2-saturated 0.1 M KOH electrolyte at room temperature. The RDE polarization curves of ORR on Ag/graphene catalysts is shown in Fig. 6a. The onset potential (Eon) of the ORR is 0.83 V vs. RHE37 and then the reduction current rises rapidly to its diffusion ultimate value. The RDE polarization curves of ORR were calculated by the Koutecky–Levich (K–L) equation:38
![[thin space (1/6-em)]](https://www.rsc.org/images/entities/char_2009.gif) 485 C mol−1), ω represents the electrode rotation rate, ν is on behalf of the kinematic viscosity of the solution (0.01 cm2 s−1), CO2b is the concentration of oxygen in the bulk (1.2 × 10⁻⁶ mol cm−3), and DO2 is the diffusion coefficient of oxygen (1.9 × 10⁻⁵ cm2 s−1).39 Fig. 6b shows the K–L plots and the n values were calculated from the K–L equation. The average electron number transferred per O2 molecule is close to four based on the K–L plots. Fig. 6c shows the j–E curves of ORR on different catalysts at a single rotation rate (ω = 2000 rpm). It is found that the onset potentials for Ag/graphene shows a positive shift of approximately 40 mV when compared with Ag/C catalyst (0.79 V vs. RHE) with same mass loading with Ag/graphene (18%, shown in Fig. S3†). Also the value of E1/2 is larger for the latter catalyst. We compared the ORR performance of Ag/graphene catalyst with the published Ag/C electrocatalysts, as shown in Table 1, which indicates that our Ag/graphene exhibits better ORR performance. The superior catalytic activity of the Ag/graphene electrode at the diffusion controlled and kinetic regions can be related to the small size and uniform dispersion of Ag NPs on the graphene surface. Because the homogeneous Fe phase is formed during the formation of graphene, the galvanic displacement reaction between Fe and Ag+ ions will result in better dispersion and small size of Ag NPs on the graphene, tending to increase of the electrochemically active surface area of Ag. Also, no intervene of any stabilizers or surfactants were added through the whole synthesis process, which greatly enhanced the electrocatalytic performance of Ag NPs.
485 C mol−1), ω represents the electrode rotation rate, ν is on behalf of the kinematic viscosity of the solution (0.01 cm2 s−1), CO2b is the concentration of oxygen in the bulk (1.2 × 10⁻⁶ mol cm−3), and DO2 is the diffusion coefficient of oxygen (1.9 × 10⁻⁵ cm2 s−1).39 Fig. 6b shows the K–L plots and the n values were calculated from the K–L equation. The average electron number transferred per O2 molecule is close to four based on the K–L plots. Fig. 6c shows the j–E curves of ORR on different catalysts at a single rotation rate (ω = 2000 rpm). It is found that the onset potentials for Ag/graphene shows a positive shift of approximately 40 mV when compared with Ag/C catalyst (0.79 V vs. RHE) with same mass loading with Ag/graphene (18%, shown in Fig. S3†). Also the value of E1/2 is larger for the latter catalyst. We compared the ORR performance of Ag/graphene catalyst with the published Ag/C electrocatalysts, as shown in Table 1, which indicates that our Ag/graphene exhibits better ORR performance. The superior catalytic activity of the Ag/graphene electrode at the diffusion controlled and kinetic regions can be related to the small size and uniform dispersion of Ag NPs on the graphene surface. Because the homogeneous Fe phase is formed during the formation of graphene, the galvanic displacement reaction between Fe and Ag+ ions will result in better dispersion and small size of Ag NPs on the graphene, tending to increase of the electrochemically active surface area of Ag. Also, no intervene of any stabilizers or surfactants were added through the whole synthesis process, which greatly enhanced the electrocatalytic performance of Ag NPs.
4. Conclusions
In summary, we have prepared small sized and well dispersed graphene-supported Ag catalyst from disposable paper-cups via an environmentally friendly and simple etching template method. The resulting Ag/graphene catalyst exhibits a much higher catalytic activity for the ORR than the Ag/C synthesized by the conventional method. This synthesis route provides a novel and effective method to prepare nanoparticle Ag anchored on graphene. The proposed synthesis strategy is a facile, powerful, and low-cost route for synthesizing the fuel cell catalysts.Conflicts of interest
There are no conflicts to declare.Acknowledgements
This work is supported by National Natural Science Foundation of China (Grant No. 51702040), Sichuan Province Science and Technology Support Program (Grant No. 20YYJC4163), the Key Project of Department of Education of Guangdong Province (2016GCZX008), and Guangdong Provincial Key Laboratory of Energy Materials for Electric Power (No. 2018B030322001).References
- J. Yang and N. Nakashima, Nanocarbons for Energy Conversion: Supramolecular Approaches, 2019, pp. 277–293 Search PubMed.
- A. Safakas, G. Bampos and S. Bebelis, Appl. Catal., B, 2019, 224, 225–232 CrossRef.
- V. Galvan, D. E. Glass, A. F. Baxter and G. K. S. Prakash, ACS Appl. Energy Mater., 2019, 2(10), 7104–7111 CrossRef CAS.
- V. M. Truong, M. K. Yang and H. Yang, Int. J. Precis. Eng. Manuf., 2019, 6(4), 711–721 CrossRef.
- D. Liu, S. Q. Lu, Y. R. Xue, Z. Guan, J. J. Fang, W. Zhu and Z. B. Zhuang, Nano Energy, 2019, 59, 26–32 CrossRef CAS.
- Y. Yang, H. Q. Peng, Y. Xiong, Q. H. Li, J. T. Lu, L. Xiao, F. J. DiSalvo, L. Zhuang and H. D. Abruna, ACS Energy Lett., 2019, 4, 1251–1257 CrossRef CAS.
- A. C. Garcia, L. H. S. Gasparotto, J. F. Gomes and G. Tremiliosi-Filho, Electrocatalysis, 2012, 3, 147–152 CrossRef CAS.
- X. Wu, F. Chen, Y. Jin, N. Zhang and R. L. Johnston, ACS Appl. Mater. Interfaces, 2015, 7(32), 17782–17791 CrossRef CAS PubMed.
- V. M. Truong, M. K. Yang and H. Yang, Int. J. Precis. Eng. Manuf., 2019, 6, 711–721 CrossRef.
- J. M. Linge, H. Erikson, M. Merisalu, L. Matisen, M. Käärik, J. Leis, V. Sammelselg, J. Aruväli, T. Kaljuvee and K. Tammeveski, J. Electrochem. Soc., 2018, 165(14), F1199–F1205 CrossRef CAS.
- J. M. Linge, H. Erikson, J. Kozlova, V. Sammelselg and K. Tammeveski, J. Electroanal. Chem., 2018, 810, 129–134 CrossRef CAS.
- H. Erikson, A. Sarapuu and K. Tammeveski, Chemelectrochem, 2019, 6(1), 73–86 CrossRef CAS.
- F. Li, W. Kang, B. Cheng and Y. Dong, Catal. Commun., 2015, 69(5), 150–153 CrossRef CAS.
- L. Demarconnay, C. Coutanceau and J. M. Léger, Electrochim. Acta, 2004, 49, 4513–4521 CrossRef CAS.
- Y. Chen, X. Zhang, H. Zhang, X. Sun, D. Zhang and Y. Ma, RSC Adv., 2012, 2, 7747–7753 RSC.
- Z. Yang, J. Tian, Z. Yin, C. Cui, W. Qian and F. Wei, Carbon, 2019, 141, 467–480 CrossRef CAS.
- Y. Yang, C. Han, B. Jiang, J. Iocozzia, C. He, D. Shi, T. Jiang and Z. Lin, Mater. Sci. Eng., R, 2016, 102, 1–72 CrossRef.
- A. K. Singh, M. W. Iqbal, V. K. Singh, M. Z. Iqbal, J. H. Lee, S.-H. Chun, K. Shin and J. Eom, J. Mater. Chem., 2012, 22, 15168–15174 RSC.
- J. Plutnar, M. Pumera and Z. Sofer, J. Mater. Chem. C, 2018, 6, 6082–6101 RSC.
- S. Hussain, M. W. Iqbal, J. Park, M. Ahmad, J. Singh, J. Eom and J. Jung, Nanoscale Res. Lett., 2014, 9, 546 CrossRef PubMed.
- J. Zeng, X. Ji, Y. Ma, Z. Zhang, S. Wang, Z. Ren, C. Zhi and J. Yu, Adv. Mater., 2018, 30(12), 1705380 CrossRef PubMed.
- T. Xu, Z. Zhang and L. Qu, Adv. Mater., 2019, 1901979 Search PubMed.
- N. Raghavan, S. Thangavel and G. Venugopal, Applied Materials Today, 2017, 7, 246–254 CrossRef.
- H. Zhao, J. Yang, L. Wang, C. Tian, B. Jiang and H. G. Fu, Chem. Commun., 2011, 47, 2014–2016 RSC.
- H. Zhao, C. Su, K. N. Hui and K. S. Hui, J. Electrochem. Soc., 2017, 164(4), F412–F417 CrossRef CAS.
- J. Guo, A. Hsu, D. Chu and R. Chen, J. Phys. Chem. C, 2010, 114, 4324–4433 CrossRef CAS.
- L. Wang, C. Tian, H. Wang, Y. Ma, B. Wang and H. G. Fu, J. Phys. Chem. C, 2010, 114, 8727–8733 CrossRef CAS.
- I. V. Lightcap, T. H. Kosel and P. V. Kamat, Nano Lett., 2010, 10, 577–583 CrossRef CAS PubMed.
- H. Zhao, H. G. Fu, Ch. Tian, Z. Ren and G. Tian, J. Colloid Interface Sci., 2010, 351(2), 343–347 CrossRef CAS PubMed.
- D. Ji, Y. Wang, S. Chen, Y. Zhang, L. Li, W. Ding and Z. Wei, J. Solid State Electrochem., 2018, 22, 2287–2296 CrossRef CAS.
- D. M. Basko, S. Piscanec and A. C. Ferrari, Phys. Rev. B, 2009, 80, 165413 CrossRef.
- A. Das, S. Pisana, B. Chakraborty, S. Piscanec, S. K. Saha, U. V. Waghmare, K. S. Novoselov, H. R. Krishnamurthy, A. K. Geim, A. C. Ferrarl and A. K. Sood, Nat. Nanotechnol., 2008, 3, 210–215 CrossRef CAS PubMed.
- S.-G. Kim, O.-K. Park, J. H. Lee and B.-C. Ku, Carbon Letters, 2013, 14, 247–250 CrossRef.
- A. C. Ferrari and J. Robertson, Phys. Rev. B: Condens. Matter Mater. Phys., 2000, 61, 14095 CrossRef CAS.
- S. Pisana, M. Lazzeri, C. Casiraghi, K. S. Novoselov, A. K. Geim, A. C. Ferrari and F. Mauri, Nat. Mater., 2007, 6, 198–201 CrossRef CAS PubMed.
- J. Lee, K. S. Novoselov and H. S. Shin, ACS Nano, 2011, 5, 608–612 CrossRef CAS PubMed.
- C. Wang, S. Zhang, M. Zheng, R. Shu, S. Gu, J. Guo, C. Liu, J. Tang, J. Chen and X. Wang, Int. J. Hydrogen Energy, 2020, 45(11), 6994–7004 CrossRef.
- Y. Ren, Z. Ren, J. Li, S. Wang and J. Yu, RSC Adv., 2015, 5, 106439–106443 RSC.
- J. M. Linge, H. Erikson, J. Kozlova, J. Aruväli, V. Sammelselg and K. Tammeveski, J. Solid State Electrochem., 2018, 22, 81–89 CrossRef CAS.
- A. C. Garcia, L. H. S. Gasparotto, J. F. Gomes and G. Tremiliosi-Filho, Electrocatalysis, 2012, 3(2), 147–152 CrossRef CAS.
- M. A. Hernández-Rodríguez, M. C. Goya, M. C. Arévalo, J. L. Rodríguez and E. Pastor, Int. J. Hydrogen Energy, 2016, 41, 19789–19798 CrossRef.
- M. Innocenti, C. Zafferoni, A. Lavacchi, L. Becucci, F. D. Benedetto, E. Carretti, F. Vizza and M. L. Foresti, J. Electrochem. Soc., 2014, 161(7), D3018–D3024 CrossRef CAS.
- Q. Hong and H. Lu, Sci. Rep., 2017, 7, 3378 CrossRef PubMed.
Footnote |
| † Electronic supplementary information (ESI) available. See DOI: 10.1039/d0ra02127j |
| This journal is © The Royal Society of Chemistry 2020 |


