 Open Access Article
A pH tuning single fluorescent probe based on naphthalene for dual-analytes (Mg2+ and Al3+) and its application in cell imaging†
Chunwei Yua,
Shuhua Cuib,
Yuxiang Jia,
Shaobai Wena,
Li Jiana and
Jun Zhang *ac
*ac
aLaboratory of Environmental Monitoring, School of Tropical and Laboratory Medicine, Hainan Medical University, Haikou, Hainan 571101, P. R. China. E-mail: jun_zh1979@163.com
bWeifang University of Science and Technology, Shouguang, Shandong 262700, P. R. China
cKey Laboratory of Tropical Translalional Medicine of Ministry of Education, School of Tropical Medicine and Laboratory Medicine, Hainan Medical University, Haikou, Hainan 571199, P. R. China
First published on 5th June 2020
Abstract
In this study, a naphthalene Schiff-base P which serves as a dual-analyte probe for the quantitative detection of Al3+ and Mg2+ has been designed. The proposed probe showed an ‘‘off–on’’ fluorescent response toward Al3+ in ethanol–water solution (1![[thin space (1/6-em)]](https://www.rsc.org/images/entities/char_2009.gif) :
:![[thin space (1/6-em)]](https://www.rsc.org/images/entities/char_2009.gif) 9, v/v, pH 6.3, 20 mM HEPES) over other metal ions and anions, while the detection by the probe could be switched to Mg2+ by regulating the pH from 6.3 to 9.4. The sensing mechanisms of P to Al3+/Mg2+ are attributed to inhibition of the photo-induced electron transfer (PET) process by the formation of 1
9, v/v, pH 6.3, 20 mM HEPES) over other metal ions and anions, while the detection by the probe could be switched to Mg2+ by regulating the pH from 6.3 to 9.4. The sensing mechanisms of P to Al3+/Mg2+ are attributed to inhibition of the photo-induced electron transfer (PET) process by the formation of 1![[thin space (1/6-em)]](https://www.rsc.org/images/entities/char_2009.gif) :
:![[thin space (1/6-em)]](https://www.rsc.org/images/entities/char_2009.gif) 1 ligand–metal complexes. More importantly, the probe was applied successfully in living cells for the fluorescent cell-imaging of Al3+ and Mg2+.
1 ligand–metal complexes. More importantly, the probe was applied successfully in living cells for the fluorescent cell-imaging of Al3+ and Mg2+.
1 Introduction
The detection of trace metal ions is becoming an important concern due to their assignable functions in biological systems and deleterious effects on public health.1 Among these metals, Mg2+ is an essential micronutrient element for human life, participating in gene transcription and neural signal transmission.2 It also plays important roles in enzymes and DNA-binding proteins.3 However, overloading of magnesium in the cytosol and subcellular regions exhibits toxicity and is linked with diseases such as diabetes, hypertension, epilepsy and Alzheimer's.4 As another highly chemical reactive metal ion, Al3+ is a non-essential element for living systems and of significant environmental concern: an overdose of Al3+ can damage the central nervous system and produce some neurobehavioral and neuro-pathological changes.5 In order to protect human health, the development of effective tools for the detection of Al3+ and Mg2+ is of a great importance.In recent years, molecular fluorescence probes with simple handling, real-time response, high sensitivity and selectivity, and non-destructive properties have undoubtedly been powerful detection tools.6 Compared to several transition metal ions, such as Hg2+, Cu2+ and Zn2+, only a few fluorescent probes have been developed for the detection of Mg2+ or Al3+ due to their silent spectroscopic characteristics and poor coordination ability.7 In particular, most of these reported probes focus on the detection of single metal ions,8 so it will be complicated and inconvenient to analyse some coexisting metal ions based on different detection methods and/or experimental conditions. For these reasons, much attention has been paid to single probes for multiple analysis and they have been widely applied in metal detection because they could determinate more than one interesting ion, simultaneously. Some multi-target probes such as Cr3+/Al3+,9 Bi3+/Zn2+,10 Zn2+/Mg2+,11 and Cu2+/Al3+ have been developed,12 but multi-ion responsive molecular fluorescence probes which sense Al3+/Mg2+ have rarely been reported. More problematically, the ionic radius and charge of Al3+ make it a competitive inhibitor of Mg2+ in the human body. In this regard, the design of reliable and sensitive multi-target probes for Mg2+ and Al3+ is highly desirable.
Schiff bases can coordinate with various metal ions and form stable complexes which are known to be good ligands for metal ions.13 Beyond this, naphthalene derivatives are excellent fluorophores that usually serve as signal reporters in probes because of their short fluorescence life-time, low fluorescence quantum yields, and ability to act as a donor or an acceptor.14 Meanwhile, benzoyl hydrazine derivatives are recognized as important motifs for use as ligands in coordination chemistry.15 Moreover, based on the special advantage of turn-on fluorescent probes in reducing system errors and background interference,16 we aimed to develop a novel turn-on fluorescent probe combining different recognition groups in one molecule, which was expected to multi-channelly detect Al3+ and Mg2+ with different turn-on fluorescent responses.
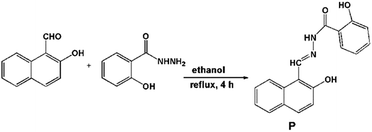
In this work, a fluorescent probe (P) based on a Schiff base combining naphthalene and benzoyl hydrazine was proposed (Scheme 1). P can be utilized as a multi-ion fluorescent probe by regulating pH: it showed ‘‘off–on’’ fluorescent response toward Al3+ in ethanol–water solution (v/v, 1![[thin space (1/6-em)]](https://www.rsc.org/images/entities/char_2009.gif) :
:![[thin space (1/6-em)]](https://www.rsc.org/images/entities/char_2009.gif) 9, pH 6.3, 20 mM HEPES) and Mg2+ in ethanol–water solution (v/v, 1
9, pH 6.3, 20 mM HEPES) and Mg2+ in ethanol–water solution (v/v, 1![[thin space (1/6-em)]](https://www.rsc.org/images/entities/char_2009.gif) :
:![[thin space (1/6-em)]](https://www.rsc.org/images/entities/char_2009.gif) 9, pH 9.4, 20 mM HEPES). More importantly, the probe could be used for cell imaging of Al3+ and Mg2+ in vivo with negligible cytotoxicity.
9, pH 9.4, 20 mM HEPES). More importantly, the probe could be used for cell imaging of Al3+ and Mg2+ in vivo with negligible cytotoxicity.
2 Experimental section
All reagents and solvents are commercially available and used directly. All reagents and solvents are of analytical grade and used without further purification. The metal ions salts used were NaCl, KCl, CaCl2·2H2O, MgCl2·6H2O, HgCl2, Zn(NO3)2·6H2O, PbCl2, CdCl2, CrCl3·6H2O, AgNO3, CoCl2·6H2O, NiCl2·6H2O, CuCl2·2H2O, FeCl3·6H2O, FeCl2·4H2O and AlCl3·6H2O.Fluorescence emission spectra were conducted on a Hitachi F-4600 spectrofluorometer. UV-vis spectra were obtained on a Hitachi U-2910 spectrophotometer. Nuclear magnetic resonance (NMR) spectra were measured with a Brucker AV 400 instrument and chemical shifts were given in ppm from tetramethylsilane (TMS). Mass (MS) spectra were recorded on a Thermo TSQ Quantum Access Agilent 1100. Fluorescence imaging was performed by confocal fluorescence microscopy on an Olympus FluoView Fv1000 laser scanning microscope (USA). pH values were measured with a pH-meter PBS-3C (Shanghai, China).
2.1 Synthesis of P
2-Hydroxy-1-naphthaldehyde (0.172 g, 1.0 mmol) and salicylhydrazide (0.152 g, 1.0 mmol) were mixed in ethanol (30 mL) and stirred under reflux for 4 h. After the reaction was finished, the mixture was cooled to room temperature and poured into cold water. The precipitate so obtained was filtered and washed with ethanol and water in turn, and then dried in a vacuum to afford P as a yellow solid. Yields: 85.6%. MS m/z: 307.24 [M + H]+, 329.21 [M + Na]+. 1H NMR (δppm, d6-DMSO): 12.10 (s, 1H), 11.72 (b, 1H), 9.55 (s, 1H), 8.32 (d, 1H, J = 6.00), 7.94 (t, 2H, J = 6.00), 7.91 (t, 1H, J = 12.00), 7.61 (s, 1H), 7.48 (s, 1H), 7.42 (s, 1H), 7.24 (d, 1H, J = 6.00), 7.03 (d, 2H, J = 12.00), 7.01 (s, 1H). 13C NMR (δppm, d6-DMSO): 164.90, 159.69, 159.07, 148.61, 134.95, 133.85, 132.62, 129.86, 129.71, 128.75, 128.67, 124.49, 121.91, 120.08, 119.82, 118.23, 116.65, 109.53 (Fig. S1–S3, ESI†).2.2 General spectroscopic methods
Metal ions and P were dissolved in deionized water and DMSO to obtain 1.0 mM stock solutions. Before spectroscopic measurements, the solution was freshly prepared by diluting the high concentration stock solution to the corresponding solution. For all measurements, excitation and emission slit widths were 5/5 and 5/10 nm, and excitation wavelengths were 408 and 415 nm for Mg2+ and Al3+, respectively.2.3 Cell culture
HepG2 cells were purchased from the Committee on Type Culture Collection of Chinese Academy of Sciences (Shanghai, China). HepG2 cells were incubated in DMEM (Dulbecco's Modified Eagle's Medium) supplemented with 10% fetal bovine serum (FBS).2.4 Cell imaging
For imaging experiments, cells were grown in 6-well plates at 70–80% confluence. Cells were then incubated in DMEM containing 10 μM P for 30 min at 37 °C. Cells were then washed with PBS followed by the addition of 1 μM Al3+ and Mg2+ and incubated for 30 min. Bright field and fluorescence images were captured by a florescence microscope (Olympus FluoView Fv1000).2.5 Cell cytotoxicity assay
To assess the cytotoxicity of P, cytotoxicity was measured by using the methyl thiazolyl tetrazolium (MTT) assay in HepG2 cells. HepG2 cells were seeded into a 96-well cell culture plate at 4000/well, cultured at 37 °C and 5% CO2 for 24 h, and then different concentrations of P (0, 0.1, 1.0, 10.0 μM) were added to the wells. The cells were then incubated for 24 h at 37 °C under 5% CO2. Subsequently, 20 μL of MTT (5 mg mL−1) was added to each well and incubated for an additional 4 h at 37 °C under 5% CO2. Cells were lysed in triple liquid (10% SDS, 0.012 M HCl, 5% isopropanol), and the amount of MTT formazan was qualified by determining the absorbance at 570 nm using a microplate reader (Tecan, Austria).The following formula was used to calculate the inhibition of cell growth: cell viability (%) = (mean of Abs. value of treatment group/mean Abs. value of control) × 100%.
3 Results and discussion
3.1 Fluorescence study
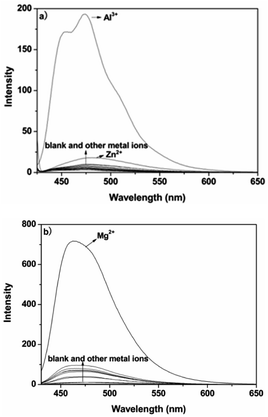
A pH titration experiment was first evaluated, as shown in Fig. S4 (ESI†), from the experimental results, the fluorescence from the free P could be seen to be negligible in the pH range from 4.0 to 10.0, suggesting that it was not susceptible to the change in acid–base solution. The fluorescence of the P–Al3+ complex displayed a plateau in the pH range from 4.0 to 6.5, and the maximum response toward Al3+ was obtained under pH 6.3. From the point of view of sensitivity and speed, in our experiment, pH 6.3 was chosen as the optimum experimental condition for environmental examples. The host–guest recognition abilities of P with Al3+ and Mg2+ were investigated via a fluorescence spectroscopic method. As shown in Fig. 1a, free P showed weak fluorescence emission at 475 nm when it was excited at 425 nm in ethanol–water (v/v, 1![[thin space (1/6-em)]](https://www.rsc.org/images/entities/char_2009.gif) :
:![[thin space (1/6-em)]](https://www.rsc.org/images/entities/char_2009.gif) 9, pH 6.3, 20 mM HEPES). Only upon the addition of Al3+ did the fluorescence intensity of P show a significant fluorescence enhancement at 475 nm over other relevant metal ions (Na+, K+, Ca2+, Mg2+, Pb2+, Cr3+, Mn2+, Fe2+, Fe3+, Co2+, Ni2+, Cu2+, Zn2+, Cd2+ and Hg2+). The results suggested that probe P, with predominant recognition and selectivity, shows good potential in the detection of Al3+. More interestingly, when the pH was adjusted to 9.4 (Fig. S5, ESI†), the metal ion switched to Mg2+. The probe did not give any observable response in the absence or presence of various other metal ions, and the blue shift of the emission band at 460 nm was accompanied by a 49-fold fluorescence enhancement for Mg2+, as depicted in Fig. 1b.
9, pH 6.3, 20 mM HEPES). Only upon the addition of Al3+ did the fluorescence intensity of P show a significant fluorescence enhancement at 475 nm over other relevant metal ions (Na+, K+, Ca2+, Mg2+, Pb2+, Cr3+, Mn2+, Fe2+, Fe3+, Co2+, Ni2+, Cu2+, Zn2+, Cd2+ and Hg2+). The results suggested that probe P, with predominant recognition and selectivity, shows good potential in the detection of Al3+. More interestingly, when the pH was adjusted to 9.4 (Fig. S5, ESI†), the metal ion switched to Mg2+. The probe did not give any observable response in the absence or presence of various other metal ions, and the blue shift of the emission band at 460 nm was accompanied by a 49-fold fluorescence enhancement for Mg2+, as depicted in Fig. 1b.
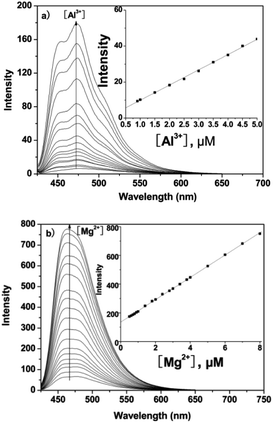
Under physiological conditions, the emission of probe P (10 μM) around 475 nm is very low. However, upon gradual addition of Al3+ or Mg2+ there was a remarkable enhancement in fluorescence at 475 nm for Al3+ or 460 nm for Mg2+ with an increasing concentration (0–10 μM) of the metal ion (Fig. 2). The plots of emission intensity of P as a function of added Al3+ and Mg2+ are presented in insets to Fig. 2a and b, respectively. Additionally, from the fluorescence titration profiles, the detection limit of P for Al3+/Mg2+ was found to be 0.3 μM/0.2 μM (based on S/N = 3, inset of Fig. 2), which was sufficiently low to enable the detection of micromolar concentrations of Al3+/Mg2+ in many chemical and biological systems.
3.2 UV-vis analysis
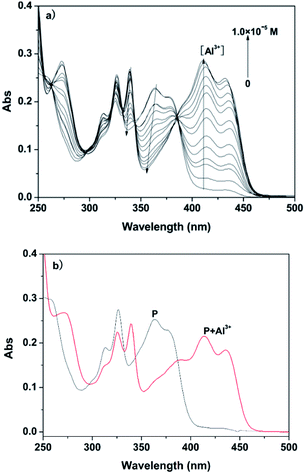
With the objective of evaluating the potential use of the probe P, UV-vis analysis upon addition of Al3+/Mg2+ was further evaluated. Firstly, the interaction of P and Al3+ was investigated as a function of the concentration of Al3+, as shown in Fig. 3.The spectrum of free P showed a maximum absorption band at 350 nm in ethanol–water solution (1![[thin space (1/6-em)]](https://www.rsc.org/images/entities/char_2009.gif) :
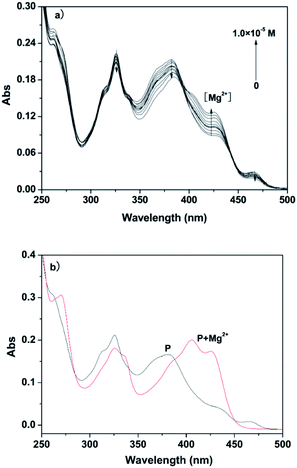
:![[thin space (1/6-em)]](https://www.rsc.org/images/entities/char_2009.gif) 9, v/v, 20 mM HEPES, pH 6.3), which can be assigned to the π–π* transition of the benzoyl hydrazine group.15 With increasing concentration of Al3+, the absorption bands at 325 nm and 375 nm gradually decreased, and simultaneously a new band appeared at 425 nm with increased intensity. Moreover, a clear isosbestic point at 380 nm was observed, which clearly indicated the presence of new complex P–Al3+. In contrast, when the UV-vis analysis was carried out in ethanol–water solution (1
9, v/v, 20 mM HEPES, pH 6.3), which can be assigned to the π–π* transition of the benzoyl hydrazine group.15 With increasing concentration of Al3+, the absorption bands at 325 nm and 375 nm gradually decreased, and simultaneously a new band appeared at 425 nm with increased intensity. Moreover, a clear isosbestic point at 380 nm was observed, which clearly indicated the presence of new complex P–Al3+. In contrast, when the UV-vis analysis was carried out in ethanol–water solution (1![[thin space (1/6-em)]](https://www.rsc.org/images/entities/char_2009.gif) :
:![[thin space (1/6-em)]](https://www.rsc.org/images/entities/char_2009.gif) 9, v/v, pH 9.4, 20 mM HEPES), the metal ion was also changed from Al3+ to Mg2+, as shown in Fig. 4. The trend in the change in the absorption spectrum of the latter was similar to the former; the only difference was the extent of variation of the absorption at 425 nm. Absorption spectra confirmed the binding ability of P and Mg2+/Al3+.
9, v/v, pH 9.4, 20 mM HEPES), the metal ion was also changed from Al3+ to Mg2+, as shown in Fig. 4. The trend in the change in the absorption spectrum of the latter was similar to the former; the only difference was the extent of variation of the absorption at 425 nm. Absorption spectra confirmed the binding ability of P and Mg2+/Al3+.
3.3 Practical applicability of P
In order to evaluate the practical applicability of P as a selective multi-analyst fluorescent probe for Al3+/Mg2+, competition experiments were conducted (Fig. S6 and S7, ESI†). It could be seen that other competitive ions had no obvious interference with the detection of Al3+/Mg2+ under different pH conditions, which could be attributed to their inherent magnetic properties. Meanwhile, reversibility was investigated which is a prerequisite in developing a fluorescent probe for practical applications. The reversibility of P was studied by adding Na2EDTA as a bonding agent (Fig. S8 and S9, ESI†). The addition of Na2EDTA to a mixture of P and Al3+/Mg2+ caused a diminution in the fluorescence intensity at 475/460 nm, which may produce the free probe P. Upon the addition of Al3+/Mg2+, the fluorescence intensity of P displayed a significant fluorescence enhancement again, which proved the binding between P and Al3+/Mg2+ was reversible.3.4 Proposed binding mode of P with Al3+/Mg2+
In order to understand the binding mode of P and Al3+/Mg2+, the Job's plot of P and Al3+/Mg2+ was conducted (Fig. 5). When the molar fraction of P and Al3+/Mg2+ was 0.5, P with Al3+/Mg2+ exhibited maximum fluorescence emission. The results showed that P and Al3+/Mg2+ formed 1![[thin space (1/6-em)]](https://www.rsc.org/images/entities/char_2009.gif) :
:![[thin space (1/6-em)]](https://www.rsc.org/images/entities/char_2009.gif) 1 ligand–metal complexes. Furthermore, the ESI-MS spectra also confirmed this conclusion (Fig. S10 and S11, ESI†), in which the peaks at m/z 331.0, 366.7, 376.7, 413.2, and 423.2 were assignable to [P + Al3+ − 2H+]+, [P + Al3+ + Cl− − H+]+, [P + Al3+ + EtOH − 2H+]+, [P + Al3+ + Cl− + EtOH − 2H+]+, and [P + Al3+ + 2EOH − 2H+]+, respectively. The peaks at m/z 328.7, 365.1, 347.1, 375.1, and 438.8 were assignable to [P + Mg2+ − H+]+, [P + Mg2+ + Cl−]+, [P + Mg2+ + OH−]+, [P + Mg2+ + EtOH − H+]+, and [P + Mg2+ + 2EtOH + OH−]+, respectively. As expected, the results indicated that complexes with a stoichiometry of Al3+/Mg2+ to P of 1
1 ligand–metal complexes. Furthermore, the ESI-MS spectra also confirmed this conclusion (Fig. S10 and S11, ESI†), in which the peaks at m/z 331.0, 366.7, 376.7, 413.2, and 423.2 were assignable to [P + Al3+ − 2H+]+, [P + Al3+ + Cl− − H+]+, [P + Al3+ + EtOH − 2H+]+, [P + Al3+ + Cl− + EtOH − 2H+]+, and [P + Al3+ + 2EOH − 2H+]+, respectively. The peaks at m/z 328.7, 365.1, 347.1, 375.1, and 438.8 were assignable to [P + Mg2+ − H+]+, [P + Mg2+ + Cl−]+, [P + Mg2+ + OH−]+, [P + Mg2+ + EtOH − H+]+, and [P + Mg2+ + 2EtOH + OH−]+, respectively. As expected, the results indicated that complexes with a stoichiometry of Al3+/Mg2+ to P of 1![[thin space (1/6-em)]](https://www.rsc.org/images/entities/char_2009.gif) :
:![[thin space (1/6-em)]](https://www.rsc.org/images/entities/char_2009.gif) 1 were formed, and the results were also supported by the Benesi–Hildebrand method.15 The Benesi–Hildebrand analysis of the emission data gives a 1
1 were formed, and the results were also supported by the Benesi–Hildebrand method.15 The Benesi–Hildebrand analysis of the emission data gives a 1![[thin space (1/6-em)]](https://www.rsc.org/images/entities/char_2009.gif) :
:![[thin space (1/6-em)]](https://www.rsc.org/images/entities/char_2009.gif) 1 stoichiometry for P–Al3+ and P–Mg2+ complexation species, with association constants (Ka) being calculated as 2.9 × 10⁴ M−1 and 2.1 × 10⁵ M−1 (Fig. S12 and S13, ESI†), corresponding to a stronger binding capability toward Al3+ in comparison with a naphthalene-based PET chemosensor for Al3+ (with a K value of 5.1 × 10³ M−1),16a and a rhodamine spirolactam derivative-based chemosensor for Mg2+ (with a K value of 2.55 × 10⁴ M−1).16b
1 stoichiometry for P–Al3+ and P–Mg2+ complexation species, with association constants (Ka) being calculated as 2.9 × 10⁴ M−1 and 2.1 × 10⁵ M−1 (Fig. S12 and S13, ESI†), corresponding to a stronger binding capability toward Al3+ in comparison with a naphthalene-based PET chemosensor for Al3+ (with a K value of 5.1 × 10³ M−1),16a and a rhodamine spirolactam derivative-based chemosensor for Mg2+ (with a K value of 2.55 × 10⁴ M−1).16b
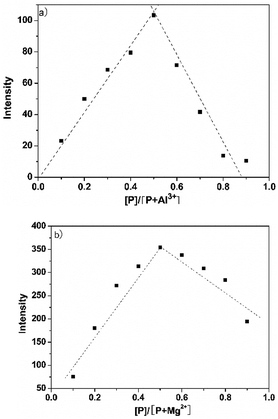 | ||
| Fig. 5 Job's plot for determining the stoichiometry of P and (a) Al3+ and (b) Mg2+. The total concentration was kept at 50 μM. | ||
3.5 Proposed mechanism of P with Al3+/Mg2+
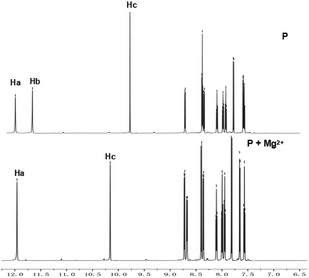
According to reported work,15a,17 probes with only OHa show good selectivity to Al3+. Based on the soft–hard acid–base theory, Al3+ shows affinity to groups with O sites. In order to design probes with better selectivity and sensitivity to Al3+, P with two OH groups was proposed in this work. As mentioned above, the proposed probe still has good selectivity to Al3+ at pH 6.3, and meanwhile shows good selectivity to Mg2+ at pH 9.4. To evaluate the binding pattern between P and Mg2+, 1H NMR titration experiments in DMSO-d6 were carried out (Fig. 6). The phenolic OH peaks (protons Ha and Hb) and the imine group NH (proton Hc) of P were observed at δ12.10, 11.72 and 9.55, respectively. An 1H NMR titration experiment of P shows that the proton Hb at δ11.7243 ppm disappeared on adding Mg2+, and the proton signals of the imine group NH (Hc) at δ9.5507 ppm and –CH![[double bond, length as m-dash]](https://www.rsc.org/images/entities/char_e001.gif) N at δ7.9390 ppm corresponding to downfield shifts to 10.0111 and 7.9473, respectively (Fig. S14, ESI†).
N at δ7.9390 ppm corresponding to downfield shifts to 10.0111 and 7.9473, respectively (Fig. S14, ESI†).
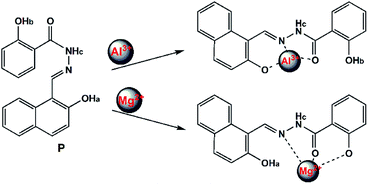
Based on these results, the selective recognition of P for Al3+/Mg2+ should be attributed to the interaction of the benzoyl hydrazine moieties with Al3+/Mg2+, which inhibit the photo-induced electron transfer (PET) process. As shown in Scheme 2, it seemed that the lone pair of electrons from the nitrogen atom of the –C![[double bond, length as m-dash]](https://www.rsc.org/images/entities/char_e001.gif) N– group to the benzoyl hydrazine moieties was responsible for the photoinduced electron-transfer (PET) process, which quenched the fluorescence emission of the probe. However, upon addition of Al3+/Mg2+, the PET process was inhibited owing to the chelation of the nitrogen atom of the –C
N– group to the benzoyl hydrazine moieties was responsible for the photoinduced electron-transfer (PET) process, which quenched the fluorescence emission of the probe. However, upon addition of Al3+/Mg2+, the PET process was inhibited owing to the chelation of the nitrogen atom of the –C![[double bond, length as m-dash]](https://www.rsc.org/images/entities/char_e001.gif) N– group with Al3+/Mg2+; as result, the quenched fluorescence could recur remarkably.
N– group with Al3+/Mg2+; as result, the quenched fluorescence could recur remarkably.
3.6 Biological application of P with Al3+/Mg2+
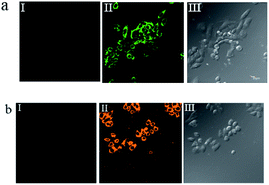
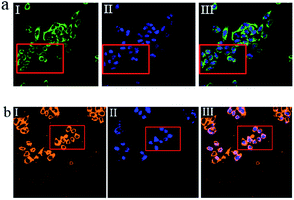
To investigate the potential biological applications of probe P in living cells, we performed intracellular Al3+ and Mg2+ dual imaging of HepG2 cells by fluorescence microscopy. After incubation with P for 30 min at 37 °C, the cells could not show any recognizable fluorescence, suggesting that autofluorescence from the cells can be avoided and no fluorescence signal was detected in cells treated only with P (Fig. 7(a-I) and (b-I)). However, under these conditions, for the P-loaded HepG2 cells, strong fluorescence was detected after the addition of exogenous Al3+ and Mg2+ (1 μM each) separately to the cells, which showed green and orange fluorescence (Fig. 7(a-II) and (b-II)), respectively, demonstrating membrane penetrability by P and its complexation with Al3+ and Mg2+ inside the cells, clearly demonstrating that Al3+ and Mg2+ and their interaction with P are essential for the fluorescence turn-on. The fluorescence signal of P in the presence of Al3+ and Mg2+ may be utilized as a signature for a selective probe response. Hence, these results indicate that probe P is an efficient candidate for monitoring changes in the intracellular Al3+ and Mg2+ concentration under biological conditions. The bright field images of Fig. 7(a-III) and (b-III), whose cell shapes indicated that P has low toxicity, reveal good biocompatibility of P for bioanalysis.P also was applied to the subcellular locations of Al3+ and Mg2+ in the HepG2 cells using confocal fluorescence microscopy. The cells were co-treated with P (10 μM) and Hoechst 33![[thin space (1/6-em)]](https://www.rsc.org/images/entities/char_2009.gif) 342 (1 μg mL−1) for 30 min, with the same conditions as those used in Fig. 8. The results further reveal that P locates primarily in the cytoplasm of these living HepG2 cells, as shown in Fig. 8. To evaluate the cytotoxicity of the probe, P was taken as an example to perform an MTT assay on HepG2 cells with dye concentrations from 0 μM to 10 μM. The MTT assay results confirmed that P has no significant toxicity to cultured HepG2 cells up to 48 h of treatment with 10 μM of P (Fig. S15, ESI†). Thus, P has promising potential in the dual sensing of Al3+ and Mg2+ in vitro.
342 (1 μg mL−1) for 30 min, with the same conditions as those used in Fig. 8. The results further reveal that P locates primarily in the cytoplasm of these living HepG2 cells, as shown in Fig. 8. To evaluate the cytotoxicity of the probe, P was taken as an example to perform an MTT assay on HepG2 cells with dye concentrations from 0 μM to 10 μM. The MTT assay results confirmed that P has no significant toxicity to cultured HepG2 cells up to 48 h of treatment with 10 μM of P (Fig. S15, ESI†). Thus, P has promising potential in the dual sensing of Al3+ and Mg2+ in vitro.
4 Conclusions
In summary, we developed a single fluorescent probe which displayed a distinct response to Al3+ and Mg2+. The probe showed ‘‘off–on’’ fluorescent responses toward Al3+ at pH 6.3 in ethanol–water solution. When the pH was changed from 6.3 to 9.4, the detection of the probe could respond to Mg2+. In addition, the cell imaging for Al3+/Mg2+ was satisfactory. However, multi-ion responsive molecular probes with multiple emission modes will be challenging tasks for a long time into the future.Conflicts of interest
There are no conflicts to declare.Acknowledgements
This work was financially supported by the National Science Foundation of China (No. 81760387, 81860381, 81660356) and the Natural Science Foundation of Hainan Province (No. 417149).Notes and references
- (a) X. R. He, H. B. Liu, Y. Li, S. Wang, Y. Li, N. Wang, J. Xiao, X. Xu and D. Zhu, Adv. Mater., 2005, 17, 2811 CrossRef CAS; (b) D. T. Quang and J. S. Kim, Chem. Rev., 2007, 107, 3780 CrossRef PubMed.
- (a) J. L. Wang, W. Y. Lin and W. L. Li, Chem.–Eur. J., 2002, 18, 13629 CrossRef PubMed; (b) C. Schmitz, A. Perraud, C. O. Johnson, K. Inabe, M. K. Smith, R. Penner, T. Kurosaki, A. Fleig and A. M. Scharenberg, Cell, 2003, 114, 191 CrossRef CAS PubMed.
- (a) O. B. Stepura and A. I. Martynow, Int. J. Cardiol., 2009, 134, 145 CrossRef CAS PubMed; (b) F. I. Wolf, A. Torsello, A. Fasanella and A. Cittadini, Mol. Asp. Med., 2003, 24, 11 CrossRef CAS.
- N. E. L. Saris, E. Mervaala, H. Karppanen, J. A. Khawaja and A. Lewenstam, Clin. Chim. Acta, 2000, 294, 1 CrossRef CAS.
- (a) Z. C. Liu, Z. Y. Yang, Y. X. Li, T. R. Li, B. D. Wang, Y. Li and X. L. Jin, Inorg. Chim. Acta, 2013, 395, 77 CrossRef CAS; (b) J. C. Qin, L. Fan, T. R. Li and Z. Y. Yang, Synth. Met., 2015, 199, 179 CrossRef CAS; (c) J. Barceló and C. Poschenrieder, Environ. Exp. Bot., 2002, 48, 75 CrossRef; (d) S. W. King, J. Savory, M. R. Willis and H. J. Gitelman, Crit. Rev. Clin. Lab. Sci., 1981, 14, 1 CrossRef CAS PubMed; (e) I. S. Parkinson, M. K. Ward and D. N. Kerr, J. Clin. Pathol., 1981, 34, 1285 CrossRef CAS PubMed; (f) J. Zhou, B. Horev, G. Hwang, M. I. Klein, H. Koo and D. S. Benoit, J. Mater. Chem., 2016, 4, 3075 RSC; (g) Y. L. Fu, Y. Y. Tu, C. B. Fan, C. H. Zheng, G. Liu and S. Z. Pu, New J. Chem., 2016, 40, 8579 RSC; (h) S. Z. Pu, C. C. Zhang, C. B. Fan and G. Liu, Dyes Pigm., 2016, 129, 24 CrossRef CAS; (i) H. C. Ding, B. Q. Li, S. Z. Pu, G. Liu, D. C. Jia and Z. Yu, Sens. Actuators, B, 2017, 247, 26 CrossRef CAS.
- E. T. Feng, C. B. Fan, N. S. Wang, G. Liu and S. Z. Pu, Dyes Pigm., 2018, 151, 22 CrossRef CAS.
- S. Y. Guang, G. Wei, Z. Q. Yan, Y. H. Zhang, G. Zhao, R. L. Wu and H. Y. Xu, Analyst, 2018, 143, 449 RSC.
- (a) A. Dhara, N. Guchhait, I. Mukherjee, A. Mukherjeec and S. C. Bhattacharya, RSC Adv., 2016, 6, 105930 RSC; (b) Y. Y. Zhang, C. Zhang, Y. N. Wu, B. Zhao, L. Y. Wang and B. Song, RSC Adv., 2019, 40, 23382 RSC; (c) Z. Wang, S. Q. Cui and S. Y. Qin, RSC Adv., 2019, 9, 6021 RSC.
- (a) A. Rai, A. K. Singh, K. Tripathi, A. K. Sonkar, B. S. Chauhan, S. Srikrishna, T. D. James and L. Mishra, Sens. Actuators, B, 2018, 266, 95 CrossRef CAS; (b) E. Dhineshkumar, M. Iyappan and C. Anbuselvan, J. Mol. Struct., 2020, 1210, 128033 CrossRef CAS.
- (a) X. Sun, Y. W. Wang and Y. Peng, Org. Lett., 2012, 14, 3420 CrossRef CAS PubMed; (b) K. K. Upadhyay and A. Kumar, Org. Biomol. Chem., 2010, 8, 4892 RSC; (c) Z. C. Xu, J. Yoon and D. R. Spring, Chem. Soc. Rev., 2010, 39, 1996 RSC; (d) H. N. Kim, W. X. Ren and J. S. Kim, Chem. Soc. Rev., 2012, 41, 3210 RSC.
- (a) Y. M. Xue, R. J. Wang, C. H. Zheng, G. Liu and S. Z. Pu, Tetrahedron Lett., 2016, 57, 1877 CrossRef CAS; (b) S. Goswami, K. Aich, S. Das, A. K. Das, D. Sarkar, S. Panja, T. K. Mondal and S. Mukhopadhyay, Chem. Commun., 2013, 49, 10739 RSC; (c) P. Torawane, K. Tayade, S. Bothra, S. K. Sahoo, N. Singh, A. Borse and A. Kuwar, Sens. Actuators, B, 2016, 222, 562 CrossRef CAS; (d) C. R. Li, J. C. Qin, G. Q. Wang, B. D. Wang, A. K. Fu and Z. Y. Yang, Inorg. Chim. Acta, 2015, 430, 91 CrossRef CAS; (e) C. R. Li, Z. C. Liao, J. C. Qin, B. D. Wang and Z. Y. Yang, J. Lumin., 2015, 168, 330 CrossRef CAS; (f) Y. Wang, Z. G. Wang, X. Q. Song, Q. Chen, H. Tian, C. Z. Xie, Q. Z. Li and J. Y. Xu, Analyst, 2019, 144, 4024 RSC.
- (a) E. R. H. Walter, J. A. G. Williams and D. Parker, Chem.–Eur. J., 2018, 24, 6432 CrossRef CAS PubMed; (b) J. H. Hu, J. B. Li, Y. Sun, P. X. Pei and J. Qi, RSC Adv., 2017, 7, 29697 RSC; (c) G. T. Selvan, V. Chitra, I. V. M. V. Enoch and P. M. Selvakumar, New J. Chem., 2018, 42, 902 RSC; (d) A. Merangmenla and A. Puzari, Inorg. Chim. Acta, 2020, 505, 119520 CrossRef; (e) Y. K. Xu, L. Yang, H. Y. Wang, Y. X. Zhang, X. F. Yang, M. S. Pei and G. Y. Zhang, J. Photochem. Photobiol., A, 2020, 91, 112372 CrossRef.
- (a) M. Wang, Y. L. Yuan, H. M. Wang and Z. H Qin, Analyst, 2016, 141, 832 RSC; (b) J. Yan, L. Fan, J. C. Qin, C. R. Li and Z. Y. Yang, Tetrahedron Lett., 2016, 57, 2910 CrossRef CAS; (c) L. Huang, J. Cheng, K. F. Xie, P. X. Xi, F. P. Hou, Z. P. Li, G. Q. Xie, Y. J. Shi, H. Y. Liu, D. C. Bai and Z. Z. Zeng, Dalton Trans., 2011, 40, 10815 RSC; (d) C. J. Li, K. Q. Xiang, Y. C. Liu, Y. C. Zheng, L. Pan, B. Z. Tian and J. L. Zhang, Res. Chem. Intermed., 2015, 41, 5915 CrossRef CAS; (e) N. Mergu and V. K. Gupta, Sens. Actuators, B, 2014, 210, 408 CrossRef.
- (a) D. P. Roek, J. E. Chateauneuf and J. F. Brennecke, Ind. Eng. Chem. Res., 2000, 39, 3090 CrossRef CAS; (b) A. Caballero, R. Martinez, V. Lloveras, I. Ratera, J. Vidal-Gancedo, K. Wurst, A. Tárraga, P. Molina and J. Veciana, J. Am. Chem. Soc., 2005, 127, 15666 CrossRef CAS PubMed.
- (a) Y. X. Ji, C. W. Yu, S. B. Wen and J. Zhang, Turk. J. Chem., 2016, 40, 625 CrossRef CAS; (b) C. W. Yu, J. Zhang, J. H. Li, P. Liu, P. H. Wei and L. X. Chen, Microchim. Acta, 2011, 174, 247 CrossRef CAS.
- (a) J. Zhang, C. W. Yu, S. Y. Qian, G. Lu and J. L. Chen, Dyes Pigm., 2012, 92, 1370 CrossRef CAS; (b) N. Li, C. W. Yu, Y. X. Ji and J. Zhang, Turk. J. Chem., 2015, 39, 660 CrossRef CAS; (c) C. W. Yu, L. Jian, Y. X. Ji and J. Zhang, RSC Adv., 2018, 8, 31106 RSC.
- (a) Z. D. Liu, H. J. Xu, L. Q. Sheng, S. S. Chen, D. Q. Huang and J. Liu, Spectrochim. Acta, Part A, 2016, 157, 6 CrossRef CAS PubMed; (b) F. F. Zhou, H. Q. Wang, P. Y. Liu, Q. H. Hu, Y. Y. Wang, C. Liu and J. K. Hu, Spectrochim. Acta, Part A, 2018, 190, 104 CrossRef CAS PubMed; (c) X. L. Yue, Z. Q. Wang, C. R. Li and Z. Y. Yang, Tetrahedron Lett., 2017, 58, 4532 CrossRef CAS.
Footnote |
| † Electronic supplementary information (ESI) available. See DOI: 10.1039/d0ra02101f |
| This journal is © The Royal Society of Chemistry 2020 |

