 Open Access Article
Biochar prepared from maize straw and molasses fermentation wastewater: application for soil improvement†
Yuan Zhou,
Yongze Liu,
Li Feng,
Yirong Xu,
Ziwen Du and
Liqiu Zhang *
*
Beijing Key Laboratory for Source Control Technology of Water Pollution, Engineering Research Center for Water Pollution Source Control and Eco-remediation, Beijing Forestry University, Beijing, 100083, China. E-mail: zhangliqiu@163.com
First published on 9th April 2020
Abstract
A novel method was applied to improve biochar properties and its soil application by introducing molasses fermentation wastewater into a maize straw pyrolysis process. In this study, maize straw biochar (MSB) was prepared from maize straw mixed with different amounts (1, 2 and 3 mL g−1 straw, v/w) of molasses fermentation wastewater which contained high organics and nitrogen contents. Characterization results indicated that the yield, carbon content, N/C, and cation exchange capacity (CEC) of MSB increased gradually with the increasing dosage of fermentation wastewater. In addition, the prepared MSB was added into sandy soil with four mixing proportions (1%, 3%, 5% and 10%, w/w) to investigate its effects on plant growth, soil properties and soil catalase activity (CAT) by pot experiments. The results indicated that MSB amendments increased soil pH, soil total organic carbon (TOC) and nutrients contents (TN, TP). It was suggested that 5% biochar proportion in soil derived from maize straw with 2 mL g−1 fermentation wastewater addition was more suitable for ryegrass growth, soil fertility and CAT activity improvement. This study provides a promising way to realize the resource utilization of fermentation wastewater and agricultural wastes at the same time.
1 Introduction
Sandy soil mainly consists of sand particles and it also contains silt, clay and sediment. The content of sand particles can be more than 80% and the water holding capacity (WHC) is relatively weak,1,2 which make it difficult for crops to grow in sandy soil. The nutrients in sandy soil, such as P and K, are often not sufficient3 and the soil may need additional fertilizer to ensure the crops can grow healthily. Therefore, it is necessary to find a long-term and effective method to solve the problems, and biochar application could be one appropriate method to increase soil fertility and promote crop growth.Biochar is a carbon-rich production by pyrolyzing various waste biomasses such as wood, crop residues, fruit bunch, manures and sewage sludge4–7 in oxygen limited condition. It has been well recognized that biochar can be used for modifying soil properties, improving crop yields or promoting other environmental services.6–8 Soil structure, pH, cation exchange capacity (CEC) and enzyme activities could all be improved by biochar addition.9–11 Based on several conducted researches, biochar played an important role in increasing the conservation of various nutrients, reducing nutrients leaching and improving nutrient holding capacity of plants.4,12,13 Biochar could also make the nutrients in soil more available for the crops.14,15 It was found that biochar could enhance soil fertility by improving enzymes activities.9,16,17
However, biochar has some problems in the imbalance of nutrition when it was applied in soil. Generally, it needs to be combined with extra soil additives such as fertilizers and composts to enhance soil nutrient contents,12,18 which requires additional costs and complex processes. In order to improve the biochar properties and compositions, biochar has been activated and modified by controlling pyrolysis conditions or adding different modifiers such as acid–base activators, exoenzymes, metal nanoparticles.19–21 The content of carboxyl groups in biochar could increase in the presence of oxygen.22 Metal irons could be used to change surface charge and adsorption performance of biochar via combination to biochar surface.23 Considering the nutrients, it was reported that molasses fermentation wastewater contained high concentration of complex constitutions such as organics, metals and proteins,24–26 which must be treated via long time and high cost consuming to meet the discharge standard.25 Furthermore, there could be potential risk in soil salinization and pollution if it was added directly into soil.27,28 Alternatively, the high content of nutrients such as nitrogen and organic carbon in fermentation wastewater could be recovered and utilized. Abundant organics and nutrients in molasses fermentation wastewater make it possible to be a kind of potential modifier for biochar preparation. Based on the consideration of biochar application and resource reutilization, this study prepared biochar with maize straw and molasses fermentation wastewater. The conversion of wastewater into biochar material are proposed to be not only an auxiliary disposal of wastewater, but also a method to reuse the resource from waste and gather nutrient for biochar. To the best knowledge, this was the first attempt to recover the nutrients of fermentation wastewater by modified maize straw biochar preparation.
In this study, molasses fermentation wastewater was adopted as modifier for biochar preparation, and the influence of the maize straw biochar (MSB) enhanced by wastewater on soil properties and plant growth was also investigated. The objectives of this research were to (i) investigate the influence of wastewater on biochar properties; (ii) evaluate the variations of ryegrass growth, soil properties and enzymatic activity after biochar application through pot experiments; and (iii) determine the optimal fermentation wastewater dosage and biochar proportions which can benefit soil properties and plant growth.
2 Materials and methods
2.1 Materials
Maize straw was derived from Changping rural area, Beijing. The raw maize straw was cut into 1–2 cm pieces and dried for 24 h at 105 °C in an electricity heat drum wind drying oven (101-1 AB, Teste). Maize straw was then ground into particles which could pass through 0.18 mm sieve. Elemental compositions of maize straw were analyzed by automatic element analyzer (Vario EL micro cube, Germany). The carbon (C), hydrogen (H) and nitrogen (N) contents of maize straw reached 47.21%, 6.21% and 0.55% (w/w), respectively.Molasses fermentation wastewater was taken from a food yeast factory in the southeast of Harbin, China. Samples were restored at 0–4 °C in a refrigerator before mixed with maize straw. Characteristics (i.e., COD, protein content, nitrogen content, phosphate concentration) of fermentation wastewater were measured according to the National Standard (GB5749-2006, China). Major organic matters were analyzed by gas chromatography-mass spectrometry (GC-MS). The basic properties of molasses fermentation wastewater were given in ESI (Table S1†). The pH value of molasses fermentation wastewater was 6.0–6.2. Its COD concentration was up to 63![[thin space (1/6-em)]](https://www.rsc.org/images/entities/char_2009.gif) 500 mg L−1, protein and total nitrogen contents were 834 mg L−1 and 4350 mg L−1, respectively. The major components were organic matters, phosphate, oxynitride and metal elements. And the main metal elements of the fermentation wastewater were Na, K, Ca, Mg, Fe and Zn.
500 mg L−1, protein and total nitrogen contents were 834 mg L−1 and 4350 mg L−1, respectively. The major components were organic matters, phosphate, oxynitride and metal elements. And the main metal elements of the fermentation wastewater were Na, K, Ca, Mg, Fe and Zn.
Soil was derived from the sandy soil in Da Xing, Beijing. Soil sample was taken from 0–15 cm below top layer, and then grinded into particles which could pass through 0.18 mm sieve after air drying. Basic properties of sandy soil were shown in Table S2.†
2.2 Preparation of MSB
The prepared maize straw was infused in different addition of molasses fermentation wastewater for 24 h, then the mixture was pyrolyzed in a tube furnace (Techtai-SGB, China) with N2 protection (99.99%) under 400 °C for 2 h at the heating rate of 10 °C min−1. Samples were marked as MSB0, MSB1, MSB2 and MSB3 to represent biochar produced by maize straw with 0, 1, 2 and 3 mL g−1 (v/w) wastewater addition, respectively. The MSB was ground and sieved until particle size was less than 0.20 mm. After that, the physicochemical characteristics of MSB (elementary analysis, specific surface area and functional groups) were determined.2.3 Characterization of MSB
Yield of MSB was calculated by the mass ratio of biochar to maize straw (dry basis). The pH value was measured by a pH meter (HACH, USA). CEC value was determined using ammonium ion (NH4+) exchange method according to Liang et al.11 Contents of C, H and N were analyzed by an automatic element analyzer (Vario EL micro cube, Germany). Heavy metal contents were measured by ICP-MS (7900, Agilent, USA). Surface area and surface porosity were analyzed by BET test under the condition of 77 K using a N2 adsorption–desorption isotherm (Quantachrome, USA). Scanning electron microscopy (SEM, Hitachi S-3400N, Japan) was used to describe biochar structures.6 The functional groups of MSB were analyzed by ATR-FTIR (Attenuated Total Reflection Fourier Transformed Infrared Spectroscopy, Bruker Vertex 70, Germany) at room temperature in 400–4000 cm−1 wave number range.2.4 Soil incubation experiment
Soil incubation experiments were operated by pot experiment to evaluate the influences of different proportions (1%, 3%, 5% and 10%, w/w) of different biochars (i.e., prepared with different fermentation wastewater addition (0, 1, 2, 3 mL g−1 straw, v/w)) on ryegrass growth, soil properties and CAT activity. CAT was one of antioxidants enzymes which were highly associated with microbial metabolism and organic degradation. During the experiments, ryegrasses were incubated over 55 days under 12 h illumination of fluorescent lamp every day and the temperature was kept at about 23 °C during the whole experiments. Each group of pot experiment consisted of five treatments including control soil and four different ratios of biochar to soil at 1%, 3%, 5% and 10% (w/w), respectively. Each treatment had three complete randomized replicates. The moisture content of soil in each treatment was controlled to 20–30% (w/w) by adding 100 mL deionized water every two days. The biochar-amended soil was sampled destructively every ten days and then analyzed for soil pH, CEC, soil total organic carbon (TOC), TN, TP and CAT activity, while fresh weight and leaf length of ryegrass were measured after 55 days. TOC was measured according to the Walkley and Black method (1974). The TN content was determined by a Kay type nitrogen determination apparatus (Hanon, K9840). The TP content was determined by the NaOH melt-colorimetry method (GB15618-1995, China). CAT enzymatic activity was estimated by ultraviolet spectrophotometry method.292.5 Statistical analysis
The data provided in this study were mean values with standard deviation based on the triplicate experimental results. Statistical analyses were firstly calculated using Microsoft Excel and then analyzed by Origin 9.1. Analysis of two-ways variance (ANOVA) and post hoc Tukey honest significant difference (HSD) tests were used to assess significant influences of different fermentation wastewater dosage and MSB addition proportions on soil properties, and the results were shown in Tables S3 and S4.† Correlation analysis and Pearson test at significance level of 0.05 were used to determine the relationships among the various parameters by SPSS 13.0.3 Results and discussion
3.1 Biochar characterization
![[thin space (1/6-em)]](https://www.rsc.org/images/entities/char_2009.gif) 000 mg L−1 = 0.86 g) organic carbon could be introduced into every 20 g maize straw by adding 20 mL fermentation wastewater (TOC = 43
000 mg L−1 = 0.86 g) organic carbon could be introduced into every 20 g maize straw by adding 20 mL fermentation wastewater (TOC = 43![[thin space (1/6-em)]](https://www.rsc.org/images/entities/char_2009.gif) 000 mg L−1). On the other hand, the generation of water vapor during pyrolysis could be another reason of biochar yield increase. Some studies have suggested that water vapor generated during pyrolysis process can improve the moisture content of maize straw, promote its devolatilization, and increase the generation of intermediate products during pyrolysis.31 Thus, the generation of water vapor could be largely enhanced by more adding fermentation wastewater.
000 mg L−1). On the other hand, the generation of water vapor during pyrolysis could be another reason of biochar yield increase. Some studies have suggested that water vapor generated during pyrolysis process can improve the moisture content of maize straw, promote its devolatilization, and increase the generation of intermediate products during pyrolysis.31 Thus, the generation of water vapor could be largely enhanced by more adding fermentation wastewater.
| Sample | Yield (wt%) | pH | CEC (cmol kg−1) | Surface area (m2 g−1) | Pore volume (cm3 g−1) | Elemental components (wt%) | ||||
|---|---|---|---|---|---|---|---|---|---|---|
| C | H | N | N/C | H/C | ||||||
| MSB0 | 34.10 | 7.63 | 10.41 | 122.44 | 0.11 | 59.02 | 4.01 | 2.40 | 0.040 | 0.07 |
| MSB1 | 44.95 | 7.80 | 13.73 | 340.02 | 0.29 | 60.46 | 5.12 | 2.57 | 0.042 | 0.09 |
| MSB2 | 48.35 | 7.99 | 14.82 | 366.00 | 0.55 | 61.82 | 4.58 | 2.66 | 0.043 | 0.07 |
| MSB3 | 56.40 | 8.04 | 19.82 | 371.04 | 0.56 | 62.74 | 4.53 | 2.80 | 0.045 | 0.07 |
The pH value of MSB increased slightly from 7.63 to 8.04. The results suggested that pyrolysis under wastewater addition led to pH increase of MSB. Some researchers reported that pH of biochar was related to the ash component and aromatic structure of biochar.32 Combined with the FTIR results of MSB (given in Section 3.1.5), the addition of fermentation wastewater increased the aromatic structure and C–N bands of MSB, which could also attribute to the pH increase of MSB. The CEC value of MSB increased significantly from 10.41 to 19.82 cmol kg−1. It was reported that CEC could be affected by acid functional groups, especially carboxylic functional groups.14,30 High concentration of complex ions and organics in fermentation wastewater could increase CEC by providing substrate for acid functional groups formation in biochar preparation (Table S1†). Increase of CEC could contribute to the increase of soil nutrients,11 and improve the fertilizer maintenance of MSB. H/C ratio of biochar was used to evaluate the degrees of stability and maturation of biochar.33 The results indicated that H/C ratios of MSB were all under the stability limit of 0.6,34 meaning MSB had long-term stability and could be safe for soil amendment.
![[thin space (1/6-em)]](https://www.rsc.org/images/entities/char_2009.gif) 000 mg L−1) and N-containing compounds (e.g., TN = 4350 mg L−1) such as trimethyl pyrazine, phenylethyl alcohol, and p-hydroxyphenyl acetonitrile in fermentation wastewater (Tables S1 and S4†). It should be noted that the molar N/C ratio also increased from 0.040 to 0.045 with wastewater dosage increasing, suggesting that higher nitrogen content was enhanced by wastewater addition.
000 mg L−1) and N-containing compounds (e.g., TN = 4350 mg L−1) such as trimethyl pyrazine, phenylethyl alcohol, and p-hydroxyphenyl acetonitrile in fermentation wastewater (Tables S1 and S4†). It should be noted that the molar N/C ratio also increased from 0.040 to 0.045 with wastewater dosage increasing, suggesting that higher nitrogen content was enhanced by wastewater addition.The pyrolysis path of maize straw and fermentation wastewater during pyrolysis was shown in Fig. S1.† During the pyrolysis process, some organics and nutrients in molasses fermentation wastewater can be retained after the pyrolysis process. These compositions retained in biochar could promote soil improvement by providing nutrients for soil directly or forming functional groups of biochar.14 For example, C could be retained as the main residues forming biochar and contributed to the formation of functional groups such as aromatic structure and carboxyl during pyrolysis.14,36,37 N could be retained in biochar with the formation of heterocyclic N such as pyridines and pyrroles.38
Specially, with the reactions of dehydration and isomerization during pyrolysis, the final products of the organics in maize straw and fermentation wastewater such as cellulose, hemicellulose and lignin mainly included glucoses and phenols in general.39,40 According to the previous study,31 the protein in fermentation wastewater could be decomposed to amino acid and peptide, then amino acid was further converted to indole and amine, while peptide was transformed into aromatic hydrocarbons, aldehyde and aliphatic amine. It was reported that amino group, amino acid and glucose could be converted to nitrogen-containing heterocyclic compounds.31,41
| Concentrations | Maize straw | Soil | MSB0 | MSB1 | MSB2 | MSB3 |
|---|---|---|---|---|---|---|
| a Not detected. | ||||||
| Na (g kg−1) | 0.52 | 0.36 | 1.03 | 1.29 | 1.75 | 2.15 |
| Mg (g kg−1) | 3.48 | 5.78 | 2.09 | 3.30 | 4.75 | 5.15 |
| Fe (g kg−1) | 0.18 | 10.46 | 0.73 | 1.62 | 1.99 | 2.68 |
| Cu (g kg−1) | 0.00 | 0.01 | 0.00 | 0.00 | 0.01 | 0.01 |
| Zn (g kg−1) | 0.15 | 0.04 | 0.01 | 0.03 | 0.06 | 0.07 |
| K (g kg−1) | 12.17 | 2.39 | 12.18 | 12.47 | 14.72 | 15.73 |
| Pb (mg kg−1) | NDa | 8.01 | NDa | NDa | NDa | NDa |
| Cd (mg kg−1) | 0.20 | 0.21 | 0.13 | 0.15 | 0.20 | 0.21 |
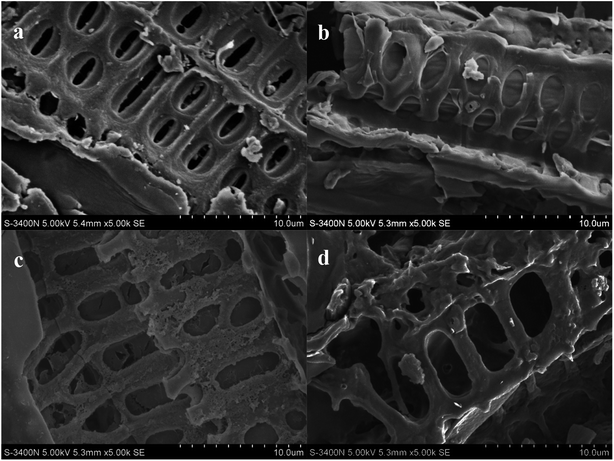 | ||
| Fig. 1 SEM images of maize straw and MSB particles with different addition of fermentation wastewater ((a) maize straw, (b) MSB0, (c) MSB1, (d) MSB2). | ||
The variation in SEM images was consistent with the results of surface area (BET) and pore volume of MSB listed in Table 1, where the BET surface area of biochar produced with 3 mL g−1 wastewater was the highest (371.04 m2 g−1). The change in pore size and surface structure could be attributed to the existence of metals in fermentation wastewater. Mg, Zn and Fe introduced by fermentation wastewater might lead to the structure change of biochar via providing more sites and space for nutrients adsorption, finally improving biochar properties.43–45
![[double bond, length as m-dash]](https://www.rsc.org/images/entities/char_e001.gif) C and C–N stretching bands of MSB, respectively. It could be observed that after fermentation wastewater addition, bands of alcohols C–O and C
C and C–N stretching bands of MSB, respectively. It could be observed that after fermentation wastewater addition, bands of alcohols C–O and C![[double bond, length as m-dash]](https://www.rsc.org/images/entities/char_e001.gif) C disappeared dramatically, indicating the decomposition of organic constituents such as cellulose, hemicellulose and lignin in maize straw.34,46 At the same time, functional groups such as C–N generated in MSB and increased with the increasing fermentation wastewater dosage. The generation and intensification of C–N bands suggested the increments of nitrogen such as amide structures during pyrolysis process.47 Combined with results of representative organic substances obtained by GC-MS analysis of molasses fermentation wastewater in Table S5,† it could be concluded that fermentation wastewater addition during pyrolysis process could influence the formation of functional groups in MSB, leading to the transformation, degradation (i.e., alcohols C–O, C
C disappeared dramatically, indicating the decomposition of organic constituents such as cellulose, hemicellulose and lignin in maize straw.34,46 At the same time, functional groups such as C–N generated in MSB and increased with the increasing fermentation wastewater dosage. The generation and intensification of C–N bands suggested the increments of nitrogen such as amide structures during pyrolysis process.47 Combined with results of representative organic substances obtained by GC-MS analysis of molasses fermentation wastewater in Table S5,† it could be concluded that fermentation wastewater addition during pyrolysis process could influence the formation of functional groups in MSB, leading to the transformation, degradation (i.e., alcohols C–O, C![[double bond, length as m-dash]](https://www.rsc.org/images/entities/char_e001.gif) C) and generation of different functional groups (i.e., aromatic C–H and C–N).
C) and generation of different functional groups (i.e., aromatic C–H and C–N).3.2 Effect of MSB addition on soil properties
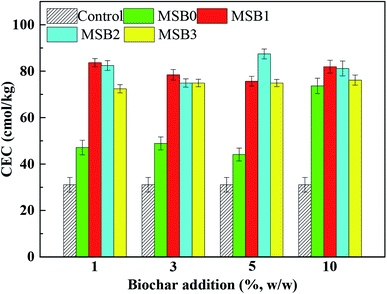
The high CEC value in soil after biochar amendment was beneficial for soil fertility and quality enhancement due to its high holding ability of nutrients. The high CEC value could be mainly attributed to the following two mechanisms: (i) high charge density of soil after biochar application, which can contribute to a high oxidation degree of soil organic matter; and (ii) a high surface area for more cation adsorption sites after biochar application.11 It should be noted that compared with MSB2, the soil CEC after MSB3 addition was slightly lower, which may be due to the high salinity in biochar caused by excessive addition of fermentation wastewater.
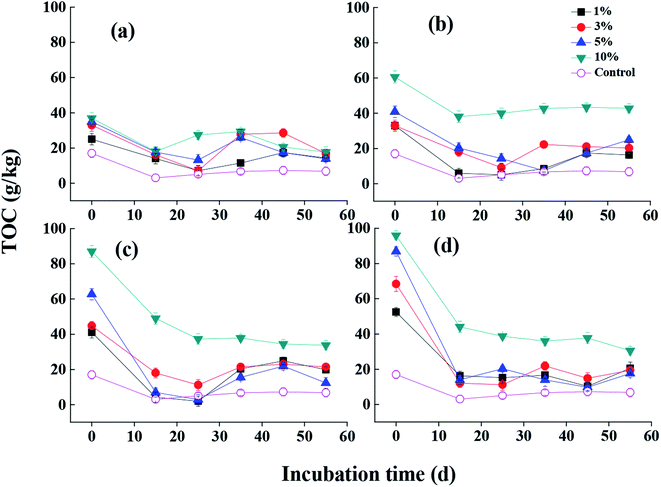 | ||
| Fig. 3 The effect of MSB produced under different addition of fermentation wastewater on soil TOC content ((a) MSB0, (b) MSB1, (c) MSB2, (d) MSB3). | ||
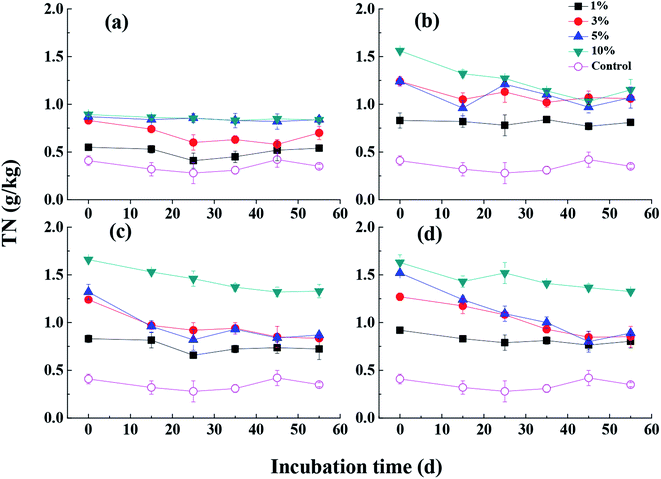
The nutrient contents in soil such as nitrogen and phosphorus after MSB addition were significantly higher than that in control soil (Fig. 4 and S4†). It was shown that higher proportion of MSB addition into soil resulted in higher total nutrient contents (p < 0.01). Meanwhile, nutrient contents gradually increased with increasing fermentation wastewater dosage (i.e. MSB1, MSB2 and MSB3). And with incubation time increasing, contents of TN and TP in soil gradually decreased. Studies indicated that the nutrient forms in soil were affected by the biochar application levels and mineral crystallization of organic matters.35,46 And the nutrient variations were attributed to the changes of labile nutrients and their release from biochar into the soil.12 The addition of MSB can supply the sandy soil with nitrogen and phosphorus, resulting in the improvement of their availability by reducing nutrient leaching and further increasing nutrient uptake by plants. In addition, it was generally recognized that nitrogen and phosphorus contents in biochar-amended soil were also controlled by microorganisms, which were mainly attributed to the direct effects by microorganisms (biochar attached) and indirect effects (labile substrates from biochar).53
3.3 Effect of MSB addition on soil CAT activity
The activity of CAT was generally recognized as a reliable index to evaluate soil properties and fertility because it could acquire electron from oxygen or hydrogen peroxide to decompose organic matters.29 Fig. 5a shows the variation of CAT activity in soil during incubation time. The experimental results suggested that MSB0 addition could induce an increase of CAT activity from 1.32 to 2.25 mg H2O2 per g soil in the initial period. CAT activity increased gradually during 45 day incubation and declined after that. In addition, the results showed that CAT activity reached the highest value with 5% MSB2 addition at the 45th day, which indicated that proper proportion of MSB and addition of wastewater were important for the enhancement of soil CAT activity.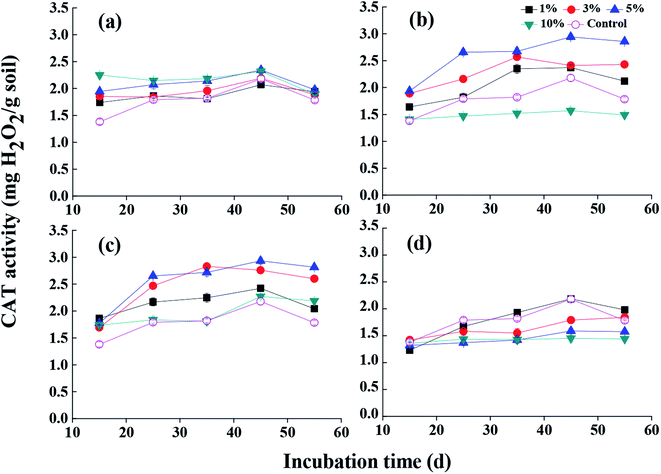 | ||
| Fig. 5 The effect of MSB produced under different addition of fermentation wastewater on soil CAT activity ((a) MSB0, (b) MSB1, (c) MSB2, (d) MSB3). | ||
The enhancement of organic matters and nutrients in soil after MSB application could be the main factors leading to the increase of soil CAT activity at the early stage.17 As the available composition was consumed gradually with the increase of incubation time, microbial metabolism became weak, leading to the decrease of CAT activity during the last period of the experiment. Meanwhile, it was also found that the ability of biochar enhancing soil CAT activity could be attributed to the complex function of specific enzymes and microorganisms activities.9 It was worth noting that for the CAT activity in MSB3 treatment, CAT activity was even lower than that in control group, which may be relevant to the degree of saturation54 that was caused by the influence of excess addition of wastewater.
3.4 Effect of MSB addition on ryegrass growth
It can be obtained from Fig. 6 that the application of MSB to sandy soil can significantly promote ryegrass growth compared to control soil. The ryegrass fresh weight and leaf length firstly increased with the increase of MSB addition from 1% to 5% (w/w) in soil, and then decreased greatly with further increasing MSB addition to 10%. At the same time, ryegrass weight and leaf length were improved significantly (p < 0.05) with fermentation wastewater dosage increased from 0 mL g−1 to 2 mL g−1, and then decreased when the dosage increased to 3 mL g−1. Ryegrass growth reached the highest values (i.e., fresh weight = 5.75 g and leaf length = 12.31 cm) when soil was amended with 5% (w/w) MSB2.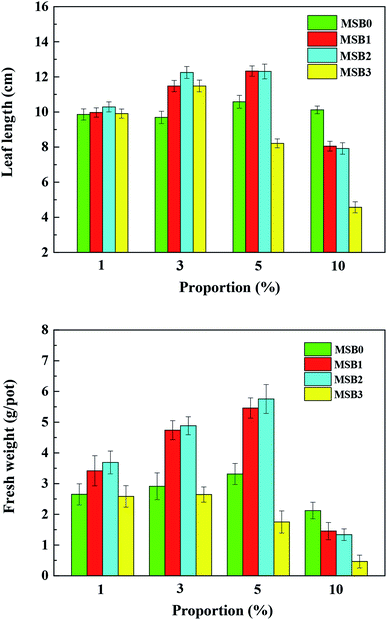 | ||
| Fig. 6 The effect of MSB produced under different addition of fermentation wastewater on ryegrass leaf length and fresh weight after 55 days. | ||
As shown above, when biochar (MSB2) was applied into soil, soil pH increased from 6.78 to 7.26, CEC changed from 74.91 to 82.42 cmol kg−1, TOC increased from 21.91 to 34.50 g kg−1, nitrogen content of soil increased from 0.74 to 1.32 g kg−1, and the CAT changed from 8.21 to 12.33 mg H2O2 per g soil compared to control. These variations might improve plant growth and crop production. To evaluate their correlation to the improvement of plant growth, correlation analysis and Pearson test among ryegrass growth, soil properties and CAT were conducted in Table S6.† The results showed that plant growth (e.g. ryegrass weight) was positively correlated with CAT (r = 0.88, p < 0.01) and CEC (r = 0.47, p < 0.05) in soil.
According to the correlation analysis among plant growth, soil properties and CAT activity (Table S6†), it could be seen that the direct effect on the improvement of plant weight and leaf length could be attributed to the improvement of CAT activity in soil (r = 0.88, p < 0.01). This might be explained that the enhancement of CAT activity could promote microbial activity in soil and thus improve nutrient absorption by roots after biochar application.12,18 In addition, CEC values in soil were also highly correlated with ryegrass weight (r = 0.47, p < 0.05), suggesting the enhancement of CEC in MSB-amended soil can be another reason for plant growth. Studies indicated that CEC in soil could increase the availability and retention of plant nutrients in soil, and thus providing available nutrients for plant growth.11,55
3.5 Environmental relevance
The present study indicated comprehensive benefits of MSB amendment for sandy soils: increased soil properties including TOC, nutrients and CEC contents, improved ryegrass leaf length and fresh weight, and enhanced CAT activity in soil. Compared with the previous biochar derived from maize straw,52 it could be found that fermentation wastewater addition could alter biochar properties by increasing its yield (56.40% vs. 32.61%), pore volume (0.56 vs. 0.01 mL g−1) and ratio of N/C (0.05 vs. 0.02). To improve sandy soil properties and promote plant growth, higher proportions of biochar were suggested to be adopted, which were commonly found in many literatures.56,57 For example, it demonstrated that soil hydraulic properties and water holding capacity increased when biochar application rate increased from 2.5% to 10% (w/w), which may be related to high amount of soil micropores.56 Much higher proportion (e.g., 20% w/w) of biochar has been applied to promote plant growth.57 In this study, it was suggested that 5% (w/w) MSB proportion was suitable for plant growth and soil amendment. This study could provide a new pathway for the resource reuse of high nutrients wastewater (e.g., alcohol and food industry wastewaters) and agricultural residues. For further studies, long-term influence of MSB in real soil environment on its amendment capacity and stability needs to be investigated.4 Conclusion
The contents of C, TN and CEC of novel biochar were improved by proper supplement of fermentation wastewater. Pot experiments showed almost all biochar-amended soils could enhance the organic carbon and nitrogen contents of soil. To be more specific, biochar prepared with fermentation wastewater (e.g., 3 mL g−1) could respectively increase soil pH, TOC and CEC contents by 0.13, 51.98 g kg−1 and 3.89 cmol kg−1, compared to MSB0 when biochar proportion was 10% (w/w). However, there was only optimal wastewater adding (2 mL g−1) and biochar proportions (5%, w/w) in soil were benefit for plants growth, as well as CAT activity. Using fermentation wastewater as a modifier to prepare biochar can not only reuse the components in wastewater, but also provide a possibility to improve the nutrients contents in biochar. Further research, especially for field-scale and long-term pot experiment, was necessary to fully understand the effects of biochar on soil fertilizer capacity.Conflicts of interest
There are no conflicts to declare.Acknowledgements
This work was financial supported by Fundamental Research Funds for the Central Universities (2015ZLQ-HJ-02), National Natural Science Foundation of China (51578066, 51608036), Beijing Natural Science Foundation (8182037) and Major Science and Technology for Water Pollution Control and Treatment (2018ZX07301-007).References
- S. A. Shahid, A. A. Qidwai, F. Anwar, I. Ullah and U. Rashid, Molecules, 2012, 17, 9397–9412 CrossRef CAS PubMed.
- V. Yadav, S. Jain, P. Mishra, P. Khare, A. K. Shukla, T. Karak and A. K. Singh, Appl. Soil Ecol., 2019, 138, 144–155 CrossRef.
- R. K. Gupta, A. Hussain, Y. Singh, S. S. Sooch, J. S. Kang, S. Sharma and G. S. Dheri, Exp. Agric., 2019, 1–14, DOI:10.1017/s0014479719000218.
- S. Khan, C. Chao, M. Waqas, H. P. H. Arp and Y. Zhu, Environ. Sci. Technol., 2013, 47, 8624–8632 CrossRef CAS PubMed.
- Y. Zhou, Y. Liu, W. Jiang, L. Shao, L. Zhang and L. Feng, Chemosphere, 2019, 221, 175–183 CrossRef CAS PubMed.
- M. F. Aller, Crit. Rev. Environ. Sci. Technol., 2016, 46, 1183–1296 CrossRef CAS.
- E. F. Zama, Y. Zhu, B. J. Reid and G. Sun, J. Cleaner Prod., 2017, 148, 127–136 CrossRef CAS.
- H. Xu, X. Wang, H. Li, H. Yao, J. Su and Y. Zhu, Environ. Sci. Technol., 2014, 48, 9391–9399 CrossRef CAS PubMed.
- V. L. Bailey, S. J. Fansler, J. L. Smith and H. J. Bolton, Soil Biol. Biochem., 2011, 43, 296–301 CrossRef CAS.
- A. R. Zimmerman, B. Gao and M. Y. Ahn, Soil Biol. Biochem., 2011, 43, 1169–1179 CrossRef CAS.
- B. Liang, J. Lehmann, D. Solomon, J. Kinyangi, J. Grossman, B. O'Neill, J. O. Skjemstad, J. Thies, F. J. Luizão, J. Petersen and E. G. Neves, Soil Sci. Soc. Am. J., 2006, 70, 1719–1730 CrossRef CAS.
- G. Agegnehu, A. M. Bass, P. N. Nelson, B. Muirhead, G. Wright and M. I. Bird, Agric., Ecosyst. Environ., 2015, 213, 72–85 CrossRef CAS.
- H. Sun, C. E. Brewer, C. A. Masiello and K. Zygourakis, Ind. Eng. Chem. Res., 2015, 54, 4123–4135 CrossRef CAS.
- M. A. Baquy, J. Jiang and R. Xu, Environ. Sci. Pollut. Res., 2019, 12 DOI:10.1007/s11356-019-06695-6.
- S. Rajkovich, A. Enders, K. Hanley, C. Hyland, A. R. Zimmerman and J. Lehmann, Biol. Fertil. Soils, 2012, 48, 271–284 CrossRef CAS.
- X. Wang, W. Zhou, G. Liang, D. Song and X. Zhang, Sci. Total Environ., 2015, 538, 137–144 CrossRef CAS PubMed.
- C. Ning, P. Gao, B. Wang, W. Lin, N. Jiang and K. Cai, J. Integr. Agric., 2017, 16, 1819–1831 CrossRef CAS.
- H. P. Schmidt, C. Kammann, C. Niggli, M. W. H. Evangelou, K. A. Mackie and S. Abiven, Agric., Ecosyst. Environ., 2014, 191, 117–123 CrossRef CAS.
- M. Luo, H. Lin, B. Li, Y. Dong, Y. He and L. Wang, Bioresour. Technol., 2018, 259, 312–318 CrossRef CAS PubMed.
- Z. Tan, Y. Wang, L. Zhang and Q. Huang, Environ. Sci. Pollut. Res., 2017, 24, 24844–24855 CrossRef CAS PubMed.
- J. C. S. Hernandez, J. Hazard. Mater., 2018, 350, 136–143 CrossRef PubMed.
- Z. Chen, L. Ma, S. Li, J. Geng, Q. Song, J. Liu, C. Wang, H. Wang, J. Li, Z. Qin and S. Li, Appl. Surf. Sci., 2011, 257, 8686–8691 CrossRef CAS.
- M. B. Ahmed, J. L. Zhou, H. H. Ngo, W. Guo and M. Chen, Bioresour. Technol., 2016, 214, 836–851 CrossRef CAS PubMed.
- S. Wu, Y. Dang, B. Qiu, Z. Liu and D. Sun, Int. Biodeterior. Biodegrad., 2015, 104, 15–20 CrossRef CAS.
- Y. Wu, Y. Kang, L. Zhang, D. Qu, X. Cheng and L. Feng, J. Environ. Sci., 2018, 65, 253–261 CrossRef PubMed.
- H. Y. Ren, F. Kong, J. Ma, L. Zhao, G.-J. Xie, D. Xing, W.-Q. Guo, B.-F. Liu and N.-Q. Ren, Bioresour. Technol., 2018, 110–117 CrossRef CAS PubMed.
- M. A. Jabari, N. Iqefan, N. Zahdeh and H. Dweik, Int. J. Global Environ. Issues, 2017, 16, 1–3 Search PubMed.
- M. Wang, S. Chen, L. Chen, D. Wang and C. Zhao, Chemosphere, 2019, 236, 124372 CrossRef CAS PubMed.
- K. Jin, S. Sleutel, D. Buchan, S. D. Neve, D. X. Cai, D. Gabriels and J. Y. Jin, Soil Tillage Res., 2009, 104, 115–120 CrossRef.
- W. Suliman, Biomass Bioenergy, 2016, 84, 37–48 CrossRef CAS.
- W. Ma, G. Du, J. Li, Y. Fang, L. Hou, G. Chen and D. Ma, Waste Manage., 2017, 59, 371–378 CrossRef CAS PubMed.
- J. Jin, Y. Li, J. Zhang, S. Wu, Y. Cao, P. Liang, J. Zhang, M. Wong, M. Wang, S. Shan and P. Christie, J. Hazard. Mater., 2016, 320, 417–426 CrossRef CAS PubMed.
- S. Schimmelpfennig and B. Glaser, J. Environ. Qual., 2011, 41, 1001–1013 CrossRef PubMed.
- K. B. Cantrell, P. G. Hunt, M. Uchimiya, J. M. Novak and K. S. Ro, Bioresour. Technol., 2012, 107, 419–428 CrossRef CAS PubMed.
- S. Gul and J. K. Whalen, Soil Biol. Biochem., 2016, 103, 1–15 CrossRef CAS.
- W. Suliman, J. B. Harsh, N. I. Abu-Lail, A.-M. Fortuna, I. Dallmeyer and M. Garcia-Perez, Biomass Bioenergy, 2016, 84, 37–48 CrossRef CAS.
- S.-H. Lin, L.-Y. Hsu, C.-S. Chou, J.-W. Jhang and P. Wu, J. Anal. Appl. Pyrolysis, 2014, 107, 9–16 CrossRef CAS.
- A. Enders, K. Hanley, T. Whitman, S. Joseph and J. Lehmann, Bioresour. Technol., 2012, 114, 644–653 CrossRef CAS PubMed.
- A. T. Gooty, D. Li, F. Berruti and C. Briens, J. Anal. Appl. Pyrolysis, 2014, 106, 33–40 CrossRef.
- Y. Lin, J. Cho, G. A. Tompsett, P. R. Westmoreland and G. W. Huber, J. Phys. Chem. C, 2009, 113, 20097–20107 CrossRef CAS.
- A. Kruse, P. Maniam and F. Spieler, Ind. Eng. Chem. Res., 2007, 46, 87–96 CrossRef CAS.
- T. Abbas, M. Rizwan, S. Ali, M. Adrees, A. Mahmood, M. Z. Rehman, M. Ibrahim, M. Arshad and M. F. Qayyum, Ecotoxicol. Environ. Saf., 2018, 148, 825–833 CrossRef CAS PubMed.
- X. Xiao, B. Chen, L. Zhu and J. L. Schnoor, Environ. Sci. Technol., 2017, 51, 12644–12652 CrossRef CAS PubMed.
- W. J. Liu, H. Jiang, K. Tian, Y. W. Ding and H. Q. Yu, Environ. Sci. Technol., 2013, 47, 9397–9403 CrossRef CAS PubMed.
- L. Sun, C. Tian, M. Li, X. Meng, L. Wang, R. Wang, J. Yin and H. Fu, J. Mater. Chem. A, 2013, 1, 6462 RSC.
- R. Zornoza, F. Moreno-Barriga, J. A. Acosta, M. A. Munoz and A. Faz, Chemosphere, 2016, 144, 122–130 CrossRef CAS.
- L. Leng, X. Yuan, H. Huang, J. Shao, H. Wang, X. Chen and G. Zeng, Appl. Surf. Sci., 2015, 346, 223–231 CrossRef CAS.
- J. Yuan, R. Xu and H. Zhang, Bioresour. Technol., 2011, 102, 3488–3497 CrossRef CAS PubMed.
- N. Borchard, A. Wolf, V. Laabs, R. Aeckersberg, H. W. Scherer, A. Moeller and W. Amelung, Soil Use Manage., 2012, 28, 177–184 CrossRef.
- C. Xu, H. X. Chen, Q. Xiang, H. H. Zhu, S. Wang, Q. H. Zhu, D. Y. Huang and Y. Z. Zhang, Environ. Sci. Pollut. Res. Int., 2018, 25, 1147–1156 CrossRef CAS PubMed.
- C. Xu, H.-x. Chen, Q. Xiang, H.-h. Zhu, S. Wang, Q.-h. Zhu, D.-y. Huang and Y.-z. Zhang, Environ. Sci. Pollut. Res., 2017, 25, 1147–1156 CrossRef PubMed.
- D. Song, J. Tang, X. Xi, S. Zhang and X. Wang, Eur. J. Soil Biol., 2018, 84, 1–10 CrossRef CAS.
- S. Gul, J. K. Whalen, B. W. Thomas, V. Sachdeva and H. Deng, Agric., Ecosyst. Environ., 2015, 206, 46–59 CrossRef CAS.
- F. Cattaneo, G. D. Vecchia and C. Jommi, Comput. Geotech., 2014, 55, 404–415 CrossRef.
- M. Arif, M. Ilyas, M. Riaz, K. Ali, K. Shah, I. U. Haq and S. Fahad, Field Crop. Res., 2017, 214, 25–37 CrossRef.
- A. Igalavithana, Y. Ok, N. Niazi, M. Rizwan, M. Al-Wabel, A. Usman, D. Moon and S. Lee, Sustainability, 2017, 9, 266 CrossRef.
- X. D. Song, X. Y. Xue, D. Z. Chen, P. J. He and X. H. Dai, Chemosphere, 2014, 109, 213–220 CrossRef CAS PubMed.
Footnote |
| † Electronic supplementary information (ESI) available. See DOI: 10.1039/d0ra02038a |
| This journal is © The Royal Society of Chemistry 2020 |

