
 Open Access Article
 This Open Access Article is licensed under a
 Creative Commons Attribution 3.0 Unported Licence
The Aquilegia pubiflora (Himalayan columbine) mediated synthesis of nanoceria for diverse biomedical applications
Hasnain Jan *ad,
Muhammad Aslam Khan*b,
Hazrat Usmana,
Muzamil Shaha,
Rotaba Ansirc,
Shah Faisald,
Niamat Ullahc and
Lubna Rahmana
*ad,
Muhammad Aslam Khan*b,
Hazrat Usmana,
Muzamil Shaha,
Rotaba Ansirc,
Shah Faisald,
Niamat Ullahc and
Lubna Rahmana
aDepartment of Biotechnology, Quaid-i-Azam University, Islamabad 45320, Pakistan. E-mail: hasnainjan@bs.qau.edu.pk
bDepartment of Biotechnology, International Islamic University, Islamabad, Pakistan. E-mail: muhammadaslamkhanmarwat@gmail.com
cDepartment of Chemistry, Quaid-i-Azam University, 45320, Islamabad, Pakistan
dDepartment of Biotechnology, Bacha Khan University, Charsadda, KP, Pakistan
First published on 20th May 2020
Abstract
Herein, we report an eco-friendly, facile, one-pot, green synthesis of nanoceria for multiple biomedical applications. In the study, cerium oxide nanoparticles (CeO2-NPs) were synthesized using a simple aqueous extract of Aquilegia pubiflora as an effective reducing and capping agent. The biosynthesized nanoparticles were characterized via UV-vis spectroscopy, X-ray powder diffraction (XRD), high-performance liquid chromatography (HPLC), Fourier transform infrared spectroscopy (FTIR), scanning electron microscopy (SEM), transmission electron microscopy (TEM), and Raman spectroscopy. The NPs were highly stable, exhibited high purity, and had a spherical morphology and mean size of 28 nm. FTIR and HPLC studies confirmed the successful capping of bioactive compounds on the nanoparticles. The well-characterized NPs were evaluated for a number of biomedical applications, and their antimicrobial (antifungal, antibacterial, and antileishmanial), protein kinase inhibition, anticancer, antioxidant, anti-diabetic and biocompatibility properties were studied. Our results showed that the Aquilegia pubiflora mediated CeO2-NPs were highly active against fungal strains, compared to the tested bacterial strains, with Aspergillus niger resulting in the largest zone of inhibition (15.1 ± 0.27 mm). The particles also exhibited dose dependent leishmanicidal activity with significant LC50 values toward both the amastigote (114 μg mL−1) and promastigote (97 μg mL−1) forms of the parasite Leishmania tropica (KWH23). The NPs were found to be moderately active against the HepG2 cell line, showing 26.78% ± 1.16% inhibition at 200 μg mL−1. Last but not least, their highly biocompatible nature was observed with respect to freshly isolated human red blood cells (hRBCs), making the greenly synthesized CeO2-NPs a novel candidates for multidimensional medical applications.
1. Introduction
The availability of cerium oxide (CeO2), one of the most abundant rare earth oxides, has encouraged tremendous research into the development of functional cerium nanoparticles for diverse applications.1 The unique properties of CeO2 have been utilized in bio-sensing,2 ultraviolet absorbance,3 catalysis, electrochemical cells, corrosion prevention, glass polishing, and thermal coatings.4In recent years, CeO2-NPs have also received much attention from the scientific community in relation to medicine.1 Owing to their excellent radical scavenging abilities, different studies have demonstrated that CeO2-NPs can alleviate the symptoms of many oxidative stress-related diseases, such as retinitis, chronic inflammation, neurodegeneration, diabetes, and cancer. However, the eco-friendly synthesis of high quality CeO2 is still a challenging task.5
Traditional chemical and physical methods are mostly utilized for the synthesis of CeO2-NPs. These include solution precipitation, hydrothermal,6 solvothermal,7 ball milling and thermal decomposition,7 spray pyrolysis,8 thermal hydrolysis,9 and sol–gel10 methods. However, such methodologies are time-consuming, require large amounts of energy, and produce hazardous chemicals, making them environmentally unfriendly. Recently, bio-assisted synthesis methods that use living organisms as capping and stabilizing agents have been proven to be efficient, inexpensive, and safer routes for the preparation of cerium oxide nanoparticles.11
The green synthesis of CeO2-NPs using plant extracts has already been demonstrated, however, limited data is available regarding their diverse biological applications, including their antimicrobial, antileishmanial, antioxidant, anti-diabetic, and anti-cancer potential. Here, we report the rapid, room temperature synthesis of CeO2-NPs via a completely eco-friendly procedure, which involves the use of a simple aqueous extract of Aquilegia pubiflora as an effective oxidizing/reducing and capping agent. The medicinal uses of A. pubiflora are well documented, and it is commonly used in hepatitis and skin burn treatment, wound healing, and the treatment of jaundice, and gynecological, circulatory and cardiovascular problems12–15.
To the best of our knowledge, this is the first ever report on the Aquilegia pubiflora mediated synthesis of CeO2-NPs. The synthesized NPs were characterized via UV-vis spectroscopy, Fourier transform infrared spectroscopy (FTIR), X-ray diffraction (XRD), scanning electron microscopy (SEM), transmission electron microscopy (TEM), energy dispersive X-ray (EDX) analysis, and Raman spectroscopy. The well-characterized NPs were then investigated for their anticancer, antimicrobial, anti-diabetic, and antioxidant potential. Moreover, to confirm their bio-safe nature, the NPs were evaluated for biocompatibility against freshly isolated human red blood cells (hRBCs).
2. Materials and methods
2.1. Collection and processing of the plant material
The herbs used in the current study were collected from Swat District (Miandam), Khyber Pakhtunkhwa, Pakistan. The plant was taxonomically identified as Aquilegia pubiflora at the Department of Botany, Bacha Khan University, Charsadda, and later verified at the Department of Plant Sciences, Quaid-i-Azam University Islamabad, Pakistan.The fresh and fine leaves of the plant were excised into small pieces using a sterile surgical blade, rinsed well with distilled water to remove any dust particles and impurities, followed by drying in the shade. The well-dried leaves were then ground into a fine powder in a Wiley mill and stored at 25 °C for aqueous extraction.
Aqueous leaf extract was prepared by adding 30 g of fine powder to a flask (500 mL) containing 200 mL of distilled water, which was sonicated continuously for 10 min and kept in a shaking incubator at 200 rpm for two days at 37 °C. The prepared extract was initially filtered twice using nylon cloth to remove solid residue. The obtained extract was further filtered three times using Whatman filter paper No. 1 to remove any remaining particulates. The fresh filtrate obtained was then processed for further use.
2.2. Biosynthesis of the CeO2 nanoparticles
Briefly, 3 g of cerium(III) chloride heptahydrate (CeCl3·7H2O; Sigma-Aldrich) was added to 100 mL of extract and kept under magnetic stirring at 60 °C for 2 h. Once the reaction was completed, the mixture was allowed to cool down at 25 °C, followed by centrifugation at 10![[thin space (1/6-em)]](https://www.rsc.org/images/entities/char_2009.gif) 000 rpm for 10 min. The supernatant was discarded, and the remaining pellet was washed thrice with distilled water, poured into a clean Petri plate and oven dried at 90 °C. The dried material was then ground into fine powder in a pestle and mortar and calcinated for 2 h at 500 °C to remove any impurities. The annealed powder was stored in an air-tight glass vial, labelled as CeO2-NPs, and was further used for physical characterization and biological applications.
000 rpm for 10 min. The supernatant was discarded, and the remaining pellet was washed thrice with distilled water, poured into a clean Petri plate and oven dried at 90 °C. The dried material was then ground into fine powder in a pestle and mortar and calcinated for 2 h at 500 °C to remove any impurities. The annealed powder was stored in an air-tight glass vial, labelled as CeO2-NPs, and was further used for physical characterization and biological applications.
2.3. Physicochemical and morphological characterization
Several characterization techniques, including UV spectroscopy, Fourier transform infrared spectroscopy (FTIR), high-performance liquid chromatography (HPLC), X-ray diffraction (XRD), scanning electron microscopy (SEM), transmission electron microscopy (TEM), energy dispersive X-ray (EDX) analysis, and Raman spectroscopy were used to evaluate the structural, chemical, vibrational and morphological properties of the biosynthesized CeO2-NPs. To determine the phase and crystalline nature, XRD (Model-D8 Advance, Germany) studies were carried out in the 2 theta range of 10°–55°. Diffraction data was obtained using Cu Kα radiation (wavelength: 1.5406 Å) via analyzing 1 mg of powdered CeO2-NPs, with a step-time of 0.55 seconds and a scanning step size of 0.03° s−1. To calculate the crystallite size, the Scherrer equation was used as follows:| D = Kλ/βcosθ |
Size distribution and zeta potential (ζ) data were obtained using Zetasizer Nano-ZS apparatus (Malvern Instruments, Worcestershire, UK). Briefly, a tenfold dilution of sample (1 mL) in ultra-pure water (1 mL) was added to a particle size analyzer at room temperature. Zeta potential and size distribution data were recorded using inbuilt software based on the Helmholtz–Smoluchowski equation.16
2.4. Anti-bacterial assays
The agar well diffusion method, as documented previously, was used with some modifications for the assessment of the in vitro bactericidal potential of the CeO2-NPs against different pathogenic strains.17 Briefly, microbial cultures were grown overnight in a sterilized nutrient broth medium at 37 °C in a shaking incubator. The turbidity of the culture was standardized to an OD of 0.5, corresponding to MacFarland standards (with a seeding density of 1 × 10⁸ CFU mL−1). From the standardized microbial cultures, 50 μL of inoculum was dispensed in Petri plates with solid agar medium and spread uniformly using sterile cotton swabs. A 5 mm borer was used to make wells. Each well was carefully filled with 10 μL of test sample. Accordingly, the seeded plates were also labelled. Cefixime and roxithromycin (standard antibiotics) and DMSO acted as positive and negative controls, respectively. After incubation for 24 h at 37 °C, each well loaded with a test sample was observed for the appearance of a zone of inhibition (ZOI). The diameter of the zone was measured in mm with a Vernier caliper. All experiments were conducted in triplicate and were statistically analyzed using Statistix 8.1. One-way ANOVA was used to check the significant mean difference with Tukey's HSD for post hoc analysis. P < 0.05 was used to define a significant result. All graphs were made using Origin 8.1.2.5. Anti-fungal assays
The agar well diffusion method was used to evaluate the antifungal potency of the CeO2-NPs.18 In brief, sterile SDA (Sabouraud dextrose agar) medium was poured into autoclaved plates and 100 μL spore suspensions of every fungal strain were taken and swabbed onto the solidified media in the Petri plates. Each sample to be tested (10 μL) was poured into the wells, and the plates were also labeled accordingly. DMSO and clotrimazole were used as negative and positive controls, respectively. Plates were incubated at 28 °C for 24–48 h to clearly visualize the fungal growth. After incubation, each well loaded with test samples or controls was checked for the appearance of a ZOI (zone of inhibition). The diameter of the ZOI was measured using a Vernier caliper to the nearest mm. All experiments were conducted in triplicate and were statistically analyzed using Statistix 8.1. One-way ANOVA was used to check the significant mean difference with Tukey's HSD for post hoc analysis. P < 0.05 was used to define a significant result. All graphs were made using Origin 8.1.2.6. Anti-leishmanial assays (promastigotes and amastigotes)
The anti-leishmanial potential of the biogenic CeO2-NPs was investigated based on the MTT cytotoxic activities against amastigote and promastigote cultures of L. tropica KWH23 (Department of Biotechnology, BKUC, Pakistan).19 M199 media with 10% fetal bovine serum was used to culture leishmanial parasites (culture density: 1 × 10⁶ cells per mL). The activity was examined in a 96-well plate at concentrations ranging from 200–25 μg mL−1. DMSO was used as a blank and amphotericin B was used as a positive control. The seeded 96-well plate was incubated at room temperature for 72 h. Optical density (OD) measurements were carried out at 540 nm, while all living cultures were counted using an inverted microscope. Table curve software was used to calculate the respective LC50 values. Percentage inhibition values were calculated using the following formula:
2.7. Protein kinase assays
Protein kinase enzyme inhibition assays were performed to verify the protein kinase inhibition abilities of the biogenic CeO2-NPs with slight modifications.18 The medium (TSB broth) was prepared, autoclaved at 121 °C for 20 minutes, and incubated for 24 h to detect any impurities. Both Streptomyces strains and autoclaved TSB broth were kept in a shaking incubator at 30 °C for 24 h. Inorganic salt starch agar (ISP4) minimal medium was used for the growth of fungi. Except for agar, starch and calcium carbonate, the remaining ingredients were added with 300 mL of distilled water and mixed constantly with a stirrer. Starch, calcium carbonate and agar were dissolved in 200 mL of distilled water in a separate flask. Both solutions were finally mixed together to make up the final concentration in 500 mL of medium. The medium was autoclaved and poured into autoclaved Petri plates under antiseptic conditions to avoid contamination. The media was kept to allow it to solidify, and Streptomyces strains in culture broth were uniformly spread on the surface of the medium with autoclaved cotton-buds. A sterile borer was used for making wells, and molten agarose was added to the bottoms of the wells to avoid the diffusion of the test samples. Afterwards, 20 μL of serially diluted sample was added to each well and it was kept intact for a few minutes to avoid the aggregation of poured sample in the well. Surfactin and DMSO were used as positive and negative controls, respectively. Petri plates were properly labeled and kept for incubation at 37 °C for 24–48 h. Using a Vernier caliper, zones of inhibition were measured in mm after 24 h and 48 h, respectively.2.8. Cytotoxicity against the HepG2 cell line
The standard protocol from ref. 20 with slight modifications was used to assess the anti-proliferative potential of the CeO2-NPs against human hepatocellular carcinoma cells (ATCC HB-8065). HepG2 cells were cultured (37 °C in a humidified 5% CO2 atmosphere) in DMEM containing 10% fetal calf serum (FCS), supplemented with 100 U mL−1 penicillin, 100 μg mL−1 streptomycin, 2 mM L-glutamine, and 1 mM Na-pyruvate. 0.5 mM trypsin/EDTA was used for cell harvesting at room temperature. Nanoparticles were suspended in deionized water and sonicated for 30 min prior to experiments. HepG2 cells (90% confluency) were seeded in a 96-well plate at a density of 12000 cells per well and allowed to adhere for 24 h at 37 °C. Subsequently, cells were treated with samples at 100 μg mL−1 for 24 h. 50% pre-chilled trichloroacetic acid (TCA) was then used for cell fixation, followed by incubation at 4 °C for 1 h; later, samples were rinsed with deionized water three times. The plate was then air-dried and the cells were stained with SRB dye (0.05%), followed by room-temperature incubation (30 min) and washing with acetic acid (1%) for removing unbound dye. Non-treated cells (NTC) and the drug doxorubicin (30 μM) were used as controls. Images were taken using a light microscope (Olympus CK2) equipped with a digital camera. A microplate reader (Platos R 496, AMP) was used to obtain abs values at 565 nm. Percentage viability values relative to an untreated sample were calculated using the formula:where Abssample and AbsNTC denote treated samples and non-treated cells, respectively. AbsNP control and Absblank represent the background OD values measured from NP and media samples alone, respectively. The assay was repeated twice with triplicates measurements of each sample.
2.9. Anti-diabetic assays
α-Amylase and α-glucosidase inhibition bioassays were performed to investigate the anti-diabetic potentials of samples.
2.10. Antioxidant assays
where Abc and Abs indicate the absorbances of the negative control and sample, respectively.

2.11. Biocompatibility with isolated human red blood cells (hRBCs)
The biocompatibility of the CeO2-NPs was probed against freshly isolated hRBCs to assess their bio-safe nature.24 About 1 mL of blood was collected from healthy individuals with informed consent. The isolated blood was poured into an EDTA tube to prevent blood clotting. For the isolation of erythrocytes, blood was centrifuged at 12000 rpm for 7 min. Once centrifugation was completed, the supernatant was discarded, and the remaining pellet was washed three times with PBS. 200 μL of erythrocyte suspension was mixed with 9.8 mL of PBS (pH: 7.2) and gently shaken to prepare the PBS–erythrocyte suspension. Different concentrations of NPs along with the prepared erythrocyte suspension were taken in Eppendorf tubes and incubated for 1 h at 35 °C. All the reaction mixtures were centrifuged at 10000 rpm for 10 min after incubation. 200 μL of supernatant was transferred from each tested sample into a 96-well plate, and the absorption was recorded for haemoglobin release at 540 nm. 0.5% Triton X-100 was used as a positive control, while DMSO was employed as a negative control. Percentage haemolysis was calculated via:where “sample” and “negative control” represent the absorbance of the sample and negative control, respectively, while “positive control” denotes the absorbance of the positive control.

2.12. Live subject statement
The biocompatibility assay of Ag-NPs against human red blood cells includes the use of a human blood sample and was performed in compliance with the relevant laws and institutional guidelines of Bacha Khan University, Pakistan. The ethical committee of Bacha Khan University, Pakistan have approved the experiment and consent form. The blood sample was collected from a healthy volunteer with informed consent.3. Results and discussion
3.1. Biosynthesis
In the study, a simple aqueous leaf extract of Aquilegia pubiflora was used as the reducing and stabilizing agent for the preparation of CeO2-NPs. To the best of our knowledge, this is the first ever report on the Aquilegia pubiflora mediated biosynthesis of nanoceria. The genus Aquilegia has more than 60 plant species, which are rich in medicinally important compounds, including berberine, caffeic acid, genkwanin, glochidionolactone-A, ferulic acid, magnoflorine, p-coumaric acid and resorcylic acid.25,26 These phytochemicals, including phenols and flavonoids, could play an essential role in the synthesis and stability of the CeO2-NPs (Fig. 1). The phytochemicals specifically responsible for the reducing and successful capping were identified and quantified using high-performance liquid chromatography (HPLC), as presented in Table 1.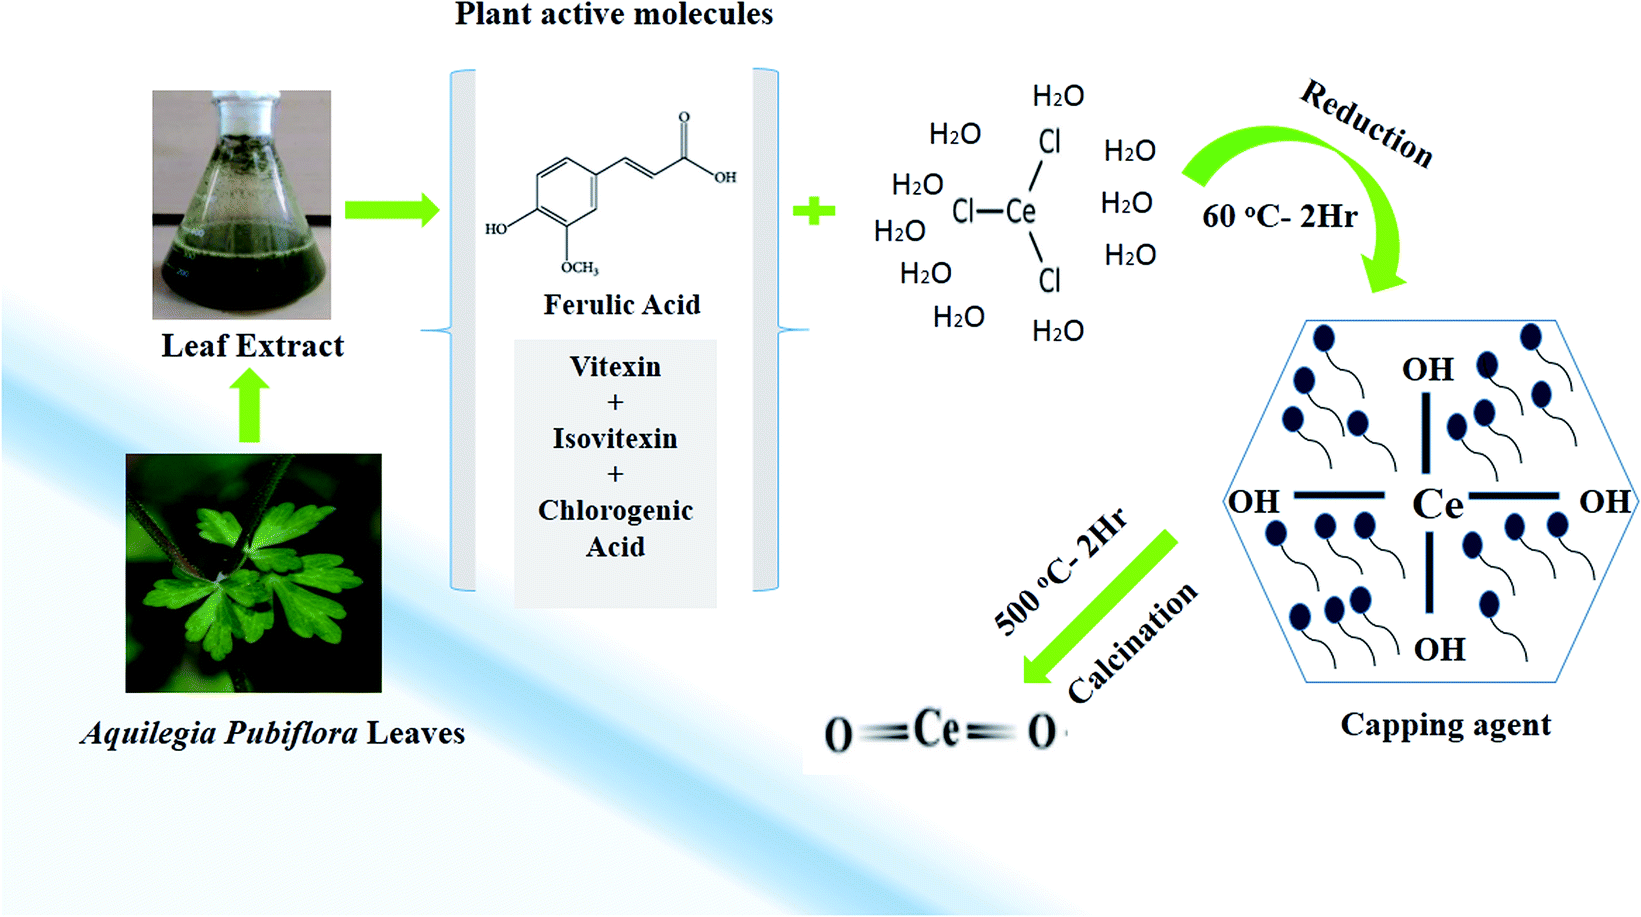 | ||
| Fig. 1 A graphical illustration of the generalized mechanism involved in the Aquilegia pubiflora mediated synthesis of the CeO2-NPs. | ||
| Compound | mUA min−1 | DW μg /g−1 |
|---|---|---|
| Vitexin | 0.7 | 3.72 |
| Isovitexin | 1.1 | 8.12 |
| Ferulic acid | 0.5 | 0.143 |
| Chlorogenic acid | 4.2 | 0.129 |
A total of four phytochemicals, including two flavonoids (vitexin and isovitexin) and two hydroxycinnamic acid derivatives (ferulic acid and chlorogenic acid), were detected and quantified, as shown in Fig. 1 and Table 1. After subsequent washing, drying, grinding and calcination steps, pale yellow CeO2-NP powder was obtained, which was stored in an airtight glass vial and labelled as CeO2-NPs. The sample was stored at room temperature and further used for physical characterization and investigating its various biological applications.
3.2. Physical and morphological characterization
One of the key characteristics of nanoscale materials is their optical properties. An optical study of CeO2 nanoparticles in ethanol was performed using a Schimadzu 1800 UV-vis spectrophotometer. The maximum absorption was observed at 298 nm, as shown in Fig. 2a. The Tauc plot method was used to calculate the band gap, as shown in Fig. 2b, and this was calculated to be 3.35 eV, which is very close to the value reported in the literature.27 The band gap depends upon various factors, including the grain size, oxygen deficiency, surface roughness, and lattice strain.28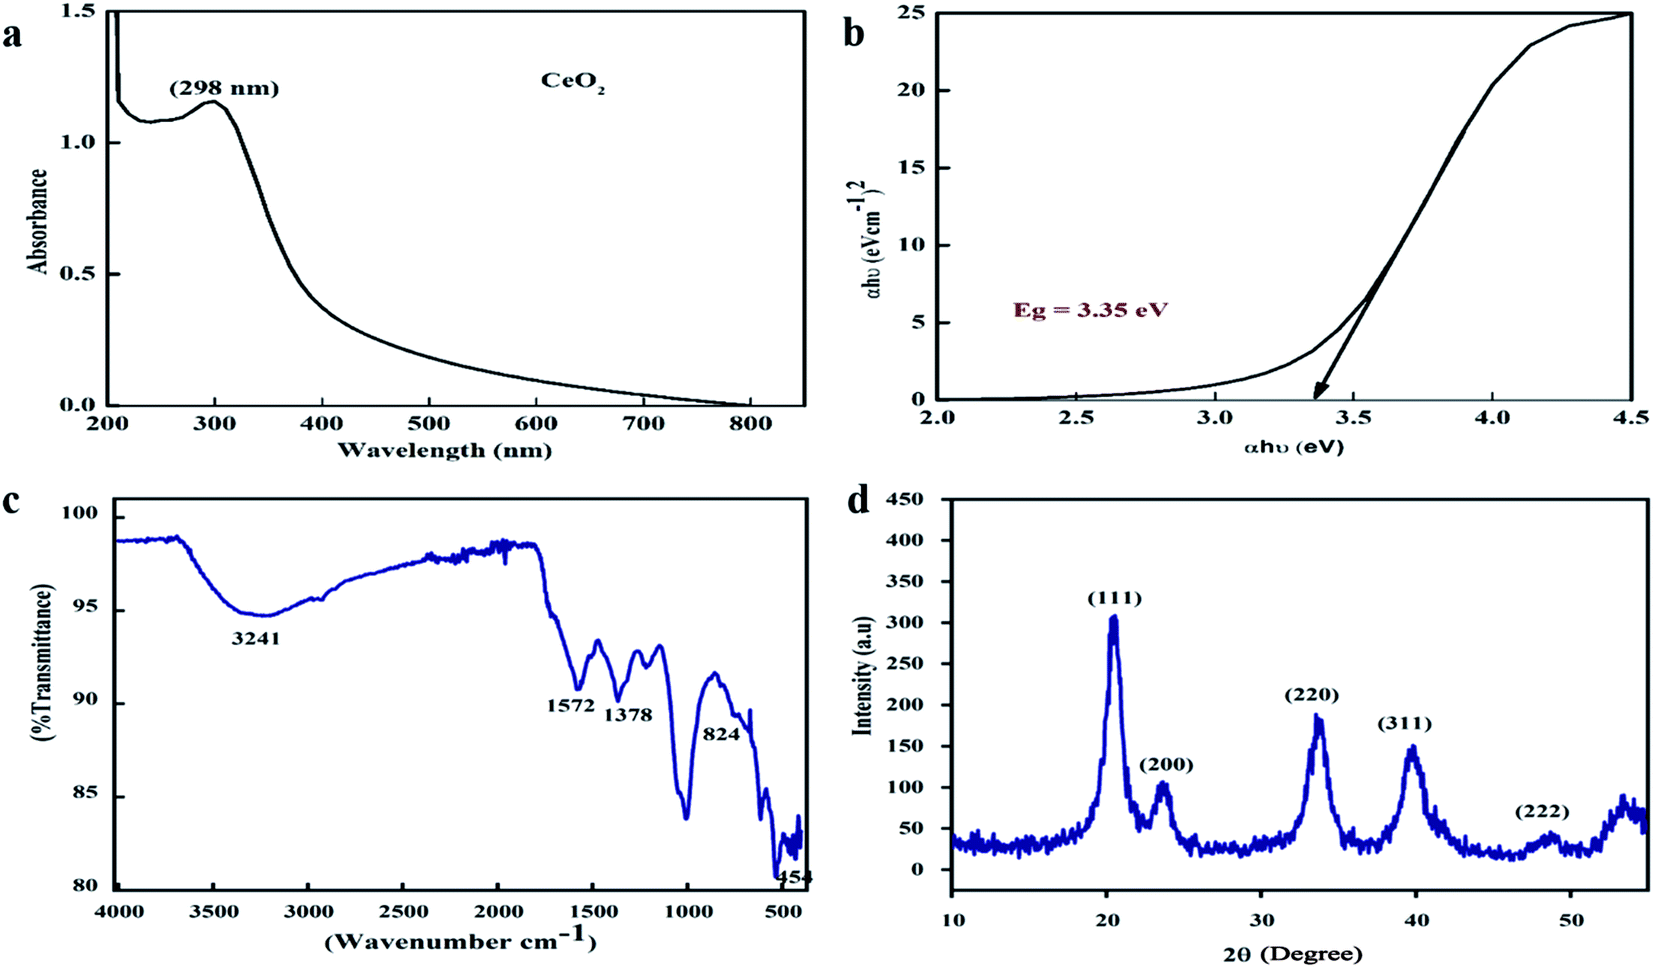 | ||
| Fig. 2 (a) UV-visible spectrum, (b) Tauc plot, (c) FTIR spectra, and (d) XRD pattern of the biosynthesized CeO2-NPs. | ||
FTIR spectroscopy studies were performed over the range of 400–4000 cm−1 to investigate the functional groups and chemical purity of the particles, as shown in Fig. 2c. A broad adsorption band arises in the range of 3241 cm−1, which is attributed to the presence of O–H functional groups due to water molecule residue and the formation of Ce(OH)3.29 The peak at 1572 cm−1 indicates the presence of C–O bands due to organic residue within the extract, the peaks at 1634 cm−1 and 1582 cm−1 arise from scissor bending of O–H groups and C![[double bond, length as m-dash]](https://www.rsc.org/images/entities/char_e001.gif) C bonds, and the peak at 1365 cm−1 is due to N–O stretching vibrations.30,31 Furthermore, the absorption bands at 824 cm−1 and 454.5 cm−1 correspond to Ce–O–Ce and Ce–O bond vibrations, respectively, which indicates the successful synthesis of CeO2-NPs.32
C bonds, and the peak at 1365 cm−1 is due to N–O stretching vibrations.30,31 Furthermore, the absorption bands at 824 cm−1 and 454.5 cm−1 correspond to Ce–O–Ce and Ce–O bond vibrations, respectively, which indicates the successful synthesis of CeO2-NPs.32
XRD analysis was performed to check the phase purity and crystallinity of the as-synthesized cerium oxide nanoparticles. As shown in Fig. 2d, the sample exhibited four dominant peaks, indexed as (111), (200), (220), and (311), which correspond to the cubic fluorite structure of CeO2 (JCPDS no. 89-8436), while a peak of low intensity was also observed as a (222) plane.33 No extra peaks were observed in the spectra that could undermine the purity of the nanoscale CeO2.
The morphological attributes of the greenly synthesized CeO2-NPs were examined using scanning electron microscopy (SEM) and transmission electron microscopy (TEM). SEM and TEM micrographs are presented in Fig. 3a and b. The micrographs show that the synthesized nanoparticles exhibit a homogenous phase with spherical morphology.
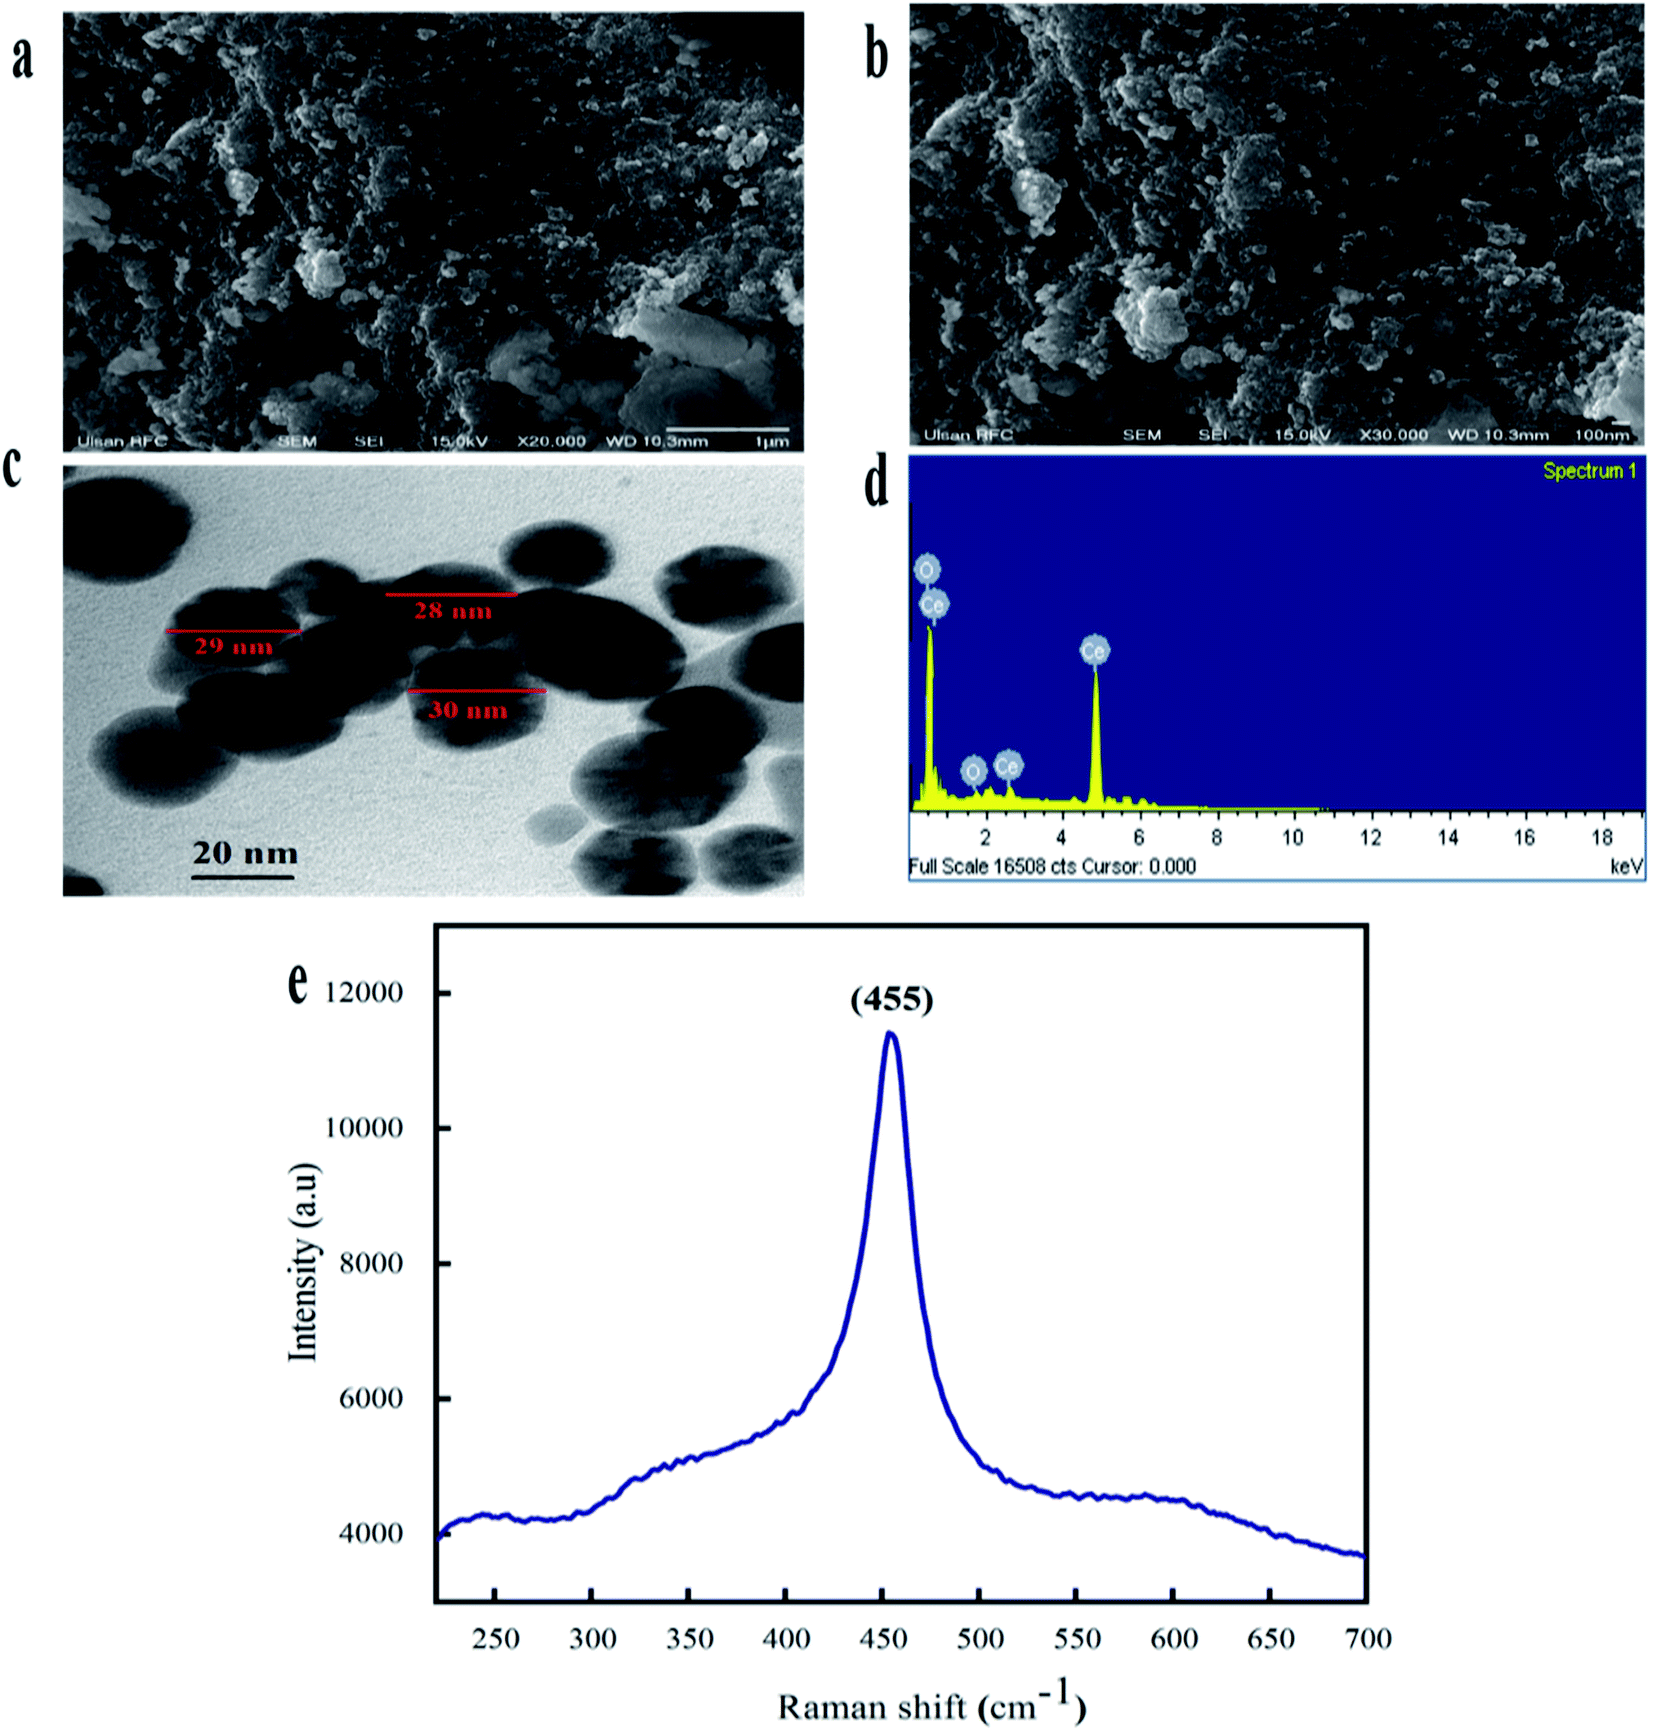 | ||
| Fig. 3 (a) A SEM micrograph with a 1 μm scale bar, (b) a SEM micrograph with a 100 nm scale bar, (c) a TEM micrograph with a 20 nm scale bar, (d) the EDX spectrum, and (e) the Raman spectrum of the biosynthesized CeO2-NPs. | ||
TEM analysis also confirmed the morphological features of the CeO2-NPs. The average particle size, as calculated via ImageJ from TEM micrographs, was found to be 28 nm. Similar morphologies of CeO2-NPs were also reported in previous studies.34
The elemental composition of the CeO2-NPs was determined through EDX analysis, as shown in Fig. 3d. The appearance of carbon is attributed to the grid support, while no other significant elements were found in the EDS spectrum apart from Ce and O, affirming the single-phase purity of the CeO2-NPs. The as-prepared sample showed weight% values of 73.84% for Ce and 26.16% for O. Raman spectroscopy showed a strong peak at 455 cm−1, as depicted in Fig. 3e. This single Raman band is accredited to the presence of a symmetrical stretching mode of Ce–O. The F2g vibration mode of the cubic structure of the CeO2-NPs corresponds to this recorded peak.35
The size distribution and zeta potential (ζ) of the biosynthesized CeO2-NPs were investigated using the dynamic light scattering (DLS) technique. The zeta potential (ζ) defines the colloidal stability and is a typical measurement of the surface charge on a particle. Suspensions that exhibits |ζ| ≥ 15 mV are generalized as stable colloids.36 In the study, the zeta potential of the CeO2-NPs in distilled water (DW) was measured as – 10.5 mV, and this can thus be considered a relatively stable colloidal solution. The zeta potential measurements thus verify and support the dispersion capacity of the greenly synthesized CeO2-NPs. The negative surface charge is due to the binding affinity of extract compounds with the NPs, conferring stability on the cerium nanoparticles and alleviating the aggregation potential of the particles.37 Moreover, size distribution measurements reveal the average size of the particles to be 86.45 nm. The size distribution graph shows that the particle size is polydispersed and larger compared to that obtained from SEM observations (Fig. 4b). The increased size of the CeO2-NPs measured via DLS is due to the bias of the technique towards the measurement of larger particles (or even aggregates).36
 | ||
| Fig. 4 (a) The zeta potential distribution of the CeO2-NPs and (b) the size distribution by intensity of the CeO2-NPs. | ||
3.3. Biological applications
| Pathogenic bacteria | CeO2-NPs | ||||
|---|---|---|---|---|---|
| 5 mg mL−1 | 4 mg mL−1 | 2 mg mL−1 | 1 mg mL−1 | 500 μg mL−1 | |
| a *: highly significant; **: slightly significant; and ***: non-significant difference from the control at P < 0.05 via one-way ANOVA; values are mean ± SD of triplicate measurements. | |||||
| E. coli | 7.11 ± 0.34** | 6.81 ± 0.24*** | 6.36 ± 0.29*** | 5.86 ± 0.39*** | 4.17 ± 0.31*** |
| S. epidermidis | 6.81 ± 0.24*** | 6.21 ± 0.41*** | 5.18 ± 0.22*** | 5.11 ± 0.33*** | 3.11 ± 0.43*** |
| K. pneumonia | 6.36 ± 0.29*** | 5.09 ± 0.39*** | 5.06 ± 0.31*** | 4.48 ± 0.28*** | 3.29 ± 0.41*** |
| P. aeruginosa | 6.17 ± 0.21*** | 4.19 ± 0.34*** | 3.81 ± 0.27*** | 3.72 ± 0.34*** | 3.34 ± 0.31*** |
| B. subtilis | 5.86 ± 0.39*** | 4.27 ± 0.29*** | 3.78 ± 0.19*** | 3.51 ± 0.28*** | 3.14 ± 0.28*** |
| Positive control (ampicillin) | 9.81 ± 0.33 | 10.11 ± 0.41 | 8.91 ± 0.34 | 8.28 ± 0.29 | 8.31 ± 0.38 |
| Pathogenic fungi | CeO2-NPs | ||||
|---|---|---|---|---|---|
| 5 mg mL−1 | 4 mg mL−1 | 2 mg mL−1 | 1 mg mL−1 | 500 μg mL−1 | |
| a *: highly significant; **: slightly significant; and ***: non-significant difference from the control at P < 0.05 via one-way ANOVA; values are mean ± SD of triplicate measurements. | |||||
| A. niger | 15.1 ± 0.27* | 11.3 ± 0.33*** | 7.5 ± 0.16*** | 4.2 ± 0.11*** | 3.3 ± 0.12*** |
| M. racemosus | 13.9 ± 0.29** | 8.3 ± 0.31*** | 5.2 ± 0.23*** | 3.8 ± 0.17*** | 3.1 ± 0.14*** |
| F. solani | 11.4 ± 0.29** | 8.1 ± 0.22*** | 5.7 ± 0.19*** | 3.7 ± 0.13*** | 3.1 ± 0.11*** |
| A. flavus | 10.1 ± 0.31*** | 7.2 ± 0.19*** | 6.4 ± 0.11*** | 4.7 ± 0.16*** | 4.1 ± 0.15*** |
| A. fumegatus | 11.9 ± 0.24** | 7.4 ± 0.24*** | 5.7 ± 0.14*** | 5.1 ± 0.19*** | 3.2 ± 0.18*** |
| Positive control (amphotericin B) | 15.8 ± 0.44 | 15.4 ± 0.42 | 14.8 ± 0.38 | 15.1 ± 0.36 | 14.8 ± 0.41 |
000 deaths each year.45 Due to inappropriate vectors and inefficient and unaffordable drugs, the disease is at high risk of uncontrolled spreading. Recently, metal oxide nanoparticle (oxides of zinc, silver, titanium and magnesium) based treatments have gained popularity because of their significant cytotoxic potential against Leishmania.46 However, biosynthesized CeO2-NPs have been rarely explored for their cytotoxicity against the parasite Leishmania tropica (KWH23). In our study, CeO2-NP formulations in the concentration range of 12.5–200 μg mL−1 were investigated via MTT cytotoxic assays against promastigote and amastigote axenic cultures of Leishmania tropica. A dose-dependent cytotoxic effect from the CeO2-NPs was observed, as presented in Fig. 5a. At the highest concentration of 200 μg mL−1, the test sample showed a highest percentage inhibition of 58.11 ± 1.19% against the amastigote form and 61.39 ± 1.73% against the promastigote form of the parasite. The lowest mortality rates observed were 16.43 ± 1.34% and 14.07 ± 1.69% at a tested concentration of 12.5 μg mL−1. The IC50 values were calculated as 170 μg mL−1 for the amastigote form and 130 μg mL−1 for the promastigote form. Most studies have shown that metal oxide NPs of smaller size have greater efficacy in inhibiting Leishmania by generating more ROS, which induces the process of apoptosis.47–49 It has been well documented that Leishmania parasites are very sensitive toward ROS, and any agent that has the ability to produce or induce ROS would be considered as a promising leishmanicidal agent.50
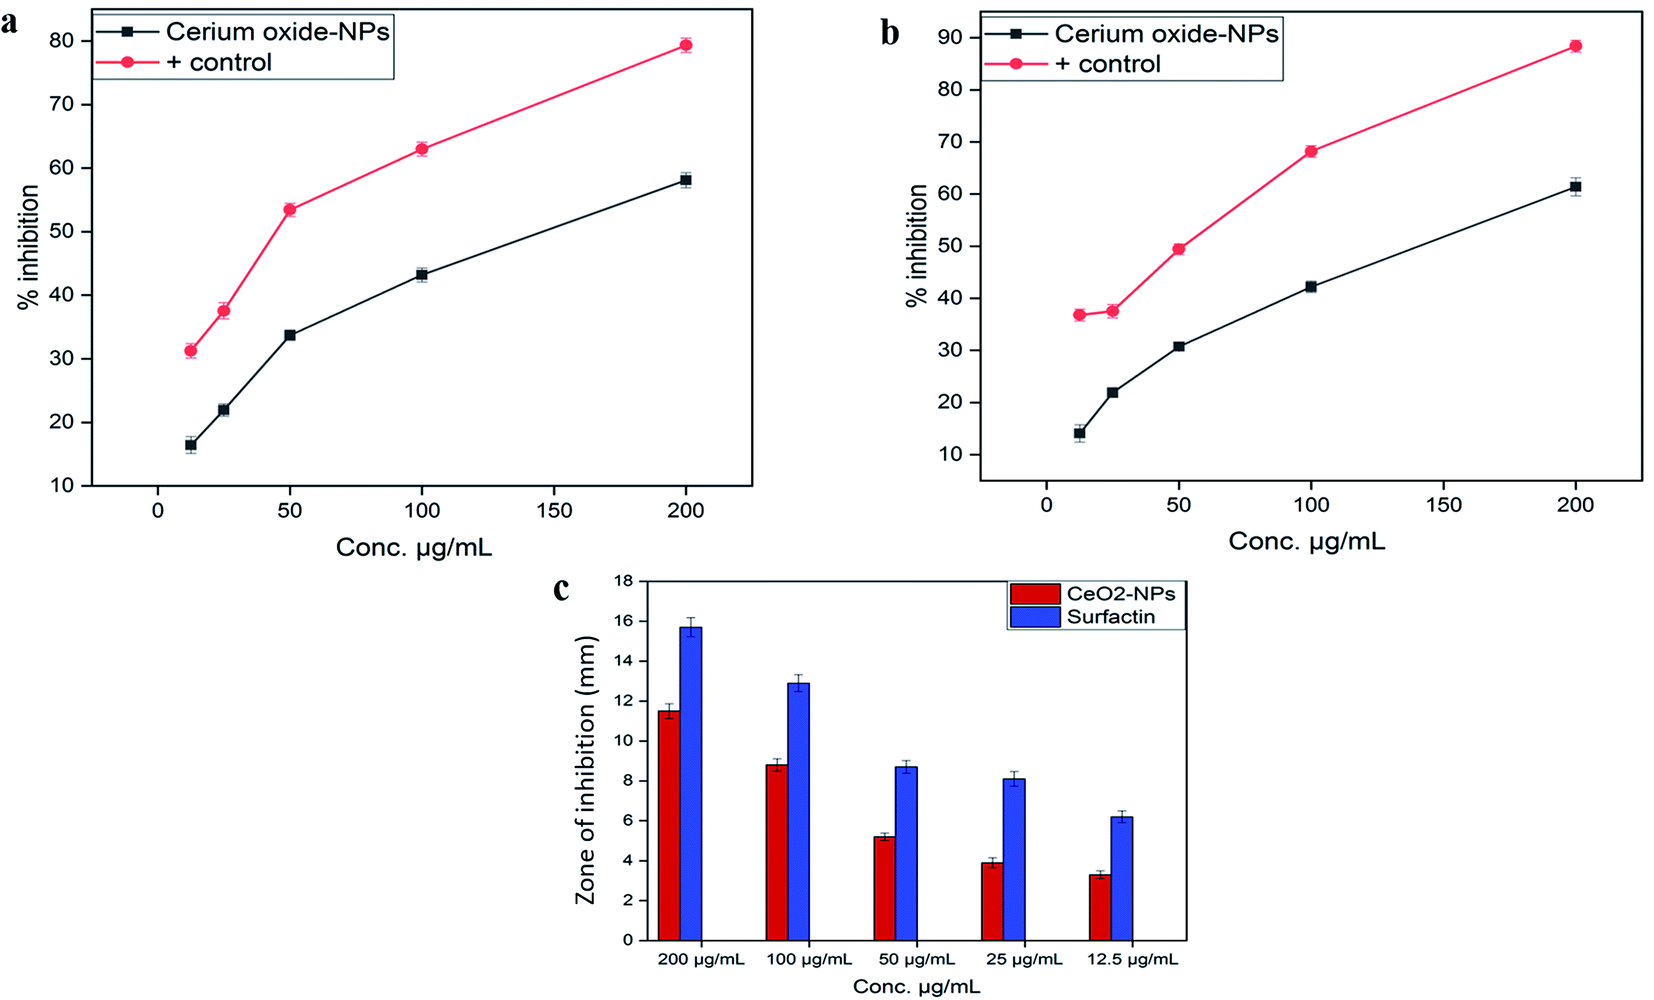 | ||
| Fig. 5 (a) A graphical illustration of the cytotoxic potential of the biosynthesized CeO2-NPs against the amastigote form of Leishmania tropica (KWH23), (b) a graphical presentation of the cytotoxic potential of the biosynthesized CeO2-NPs against the promastigote form of Leishmania tropica (KWH23), and (c) a graphical presentation of the protein kinase inhibition activity of Aquilegia pubiflora synthesized CeO2-NPs. | ||
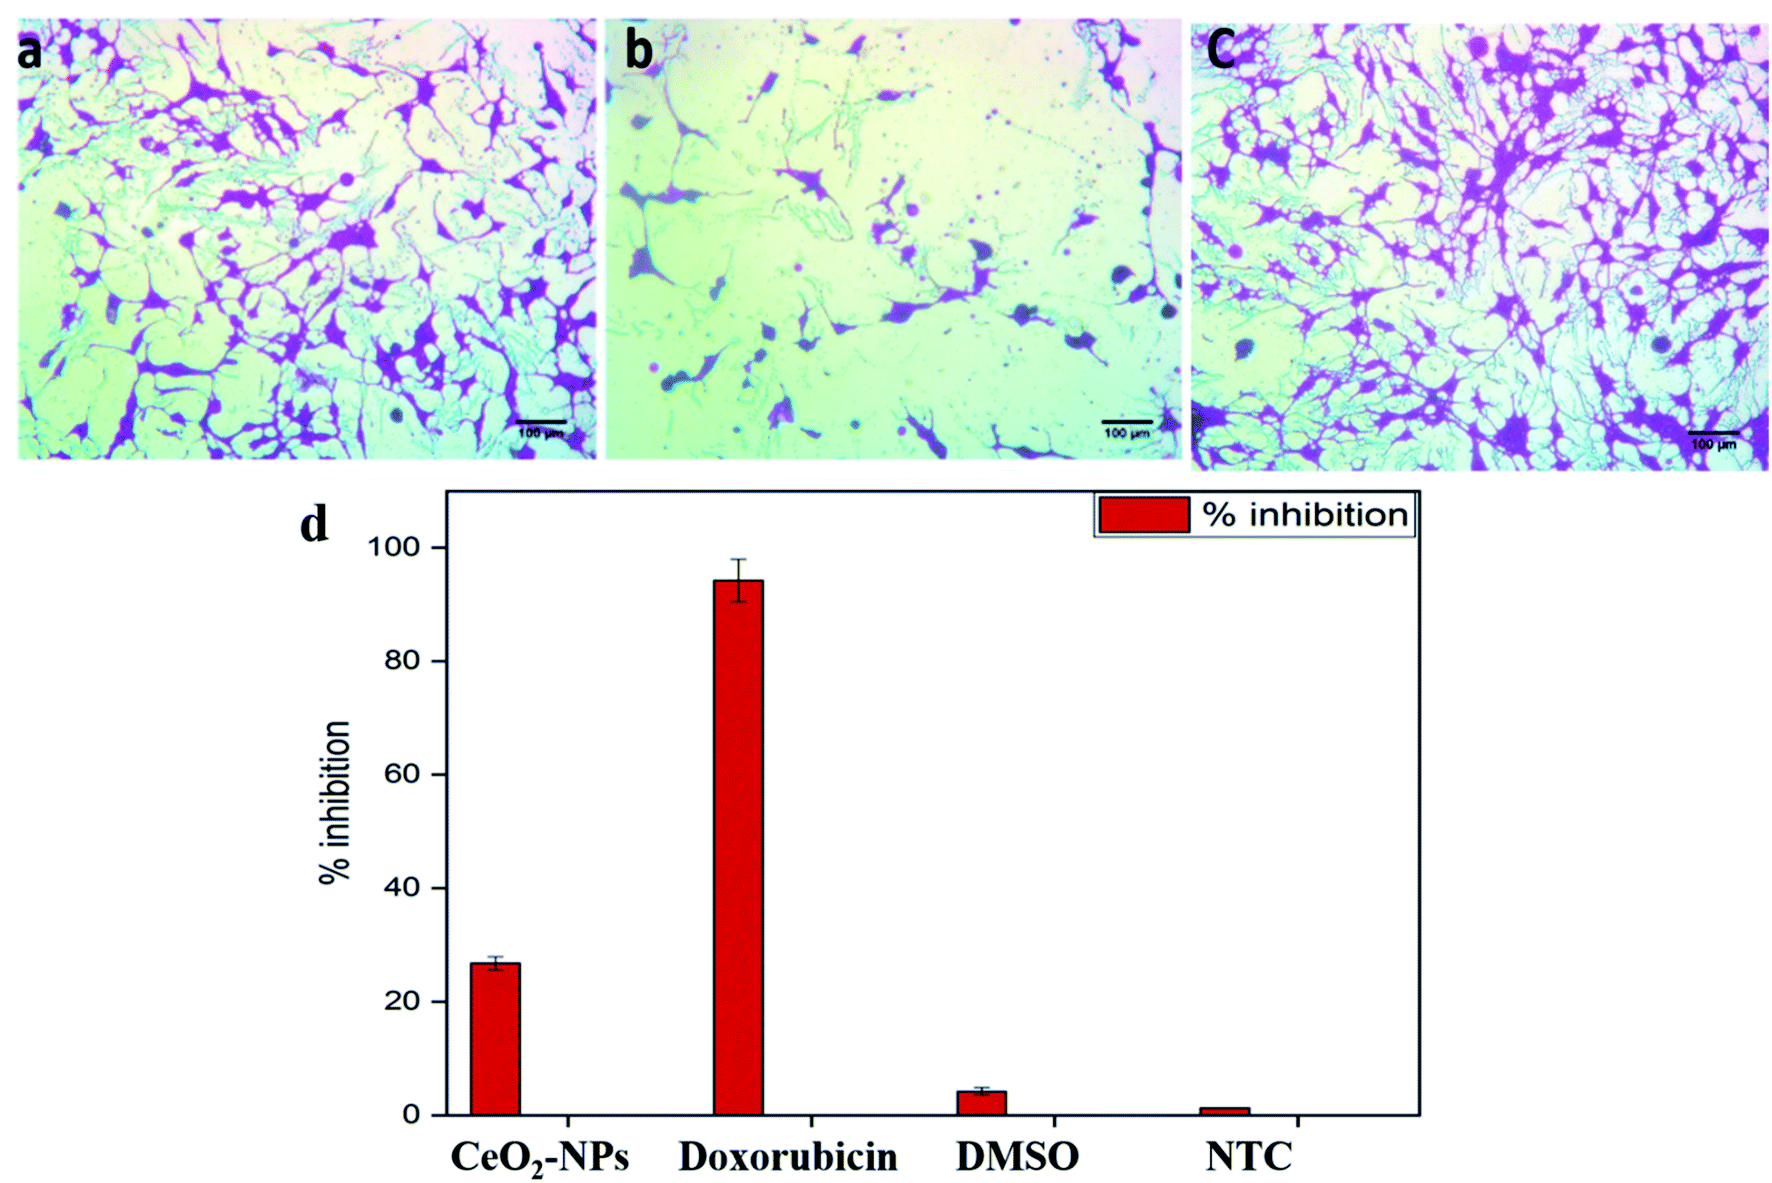 | ||
| Fig. 6 Microscopic images of HepG2 cells showing (a) CeO2-NP-treated cells, (b) DOX-treated cells, and (c) NTC. Cells were treated with 100 μg mL−1 NPs for 24 h; untreated cells and doxorubicin (30 μM) were included as controls; magnification = 200×; scale bar = 100 μm. (d) A graphical representation of the cytotoxic potential of the biosynthesized CeO2-NPs against the HepG2 cell line at 100 μg mL−1. | ||
| Conc. (μg mL−1) | α-Amylase | α-Glucosidase | ||
|---|---|---|---|---|
| CeO2-NPs | Acarbose | CeO2-NPs | Acarbose | |
| 200 | 39 ± 0.24 | 89.40 ± 1.24 | 31.2 ± 0.49 | 84.34 ± 1.92 |
| 100 | 27.3 ± 0.31 | 73.20 ± 1.51 | 21.6 ± 0.33 | 65.98 ± 1.67 |
| 50 | 21.1 ± 0.19 | 59.43 ± 1.09 | 13.9 ± 0.24 | 53.45 ± 1.11 |
| 25 | 12.4 ± 0.17 | 44.87 ± 0.93 | 7.2 ± 0.16 | 23.4 ± 1.27 |
| 12.5 | 5.9 ± 0.11 | 27.78 ± 0.66 | 0 | 17.32 ± 0.73 |
| Conc. (μg mL−1) | TAC (μg AAE per mg) | TRP (μg AAE per mg) | ABTS (TEAC) | DPPH (% FRSA) |
|---|---|---|---|---|
| 200 | 52.71 ± 1.14 | 87.06 ± 1.24 | 74.21 ± 2.64 | 38.72 ± 1.38 |
| 100 | 34.64 ± 1.32 | 59.05 ± 0.98 | 63.31 ± 1.99 | 24.33 ± 1.2 |
| 50 | 26.39 ± 0.84 | 52.43 ± 0.92 | 54.48 ± 2.25 | 21.18 ± 1.74 |
| 25 | 21.51 ± 0.71 | 31.87 ± 0.95 | 39.71 ± 2.21 | 12.32 ± 0.97 |
| 12.5 | 16.93 ± 1.22 | 27.64 ± 1.13 | 21.90 ± 1.91 | 9.61 ± 1.82 |
| S. no. | Concentration (μg mL−1) | % Hemolysis |
|---|---|---|
| 1 | 400 | 1.74 ± 0.12 |
| 2 | 200 | 1.15 ± 0.18 |
| 3 | 100 | 0.62 ± 0.20 |
| 4 | 50 | 0.28 ± 0.20 |
4. Conclusions
In the study, we have demonstrated, for the first time, the use of the medicinally important plant Aquilegia pubiflora in the synthesis of highly biocompatible CeO2-NPs with diverse biomedical applications. A green chemistry approach was followed, which is highly facile, economical and ecofriendly. The synthesized particles exhibited high stability, purity, and spherical morphology, with an average size of 28 nm. The nanoparticles had average bactericidal properties but exhibited excellent antifungal potential, especially against Aspergillus niger and Mucor racemosus. The particles were also found to be highly active against both the amastigote (IC50: 114 μg mL−1) and promastigote (IC50: 97 μg mL−1) forms of the leishmanial parasite Leishmania tropica (KWH23). Moreover, considerable anticancer potential was shown against hepatocarcinoma (the HepG2 cell line). Hemocompatibility studies revealed that the NPs were highly compatible with human red blood cells. Our study thus concludes that the synthesized Aquilegia pubiflora based CeO2-NPs are highly biocompatible and show promising potential for use in alternative leishmaniasis and cancer therapeutics. Moreover, their considerable antimicrobial and antioxidant potential mean these CeO2-NPs could be novel nanotools for diverse biomedical applications.Ethical approval
This article does not contain any direct studies on human participants and animals. The experiment was performed in compliance with the relevant laws and institutional guidelines of Bacha Khan University, Charsadda with prior approval from the ethical committee. Only the RBC haemolysis assay includes the use of a human blood sample and was performed with donor consent and according to institutional guidelines.Conflicts of interest
The authors declare no competing interests.Acknowledgements
The authors wish to thank Dr Mushtaq Ahmad (Associate Professor, Department of Plant Sciences, Quaid-i-Azam University) for the identification and verification of the plants used.References
- C. Walkey, S. Das, S. Seal, J. Erlichman, K. Heckman, L. Ghibelli, E. Traversa, J. F. McGinnis and W. T. Self, Environ. Sci.: Nano, 2015, 2, 33–53 RSC.
- F. Charbgoo, M. Ramezani and M. Darroudi, Biosens. Bioelectron., 2017, 96, 33–43 CrossRef CAS PubMed.
- S. Rajeshkumar and P. Naik, Biotechnol. Rep., 2018, 17, 1–5 CrossRef CAS PubMed.
- C. E. Castano, M. J. O'Keefe and W. G. Fahrenholtz, Curr. Opin. Solid State Mater. Sci., 2015, 19, 69–76 CrossRef CAS.
- F. Caputo, M. Mameli, A. Sienkiewicz, S. Licoccia, F. Stellacci, L. Ghibelli and E. Traversa, Sci. Rep., 2017, 7, 4636 CrossRef.
- S. Rojas, J. D. Gispert, S. Abad, M. Buaki-Sogo, V. M. Victor, H. Garcia and J. R. l. Herance, Mol. Pharm., 2012, 9, 3543–3550 CrossRef CAS.
- H. Zhang, X. He, Z. Zhang, P. Zhang, Y. Li, Y. Ma, Y. Kuang, Y. Zhao and Z. Chai, Environ. Sci. Technol., 2011, 45, 3725–3730 CrossRef CAS.
- P. Demokritou, S. Gass, G. Pyrgiotakis, J. M. Cohen, W. Goldsmith, W. McKinney, D. Frazer, J. Ma, D. Schwegler-Berry and J. Brain, Nanotoxicology, 2013, 7, 1338–1350 CrossRef CAS PubMed.
- M. Hirano, Y. Fukuda, H. Iwata, Y. Hotta and M. Inagaki, J. Am. Ceram. Soc., 2000, 83, 1287–1289 CrossRef CAS.
- H.-W. He, X.-Q. Wu, W. Ren, P. Shi, X. Yao and Z.-T. Song, Ceram. Int., 2012, 38, S501–S504 CrossRef CAS.
- M. Darroudi, M. Sarani, R. K. Oskuee, A. K. Zak and M. S. Amiri, Ceram. Int., 2014, 40, 2863–2868 CrossRef CAS.
- P. Thatoi, R. G. Kerry, S. Gouda, G. Das, K. Pramanik, H. Thatoi and J. K. Patra, J. Photochem. Photobiol. B Biol., 2016, 163, 311–318 CrossRef CAS.
- M. J. Ahmed and G. Murtaza, J. Ethnopharmacol., 2015, 159, 209–214 CrossRef.
- I. Hussain, A. Bano and F. Ullah, Pak. J. Bot., 2011, 43, 79–84 Search PubMed.
- M. Adnan, S. Begum, A. L. Khan, A. M. Tareen and I.-J. Lee, J. Med. Plants Res., 2012, 6, 4113–4127 Search PubMed.
- M. Morais and F. Namouni, Mon. Not. Roy. Astron. Soc. Lett., 2013, 436, L30–L34 CrossRef.
- M. Shah, S. Nawaz, H. Jan, N. Uddin, A. Ali, S. Anjum, N. Giglioli-Guivarc'h, C. Hano and B. H. Abbasi, Mater. Sci. Eng., C, 2020, 110889 CrossRef CAS PubMed.
- K. Ahmad, A. talha Khalil and R. Somayya, J. Tradit. Chin. Med., 2016, 36, 794–798 CrossRef.
- A. Ahmad, F. Syed, A. Shah, Z. Khan, K. Tahir, A. U. Khan and Q. Yuan, RSC Adv., 2015, 5, 73793–73806 RSC.
- S. Mushtaq, B. Uzair, A. Hameed, A. U. Khayam, S. Irum, K. Shahzad, B. A. Khan, M. Ismail, N. Ahmad and R. Abbasi, Arabian J. Sci. Eng., 2019, 1–14 Search PubMed.
- C. Hano, S. Renouard, R. Molinié, C. Corbin, E. Barakzoy, J. Doussot, F. Lamblin and E. Lainé, Bioorg. Med. Chem. Lett, 2013, 23, 3007–3012 CrossRef CAS.
- S. S. Zahra, M. Ahmed, M. Qasim, B. Gul, M. Zia, B. Mirza and I.-u. Haq, BMC Compl. Alternative Med., 2017, 17, 443 CrossRef.
- D. Tagliazucchi, E. Verzelloni, D. Bertolini and A. Conte, Food Chem., 2010, 120, 599–606 CrossRef CAS.
- N. Matinise, X. Fuku, K. Kaviyarasu, N. Mayedwa and M. Maaza, Appl. Surf. Sci., 2017, 406, 339–347 CrossRef CAS.
- W. Bylka, M. Szaufer-Hajdrych, I. Matławska and O. Goślińska, Lett. Appl. Microbiol., 2004, 39, 93–97 CrossRef CAS PubMed.
- S. Mushtaq, M. A. Aga, P. H. Qazi, M. N. Ali, A. M. Shah, S. A. Lone, A. Shah, A. Hussain, F. Rasool and H. Dar, J. Ethnopharmacol., 2016, 178, 9–12 CrossRef CAS.
- M. M. Ali, H. S. Mahdi, A. Parveen and A. Azam, AIP Conf. Proc., 2018, 1953, 030044 CrossRef.
- F.-H. Wang and C.-L. Chang, Appl. Surf. Sci., 2016, 370, 83–91 CrossRef CAS.
- B. Rohini, H. Nagabhushana, G. Darshan, R. Basavaraj, S. Sharma, P. Amudha, M. Rahul and B. D. Prasad, J. Alloys Compd., 2017, 724, 897–909 CrossRef CAS.
- S. R. Ali, R. Kumar, S. K. Kadabinakatti and M. C. Arya, Mater. Res. Express, 2018, 6, 025513 CrossRef.
- Q. Maqbool, M. Nazar, S. Naz, T. Hussain, N. Jabeen, R. Kausar, S. Anwaar, F. Abbas and T. Jan, Int. J. Nanomed., 2016, 11, 5015 CrossRef CAS PubMed.
- T. Surendra and S. M. Roopan, J. Photochem. Photobiol. B Biol., 2016, 161, 122–128 CrossRef CAS PubMed.
- P. Eriksson, A. A. Tal, A. Skallberg, C. Brommesson, Z. Hu, R. D. Boyd, W. Olovsson, N. Fairley, I. A. Abrikosov and X. Zhang, Sci. Rep., 2018, 8, 6999 CrossRef.
- A. Arumugam, C. Karthikeyan, A. S. H. Hameed, K. Gopinath, S. Gowri and V. Karthika, Mater. Sci. Eng., C, 2015, 49, 408–415 CrossRef CAS.
- S. Munusamy, K. Bhakyaraj, L. Vijayalakshmi, A. Stephen and V. Narayanan, International Journal of Innovative Research in Science, Engineering and Technology, 2014, 2, 318–323 Search PubMed.
- M. M. Modena, B. Rühle, T. P. Burg and S. Wuttke, Adv. Mater., 2019, 31, 1901556 CrossRef PubMed.
- K. Vimala, S. Sundarraj, M. Paulpandi, S. Vengatesan and S. Kannan, Process Biochem., 2014, 49, 160–172 CrossRef CAS.
- E. Martens and A. L. Demain, J. Antibiot., 2017, 70, 520 CrossRef CAS PubMed.
- Y. N. Slavin, J. Asnis, U. O. Häfeli and H. Bach, J. Nanobiotechnol., 2017, 15, 65 CrossRef PubMed.
- R. Prasad and G. Rattan, Bull. Chem. React. Eng. Catal., 2010, 5, 7 CrossRef CAS.
- R. Brayner, R. Ferrari-Iliou, N. Brivois, S. Djediat, M. F. Benedetti and F. Fiévet, Nano Lett., 2006, 6, 866–870 CrossRef CAS.
- T. Xia, M. Kovochich, M. Liong, L. Madler, B. Gilbert, H. Shi, J. I. Yeh, J. I. Zink and A. E. Nel, ACS Nano, 2008, 2, 2121–2134 CrossRef CAS.
- N. G. Howlett and S. V. Avery, Appl. Environ. Microbiol., 1997, 63, 2971–2976 CrossRef CAS.
- G.-X. Tong, F.-F. Du, Y. Liang, Q. Hu, R.-N. Wu, J.-G. Guan and X. Hu, J. Mater. Chem. B, 2013, 1, 454–463 RSC.
- M. Akbari, A. Oryan and G. Hatam, Acta Trop., 2017, 172, 86–90 CrossRef CAS PubMed.
- A. Jebali and B. Kazemi, Toxicol In Vitro, 2013, 27, 1896–1904 CrossRef CAS PubMed.
- A. Ahmad, Y. Wei, F. Syed, S. Khan, G. M. Khan, K. Tahir, A. U. Khan, M. Raza, F. U. Khan and Q. Yuan, J. Photochem. Photobiol. B Biol., 2016, 161, 17–24 CrossRef CAS.
- V. Kumar, R. K. Gundampati, D. K. Singh, M. V. Jagannadham, S. Sundar and S. H. Hasan, J. Ind. Eng. Chem., 2016, 37, 224–236 CrossRef CAS.
- Y. Li, W. Zhang, J. Niu and Y. Chen, ACS Nano, 2012, 6, 5164–5173 CrossRef CAS PubMed.
- H. W. Murray, J. Exp. Med., 1981, 153, 1302–1315 CrossRef CAS.
- P.-H. Lu, M.-B. Chen, C. Ji, W.-T. Li, M.-X. Wei and M.-H. Wu, Oncotarget, 2016, 7, 45889 CrossRef PubMed.
- J. D. Yang, P. Hainaut, G. J. Gores, A. Amadou, A. Plymoth and L. R. Roberts, Nat. Rev. Gastroenterol. Hepatol., 2019, 1–16 Search PubMed.
- E. Nourmohammadi, H. Khoshdel-sarkarizi, R. Nedaeinia, H. R. Sadeghnia, L. Hasanzadeh, M. Darroudi and R. Kazemi oskuee, J. Cell. Physiol., 2019, 234, 4987–4996 CrossRef CAS PubMed.
- A. Asati, S. Santra, C. Kaittanis and J. M. Perez, ACS Nano, 2010, 4, 5321–5331 CrossRef CAS PubMed.
- P. Zimmet, K. G. Alberti, D. J. Magliano and P. H. Bennett, Nat. Rev. Endocrinol., 2016, 12, 616 CrossRef PubMed.
- S. Nair, A. Kumari, J. Subramonianpillai, D. Shabna, S. Kumar, S. Balakrishnan, B. Naik, A. Kumar, P. Isaakidis and S. Satyanarayana, Public Health Action, 2013, 3, 38–42 CrossRef.
- N. Pellegrini, M. Serafini, B. Colombi, D. Del Rio, S. Salvatore, M. Bianchi and F. Brighenti, J. Nutr., 2003, 133, 2812–2819 CrossRef CAS.
- D. Prakash, S. Suri, G. Upadhyay and B. N. Singh, Int. J. Nutr. Food Sci., 2007, 58, 18–28 CrossRef CAS PubMed.
- S. Dudonne, X. Vitrac, P. Coutiere, M. Woillez and J.-M. Merillon, J. Agric. Food Chem., 2009, 57, 1768–1774 CrossRef CAS.
- B. C. Evans, C. E. Nelson, S. Y. Shann, K. R. Beavers, A. J. Kim, H. Li, H. M. Nelson, T. D. Giorgio and C. L. Duvall, J. Visualized Exp., 2013, e50166 Search PubMed.
- K. Amin and R. M. Dannenfelser, J. Pharmaceut. Sci., 2006, 95, 1173–1176 CrossRef CAS PubMed.
| This journal is © The Royal Society of Chemistry 2020 |