 Open Access Article
Novel fabrication of PSSAMA_Na capped silver nanoparticle embedded sodium alginate membranes for pervaporative dehydration of bioethanol
Akshay S. Kulkarnia,
Ashok M. Sajjan *a,
Ashwini Mb,
Nagaraj R. Banapurmath
 c,
Narasimha H. Ayachitc and
Geeta G. Shirnallib
aDepartment of Chemistry, KLE Technological University, Hubballi 580031, India. E-mail: ashokmsajjan@gmail.com
bDepartment of Food and Industrial Microbiology, University of Agricultural Sciences, Dharwad 580 005, India
cCenter for Material Science, KLE Technological University, Hubballi 580031, India
First published on 12th June 2020
Abstract
Polystyrene-4-sulfonic acid co maleic acid sodium salt (PSSAMA_Na) capped silver nanoparticle (Ag_Np) embedded sodium alginate (Na-Alg) nanocomposite membranes have been developed to improve the pervaporation (PV) dehydration of bioethanol. The effect of PSSAMA_Na capped Ag_Nps on the micro-morphology, physicochemical properties and separation performance of the derived membranes was analyzed as a function of temperature at the azeotropic composition of the bioethanol–water mixture. WAXD analysis shows a decrease in crystalline domains with the increase in PSSAMA_Na capped Ag_Nps content and confirms the presence of Ag_Nps. DSC analysis demonstrated that the hydrophilic nature enhances as the PSSAMA_Na capped Ag_Nps content increases in the membrane matrix. Further, both total permeation flux and separation selectivity were increased with an increase in PSSAMA_Na capped Ag_Nps content. The results revealed that the membrane with 3 mass% of PSSAMA_Na capped Ag_Nps exhibited the highest permeation flux (13.40 × 10⁻² kg m−2 h−1) and separation selectivity (11![[thin space (1/6-em)]](https://www.rsc.org/images/entities/char_2009.gif) 406) at 30 °C which indicate its better PV performance. The total permeation flux and permeation flux of water values were close to each other, which confirms that the membranes can be efficiently used to remove the water from azeotropic aqueous bioethanol.
406) at 30 °C which indicate its better PV performance. The total permeation flux and permeation flux of water values were close to each other, which confirms that the membranes can be efficiently used to remove the water from azeotropic aqueous bioethanol.
1. Introduction
Ethanol is one of the most versatile natural solvents, and is miscible with water and many other organic solvents.1,2 Bioethanol is also the principle fuel used as a petroleum substitute for road transport vehicles. It is the most well-known biofuel and is mostly a product of corn or sugarcane, and can be produced easily from biomass by fermentation.3–5The azeotropic composition of aqueous bioethanol is 4% by mass. Bioethanol can be purified by distillation, adsorption, liquid–liquid extraction, and crystallization, which are often inefficient and uneconomic.6,7 The shortcoming of these processes is that energy consumption is rather high, especially when the azeotropic composition is reached. Instead, the petrochemical industries are now considering pervaporation as a potential candidate to take up the increasing worldwide challenge of aromatics removal from gasoline, which remains one of the important issues concerning public health.
Pervaporation (PV), in its simplest type, is an association of lower energy consuming and an economical combination of membrane permeation and evaporation.8,9 It is a membrane separation process, which uses a dense polymeric membrane for selective permeation of one or more components from a liquid mixture. In the process, the liquid mixture is kept in direct contact with one side of the membrane, and the permeated product (pervaporate) is removed in the form of vapor and condensed.
The productivity and success of the pervaporation process largely depend on the fabrication of suitable membranes with high permeability, good selectivity, and sufficient mechanical strength. Particularly, for the dehydration of alcohols, new membrane materials containing hydrophilic groups are usually preferred. In dehydration of alcohols through pervaporation, poly(vinyl alcohol),10 sodium alginate,11 chitosan12,13 are the most preferred membrane materials, as they possess not only excellent hydrophilicity but also good film-forming ability.
Amid numerous polymeric materials for pervaporation, sodium alginate (Na-Alg) is natural and cost-effective polymer material proposed for alcohol–water separation considering the fact that it is hydrophilic and semi-crystalline in nature along with good membrane-forming ability, chemical-inertness, and thermal stability.14
However, owing to very high hydrophilic nature, Na-Alg membranes usually offer good permeation flux but less separation selectivity as a consequence of too much swelling, which limits the performance of these membranes in PV separations. To overcome this, sodium alginate requires alteration to achieve better selectivity towards the water. Several modification methods such as cross-linking, grafting,15 blending and incorporation of nanoparticles have been in use.16
Nano-materials have exceptional properties of strength, high surface area, thermal stability, optical activity, thermal and electrical conductivity, thereby resulting in many potential applications.17–19 A literature survey reveals that by incorporating nano-materials in the membrane matrix, membrane properties like permeability, selectivity, and stability can be enhanced to achieve the excellent separation of bioethanol and water.20–22
In view of this, an attempt has been made to fabricate membranes for bioethanol dehydration by adding different fractions of polystyrene-4-sulfonic acid co maleic acid sodium salt (PSSAMA_Na) capped silver nanoparticles (Ag_Nps) in sodium alginate (Na-Alg) matrix. Increment in both separation selectivity and permeation flux at the same time is not commonly observed in PV due to the tradeoff phenomenon. Ag_Nps are not only hydrophilic property but also have anti bacterial properties which can contribute to the shelf life of the membranes. Materials like chitosan, methoxypolyethelene glycol, starch and even sodium alginate are used as stabilizer for Ag_Nps but the purpose of choosing PSSAMA_Na is that it has functional groups like –COO− and –SO−3 which contribute to enhance the hydrophilicity of the membranes. Further, –SO−3 groups also act as the capping agents to form ionic clusters with the Ag_Nps and –COO− groups cross-link with the –OH groups of Na-Alg.23 This makes the membranes more selective towards water as well as contributes in the enhancement of permeation flux. To examine the changes in the peak intensities of the FTIR relating to the fraction of PSSAMA_Na capped Ag_Nps in the Na-Alg matrix, the FTIR spectra were recorded by keeping the amount of KBr and the membrane sample constant. To investigate the physicochemical properties of the resulting films thoroughly, they are characterized using WAXD, DSC, SEM, UTM and contact angle meter. Further, the effect of the content of PSSAMA_Na capped Ag_Nps and temperature on the pervaporation performance of the membranes for breaking the azeotropic point of the bioethanol–water mixture was tested.
2. Experimental
2.1 Materials
PSSAAMA_Na and Ag_Nps were procured from Sigma Aldrich Chemicals, USA. Na-Alg was purchased from S. D. Fine chemicals, India. Rectified bioethanol (96% ethanol and 4.0% water by mass) was procured from Godavari Biorefineries, Karnataka, India. Purchased chemicals were of reagent grade and were used without further purification. Double distilled water was used for the analysis.2.2 Preparation of PSSAMA_Na capped Ag_Nps
2 mass% aqueous PSSAMA_Na solution was prepared by dissolving a certain amount of PSSAMA_Na in distilled water by constant stirring for 3 h. Then, 0.25 mass% of already sonicated Ag_Nps were put into aqueous PSSAMA_Na solution under constant stirring for about 2 h at 60 °C to obtain the PSSAMA_Na capped Ag_Nps suspension.102.3 Membrane fabrication
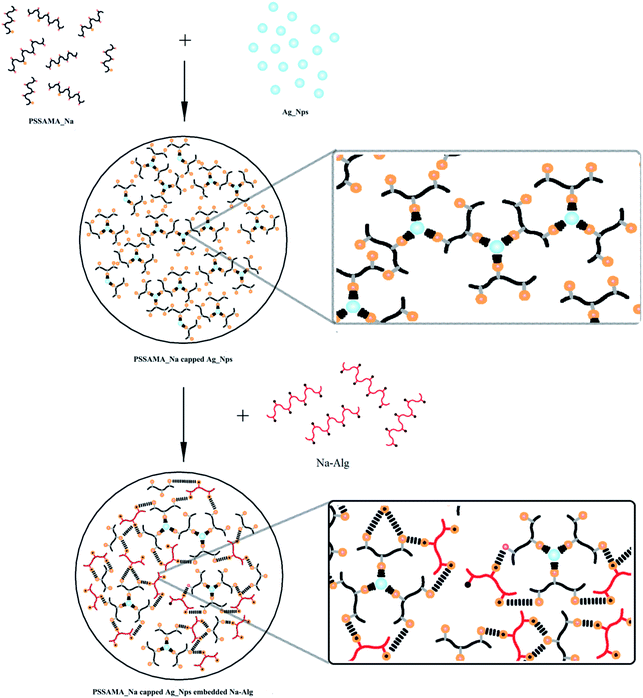
Na-Alg (3 gm) was dissolved in 105 mL of deaerated distilled water with constant stirring for about 24 h at room temperature. It was then filtered, and the resulting homogeneous solution was spread onto a clean glass plate with the aid of a casting knife in a dust-free atmosphere. It was allowed to dry at ambient temperature for about 2–3 days. The completely dried membrane was subsequently peeled-off and was designated as S-0.To prepare PSSAMA_Na capped Ag_Nps embedded Na-Alg membrane, a known quantity of PSSAMA_Na capped Ag_Nps was added into the above prepared homogeneous Na-Alg solution. The resulting solution was stirred for 3 h at 60 °C, and then it was subjected to sonication at fixed frequency 38 kHz for about 30 minutes, so as to improve the dispersion of PSSAMA capped Ag_Nps in Na-Alg matrix. The solution thus obtained was poured onto a glass plate and the rest of the procedure was followed as similar to Membrane S-0. However, the amount of PSSAMA-capped Ag_Nps with respect to the sodium alginate was varied as 0.5, 1.0, 1.5, 2.0 and 3.0 mass%, and the resulting membranes were designated as S-0.5, S-1, S-1.5, S-2, and S-3 respectively.14 An attempt was also made to incorporate higher amount of PSSAMA-capped Ag_Nps, but the membrane lost its properties. Therefore, we have restricted the addition of PSSAMA-capped Ag_Nps upto 3 mass%. The schematic representation of membrane fabrication is illustrated in Fig. 1.
2.4 Fourier transform infrared (FTIR) spectroscopy
Confirmation of reaction between PSSAMA_Na capped Ag_Nps and Na-Alg was done by FTIR Spectrometer (PerkinElmer spectrum, Singapore). The analysis was done using KBr method and the spectra were recorded in the range of 500–4000 cm−1.2.5 Wide-angle X-ray diffraction (WAXD)
Philips analytical X-ray diffractometer was used to obtain the X-ray diffractogram pattern of PSSAMA_Na capped Ag_Nps embedded Na-Alg membranes. For recognition of dried membrane samples having even thickness (∼50 μm) were placed on the sample holder and at an angle 2θ and the analysis was done over a range of 5–80° at a speed of 8° min−1.2.6 Differential scanning calorimetry (DSC)
Differential scanning calorimeter (DSCQ 20, TA Instruments, Waters LLC, and New Castle, DE, USA) was used to study the crystalline and amorphous regions of the PSSAMA_Na capped Ag_Nps embedded Na-Alg membranes. Weight of samples ranging from 9 to 10 mg, which were subjected to heat from atmospheric temperature to 250 °C under nitrogen atmosphere at a heating rate of 10 °C min−1.2.7 Scanning electron microscopy (SEM)
Analysis of Surface morphology of PSSAMA_Na capped Ag_Nps embedded Na-Alg membranes were carried out using a scanning electron microscope (JEOL, JSM-400 Å, Tokyo, Japan). Membrane samples were completely dried in order to take a photograph coated with a conductive layer (400 Å) of sputtered gold.2.8 Contact angle measurements
The sessile droplet method was used to analyze static contact angles of water of PSSAMA_Na capped Ag_Nps embedded Na-Alg membranes with the help of a contact angle analyzer (Phoenix 300, South Korea) attached with a video camera. Each sample was tested for the contact angle of the water droplet with a time period of 10 seconds after placing it on the prepared membranes. With precision and accuracy provided by the software, the contact angle was measured with respect to the shape of the water droplet formed on the membranes.2.9 Mechanical properties
The tensile strength and % elongation at break of the developed membranes were analyzed using the universal testing machine from Dak systems Inc. Membrane samples with a 25 × 50 mm dimension were considered for analysis. Three samples from each membrane were analyzed and the average results were considered.2.10 Sorption analysis
The sorption experiments were done at 30 °C by taking the azeotropic composition of bioethanol and water mixture. First, the membranes were dried in an oven and then weighed. These membranes were then kept submerged in the ethanol–water mixture for 24 h in a closed container for equilibrium establishment. Further, the swollen membranes were carefully blotted and weighed. In order to find out the % degree of swelling, the following formula is used.
 | (1) |
2.11 Pervaporation experiments
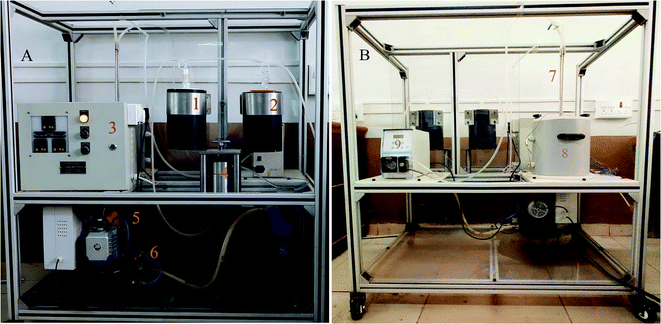
Sophisticated and specifically tailored pervaporation apparatus was employed for pervaporation experiments. The photograph of the PV unit is illustrated in Fig. 2. Heating vessel with a diameter of 300 mm with a volume of 4 liters used to fill the separating solution. The tank is completely sealed from the outer surrounding. Glass wool is used as an insulating material in the tank assembly. Heater with a power rating of 2.5 kW 230 V is used to maintain the required temperature inside the cylindrical tank. A heater is also equipped with a Pt-100 temperature sensor, which gives excellent accuracy at a broad temperature range. TC513BX is a sophisticated auto-tuning temperature controller or on/off the controller. Membrane holder with membrane surface area 15 cm2 is made up of high-quality steel, which is chemically inert to the solvent as well as corrosion-resistant. Feed side with volume 4 liters is equipped with a circulating pump with controllable circulating speed. The vacuum of 31.325 kPa was kept in the permeate side using a vacuum pump which is equipped with a pressure gauge (PN2299 pressor sensor with display). The feed tank is also equipped with the stirrer to distribute the heat evenly throughout the liquid. After the equilibrium establishment of the membrane, the vacuum is applied, and the permeate vapors are condensed and collected in the cold trap at fixed intervals of time. Further, the permeation flux of the membrane was calculated after the measurement of the weight of the permeate using a digital microbalance. The composition of permeate was analyzed using KAFI smart Karl Fischer Titrator.All the experiments were repeated three times and the average values were considered. However, the PV performance of the developed membranes was analyzed by calculating total permeation flux (J), separation selectivity (β) and pervaporation separation index (PSI) by using the following formulae.
 | (2) |
 | (3) |
| PSI = J(β − 1) | (4) |
Further, with the intention of getting a clear idea of the intrinsic properties of the membranes, the permeance (Pi/l) was evaluated using the following equation.
 | (5) |
3. Results and discussions
3.1 Fourier transform infrared spectroscopy (FTIR)
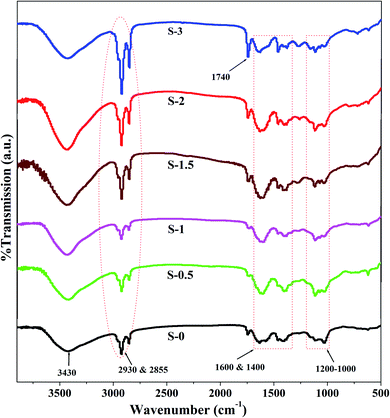
Fig. 3 exhibits the FTIR spectra of sodium alginate (Na-Alg) and its PSSAMA_Na capped Ag_Nps membranes.In pure Na-Alg, a characteristic broad band visible at 3430 cm−1 corresponds to –OH stretching vibrations. Further, the bands for asymmetric and symmetric –C![[double bond, length as m-dash]](https://www.rsc.org/images/entities/char_e001.gif) O stretching appeared around 1600 cm−1 and 1400 cm−1 respectively. Similarly, multiple peaks appeared in the range of 1000 cm−1 to 1200 cm−1 and the peaks at 2855 cm−1 and 2930 cm−1 correspond to –CO and –CH stretching respectively.24 Further, the intensity of the peak appearing around 1740 cm−1 corresponding to ester formation between –COO− groups of PSSAMA_Na and –OH groups of Na-Alg was gradually increased as the content of PSSAMA_Na increased in the membrane matrix (S-1 to S-3). The new peaks appeared at around 1040 cm−1 and 1130 cm−1 in PSSAMA_Na capped Ag_Nps embedded membranes correspond to symmetric and asymmetric stretching of S
O stretching appeared around 1600 cm−1 and 1400 cm−1 respectively. Similarly, multiple peaks appeared in the range of 1000 cm−1 to 1200 cm−1 and the peaks at 2855 cm−1 and 2930 cm−1 correspond to –CO and –CH stretching respectively.24 Further, the intensity of the peak appearing around 1740 cm−1 corresponding to ester formation between –COO− groups of PSSAMA_Na and –OH groups of Na-Alg was gradually increased as the content of PSSAMA_Na increased in the membrane matrix (S-1 to S-3). The new peaks appeared at around 1040 cm−1 and 1130 cm−1 in PSSAMA_Na capped Ag_Nps embedded membranes correspond to symmetric and asymmetric stretching of S![[double bond, length as m-dash]](https://www.rsc.org/images/entities/char_e001.gif) O groups. Similarly, two peaks appearing at 2855 cm−1 and 2930 cm−1 correspond to –SP3 hybridized –CH stretching. The intensity of these peaks was also gradually increased as the PSSAMA_Na concentration increased, owing to the increase in the number of –CH groups. Further, the peak intensity of the broad band appeared around 3430 cm−1 was enhanced not only due to enhanced hydrogen bonding but also due to the increased cross-linking.25 Based on this spectral evidence, it can be concluded that the PSSAMA_Na capped Ag_Nps enhanced cross-linking as well as the hydrophilic nature of the membranes.
O groups. Similarly, two peaks appearing at 2855 cm−1 and 2930 cm−1 correspond to –SP3 hybridized –CH stretching. The intensity of these peaks was also gradually increased as the PSSAMA_Na concentration increased, owing to the increase in the number of –CH groups. Further, the peak intensity of the broad band appeared around 3430 cm−1 was enhanced not only due to enhanced hydrogen bonding but also due to the increased cross-linking.25 Based on this spectral evidence, it can be concluded that the PSSAMA_Na capped Ag_Nps enhanced cross-linking as well as the hydrophilic nature of the membranes.
3.2 Wide-angle X-ray diffraction (WAXD)
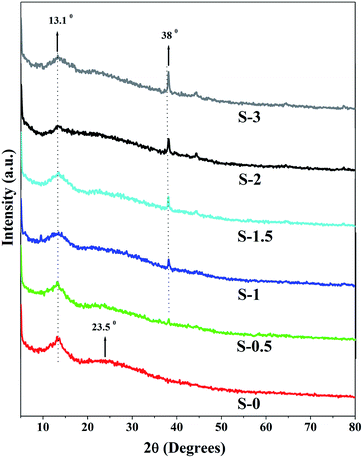
WAXD plays a vital role in analyzing the degree of crystallinity and modifications in the structure of the developed membranes. Fig. 4 illustrates the WAXD patterns of the developed membranes.In the patterns, the Na-Alg membrane demonstrated typical diffraction peaks at 2θ = 13.1° and 23.5° which are assigned to crystalline and amorphous regions respectively.26 However, the intensity of these peaks gradually decreased as the content of PSSAMA_Na capped Ag_Nps increased in the membrane matrix. This is due to the ionic clusters formed by Ag_Nps and –SO−3 groups of PSSAMA_Na which disordered the polymer chain arrangement and reduced the formation of crystalline regions in the membrane. Because of which the amorphous domain was enhanced in the membrane. Further, a new peak appeared at 2θ = 38° correspond to the presence of Ag_Nps.27 However, the peak intensity was gradually enhanced as the PSSAMA_Na capped Ag_Nps content was increased in the membrane matrix which proves the increased content of Ag_Nps which leads to the enhanced hydrophilicity of the membrane.25
3.3 Differential scanning calorimetry (DSC)
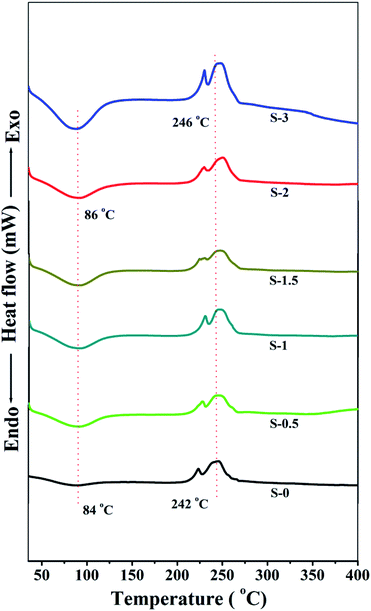
Fig. 5 illustrates the thermograms of the developed membranes.From the figure, it is noticed that the Na_Alg membrane exhibits an endothermic peak (Tg) at 84 °C. However, from S-0.5 to S-3, the endothermic peak gradually enhanced in terms of area under the curve as well as shifted slightly to a higher temperature as the content of PSSMA_Na capped Ag_Nps increased in the membrane matrix. This indicates that the stabilized Ag_Nps and polar groups present in the membrane matrix (–OH, –SO−3 and –COO−) increased hydrophilicity of the membranes and also suppressed the crystalline domains in the membranes. This leads to the higher water holding capacity of the membranes. Thus it can be said that the transport of molecules through the membranes is dominated by amorphous phase and hence the membrane with the highest content of PSSAMA_Na capped Ag_Nps demonstrated the highest permeation flux.
3.4 Scanning electron microscopy (SEM)
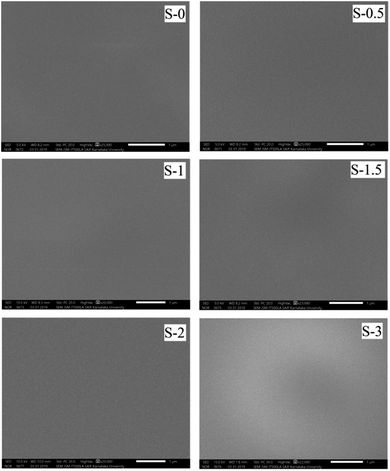
Fig. 6 demonstrates the SEM photographs (surface views) of the developed membranes.From the micrographs, it was clear that there was no significant increase of the bright regions in the SEM images from membrane S-0.5 to S-3. This may provide a piece of evidence for the successful capping of Ag_Nps. It was further noticed that the PSSAMA_Na capped Ag_Nps were distributed evenly throughout the membrane matrix with no apparent clustering. Therefore, this ascertains that the developed membranes are homogenous and free from defects.
3.5 Contact angle measurements
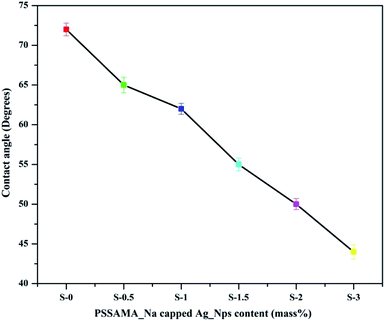
Contact angle values play an important role in analyzing the hydrophilicity of the membrane surface which influences the permeation flux of the membrane. The contact angle values of the developed membranes are represented in Fig. 7. The contact angle of 72° was observed for the pure Na_Alg membrane. After the incorporation of PSSAMA_Na capped Ag_Nps in the Na-Alg matrix, the contact angle value was decreased systematically from 65° to 44°. This is due to evenly dispersed ionic clusters in the Na-Alg matrix disturbs the chain arrangement which leads to the increased amorphous nature as well as the hydrophilicity of the membranes. Moreover, the number of polar groups (–OH, –SO−3 and –COO−) present in the membrane matrix also contribute to the increased hydrophilicity.3.6 Mechanical properties
Tensile strength and elongation at break of the membrane describe the mechanical strength of the membranes and their suitability towards the pervaporation.28 The effect of increased content of the Ag_Nps on the strength and percentage elongation at break of the membranes were analyzed and illustrated in Table 1. From the obtained values, it could be observed that the tensile strength of the membranes decreased from 43.8 to 22.0 MPa as the PSSAMA_Na capped Ag_Nps content increased in the membrane. This was expected because the addition of PSSAMA_Na capped Ag_Nps content in the Na-Alg matrix might increase hydrophilic susceptibility and decrease the entanglement degree which leads to poor mechanical strength. The capping of Ag_Nps will act as a stabilizer for Ag_Nps which will prevent the aggregation in the bulk or on the surface which is beneficial for the membrane. But it will lead to the decrement in the strength of the membrane. Despite this, the membrane can be efficiently used for the pervaporation separation of bioethanol.| Membrane | Tensile strength (MPa) | % elongation at break |
|---|---|---|
| S-0 | 43.88 ± 3.24 | 7.49 ± 1.24 |
| S-0.5 | 41.91 ± 2.19 | 5.86 ± 2.17 |
| S-1 | 34.52 ± 3.00 | 5.66 ± 2.78 |
| S-1.5 | 30.53 ± 3.23 | 4.37 ± 2.96 |
| S-2 | 29.26 ± 3.21 | 3.25 ± 1.98 |
| S-3 | 22.04 ± 2.68 | 2.83 ± 2.01 |
3.7 Sorption analysis
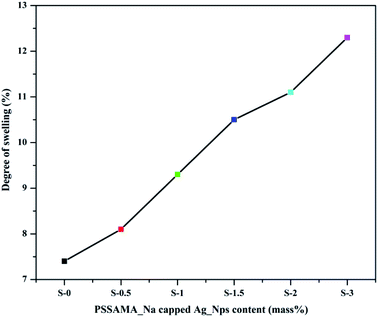
Membrane sorption plays a crucial role in organic dehydrations under the potential chemical gradient. The degree of swelling will help in the analysis of selective permeation of molecules, which is vital in the PV process. The plots of % degree of swelling versus concentration of PSSAMA_Na capped Ag_Nps at 30 °C is shown in Fig. 8. Membrane sorption was observed rising as the content of PSSAMA_Na capped Ag_Nps was increased in the membrane matrix. This was obvious as the interactions between the water molecules and the membranes were increased owing to the presence of Ag_Nps, –OH, –SO−3 and –COO− groups in the membrane matrix. S-3 exhibited the highest degree of swelling (12.3%) due to the highest concentration of PSSAMA_Na capped Ag_Nps which enhances interactions between the water molecules and the membrane.3.8 Effects of PSSAMA_Na capped Ag_Nps on the pervaporation
Table 2 illustrates the effects of PSSAMA_Na capped Ag_Nps on the PV performance of the developed membranes. From the data, it was clearly noticed that as the content of PSSAMA_Na capped Ag_Nps was enhanced, separation selectivity, total permeation flux and permeance were increased. These results are in accordance with the data of the sorption study and contact angle. The increase observed in the permeation flux was almost linear with S-3 showing the value 0.1340 kg m−2 h−1 at 30 °C. This is expected due to the presence of PSSAMA_Na capped Ag_Nps which enhances the hydrophilicity of the membrane. Ag_Nps present in the membrane enhanced hydrophilicity and decreased crystalline regions of the membrane, which led to the higher interactions between the membrane and the water.| Membrane | Temperature (°C) | J × 10−2 (kg m−2 h−1) | β | Pi/l (GPU) |
|---|---|---|---|---|
| a GPU = gas permeation unit = 10−6 cm3 (STP)/cm2/s/cm Hg. | ||||
| S-0 | 30 | 10.47 | 3014 | 2094 |
| 40 | 11.40 | 2401 | 2280 | |
| 50 | 13.20 | 2219 | 2640 | |
| S-0.5 | 30 | 11.47 | 3613 | 2294 |
| 40 | 12.07 | 2976 | 2414 | |
| 50 | 13.67 | 2425 | 2734 | |
| S-1 | 30 | 12.27 | 5558 | 2454 |
| 40 | 12.80 | 4044 | 2560 | |
| 50 | 14.07 | 3559 | 2814 | |
| S-1.5 | 30 | 12.73 | 7250 | 2546 |
| 40 | 13.27 | 4875 | 2654 | |
| 50 | 14.33 | 3977 | 2866 | |
| S-2 | 30 | 12.93 | 8549 | 2586 |
| 40 | 13.40 | 5830 | 2680 | |
| 50 | 14.60 | 4262 | 2920 | |
| S-3 | 30 | 13.40 | 11![[thin space (1/6-em)]](https://www.rsc.org/images/entities/char_2009.gif) 406 406 |
2680 |
| 40 | 14.00 | 6293 | 2800 | |
| 50 | 15.13 | 4875 | 3026 | |
Increment in both separation selectivity and permeation flux at the same time is not commonly observed in PV due to the tradeoff phenomenon. Incorporation of fillers or cross-linking typically directs to the enhanced membrane density which leads to the lower permeation flux and higher separation selectivity. However, in this research study, both separation selectivity and permeation flux were simultaneously increased with an increase in the content of PSSAMA_Na capped Ag_Nps in the membrane matrix. This is because the ionic groups like –COO− and –SO3− present in PSSAMA_Na and Ag_Nps will contribute to the better permeation flux and the cross-linking reactions between PSSAMA_Na and Na-Alg contributed to elevated separation selectivity.
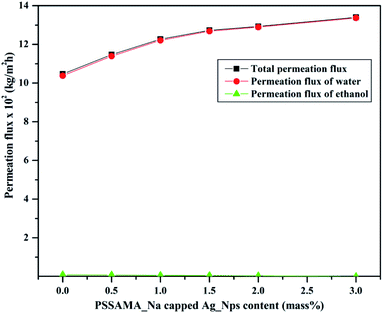
Fig. 9 shows the plots of total permeation flux and permeation fluxes of water and ethanol considered as a function of the content of PSSAMA_Na capped Ag_Nps. From the figure, it can be noticed that the curve of permeation flux of water and the curve of total permeation flux is almost merging, whereas the permeation flux of ethanol is almost suppressed. This provides proof of the hydrophilic nature of membranes.
3.9 Effect of PSSAMA_Na capped Ag_Nps on the pervaporation separation index (PSI)
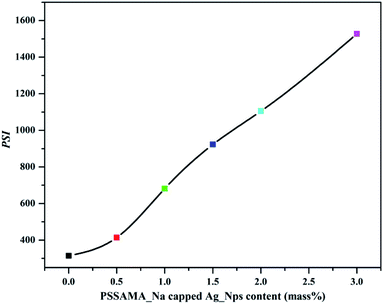
Pervaporation separation index can be employed as a fundamental parameter to analyze the separation efficiency of the membrane as it depends on both permeation flux and separation selectivity. The plot of PSI values at various concentrations of PSSAMA_Na capped Ag_Nps at 30 °C is shown in Fig. 10. From the figure, it was observed that the PSI values are increasing systematically as the concentration of PSSAMA_Na capped Ag_Nps was increased. This was obvious as the permeation flux and separation selectivity were increasing simultaneously as the content of PSSAMA_Na capped Ag_Nps increased in the membrane matrix. Membrane S-3 exhibited the highest PSI value (1528) amongst the developed membranes, which indicate that it demonstrated better PV performance.3.10 Effect of temperature on membrane performance
Table 2 represents the temperature effect on the PV performance of the developed membranes. From the table, it was noticed that the permeation flux was enhanced for all the membranes as the temperature was increased. Firstly, as a result of the increment in the temperature, a pressure difference is created between the upstream and the downstream ends of the membrane which in turn acts as a driving force for transport of the molecules. Secondly, due to the increase in the temperature, the free volume of the polymer matrix as well as thermal motion in polymer segments increase. However, the second reason can be disqualified as the experiments were conducted well below the glass transition temperature of the polymer. Therefore, the driving force is considered as a major influence in the enhancement of permeation flux along with the decrement in separation selectivity.3.11 Comparison of PV performance with the literature
Table 3 represents the comparison between the obtained PV results and the PV results in the literature for the separation of aqueous ethanol at the azeotropic point using different membranes. From the literature it can be observed that, the separation selectivity of the developed membranes is far more higher compared to the other membranes. Few membranes namely polyacrylonitrile–polyvinylpyrrolidone, Teflon-g-polyvinylpyrrolidone, all Nafion membranes and all PVA/GA membranes exhibit higher permeation flux but this was achieved by sacrificing the separation selectivity. Moreover, all these membranes exhibited higher permeation flux values at elevated temperatures except polyacrylonitrile–polyvinylpyrrolidone and Teflon-g-polyvinylpyrrolidone. The developed membranes exhibited excellent separation selectivity and moderately good permeation flux at ambient temperatures.| Membrane | Temperature (°C) | Separation selectivity | Permeation flux (g m−2 h−1) | Ref. |
|---|---|---|---|---|
| a Na-Alg: sodium alginate, PSSAMA_Na: polystyrene-4-sulfonic acid co maleic acid sodium salt, GA: glutaraldehyde, PVA: poly(vinyl alcohol), Ag_Nps: silver nanoparticles. | ||||
| Nafion-H+ | 70 | 2.5 | 5000 | 29 |
| Polyacrylonitrile–polyvinylpyrrolidone | 20 | 3.2 | 2200 | 30 |
| Polystyrene | 40 | 101 | 5 | 31 |
| Poly(vinyl chloride) | 40 | 63 | 3 | 32 |
| Alginic acid | 40 | 8.8 | 48 | 33 |
| Chitosan | 40 | 2208 | 4 | 34 |
| Chitosan acetate salt | 40 | 2556 | 2 | 35 |
| Chitosan/GA | 40 | 202 | 7 | 35 |
| Cationic PVA/GA | 40 | 709 | 89 | 36 |
| Anionic PVA/GA | 40 | 837 | 86 | 36 |
| PVA/GA | 40 | 335 | 189 | 36 |
| PVA/GA acrylic acid | 40 | 14 | 135 | 37 |
| Unmodified PVA | 40 | 15 | 91 | 37 |
| Nafion-Na+ | 70 | 5.0 | 500 | 29 |
| Nafion-K+ | 70 | 9.8 | 200 | 29 |
| Cellulose acetate | 60 | 5.9 | 200 | 38 |
| Teflon-g-polyvinylpyrrolidone | 25 | 2.9 | 2200 | 38 |
| Na-Alg | 30 | 3014 | 105 | Present work |
| Na-Alg/0.5% Ag_Nps–PSSAMA_Na | 30 | 3613 | 115 | Present work |
| Na-Alg/1.0% Ag_Nps PSSAMA_Na | 30 | 5558 | 123 | Present work |
| Na-Alg/1.5% Ag_Nps–PSSAMA_Na | 30 | 7250 | 127 | Present work |
| Na-Alg/2.0% Ag_Nps–PSSAMA_Na | 30 | 8549 | 129 | Present work |
| Na-Alg/3.0% Ag_Nps–PSSAMA_Na | 30 | 11![[thin space (1/6-em)]](https://www.rsc.org/images/entities/char_2009.gif) 406 406 |
134 | Present work |
Table 4 represents the comparison between the obtained PV results and the PV results in the literature for the separation of aqueous ethanol using Na-Alg membranes. From the literature it can be observed that, the separation selectivity of the developed membranes is far more higher compared to the other membranes except 6% P-HPA–Na-Alg membranes. The higher PV performance of 6% P-HPA–Na-Alg membranes was due to the discrete structure of HPAs comprising the heteropolyanions and the mobile solvated protons. All the other membranes reported in the table are exhibiting higher permeation flux in comparison with the permeation flux of the developed membranes. However, this was achieved by sacrificing the separation selectivity and due to more content of water in the feed.
| Membrane | Temp. (°C) | Mass% of water in the feed | Permeation flux (kg m−2 h−1) | Separation selectivity | Ref. |
|---|---|---|---|---|---|
| a Na-Alg: sodium alginate, PSSAMA_Na: polystyrene-4-sulfonic acid co maleic acid sodium salt, CS: chitosan, GA: glutaraldehyde, P-HPA: preyssler heteropolyacid, P-PVP: phosporylated poly(vinyl pyrrolidone), Al-MCM-41: aluminum-containing mesoporous silica, Ag_Nps: silver nano particles, CL: cellulose. | |||||
| GA–Na-Alg | 60 | 10.0 | 0.3 | 1000 | 39 |
| GA–Na-Alg/CS | 60 | 10.0 | 0.3 | 200 | 39 |
| Na-Alg–H3PO4 | 30 | 5.2 | 0.24 | 2182 | 40 |
| CS/Na-Alg | 30 | 13.5 | 0.22 | 436 | 40 |
| 6% P-HPA–Na-Alg | 30 | 4.0 | 0.17 | 59![[thin space (1/6-em)]](https://www.rsc.org/images/entities/char_2009.gif) 976 976 |
41 |
| 6% P-HPA–Na-Alg | 30 | 10.0 | 0.57 | 14![[thin space (1/6-em)]](https://www.rsc.org/images/entities/char_2009.gif) 991 991 |
41 |
| Two-ply composite Na-Alg/CS | 30 | 5.0 | 0.07 | 1110 | 41 |
| 2.5% zeolite–Na-Alg | 30 | 10.0 | 0.052 | 256 | 42 |
| 5% zeolite–Na-Alg | 30 | 10.0 | 0.095 | 540 | 42 |
| 7.5% zeolite–Na-Alg | 30 | 10.0 | 0.112 | 773 | 42 |
| 10% zeolite–Na-Alg | 30 | 10.0 | 0.132 | 1598 | 42 |
| CL/Ca2+–Na-Alg | 30 | 10.0 | 0.068 | 1175 | 42 |
| P-PVP/Na-Alg | 30 | 10.0 | 0.09 | 364 | 43 |
| 1% Al-MCM-41/Na-Alg | 30 | 10.0 | 0.027 | 35 | 44 |
| 5% Al-MCM-41/Na-Alg | 30 | 10.0 | 0.060 | 377 | 44 |
| 8% Al-MCM-41/Na-Alg | 30 | 10.0 | 0.092 | 949 | 44 |
| 20% Al-MCM-41/Na-Alg | 30 | 10.0 | 0.129 | 1089 | 44 |
| Na-Alg | 30 | 4.0 | 0.105 | 3014 | Present work |
| Na-Alg/0.5% Ag_Nps–PSSAMA_Na | 30 | 4.0 | 0.115 | 3613 | Present work |
| Na-Alg/1.0% Ag_Nps PSSAMA_Na | 30 | 4.0 | 0.123 | 5558 | Present work |
| Na-Alg/1.5% Ag_Nps–PSSAMA_Na | 30 | 4.0 | 0.127 | 7250 | Present work |
| Na-Alg/2.0% Ag_Nps–PSSAMA_Na | 30 | 4.0 | 0.129 | 8549 | Present work |
| Na-Alg/3.0% Ag_Nps–PSSAMA_Na | 30 | 4.0 | 0.134 | 11![[thin space (1/6-em)]](https://www.rsc.org/images/entities/char_2009.gif) 406 406 |
Present work |
4. Conclusion
PSSAMA_Na capped Ag_Nps embedded Na-Alg membranes were fabricated and analyzed for separation of the azeotropic aqueous bioethanol at various temperatures. Membranes demonstrated reasonably good PV performance. FTIR confirmed the cross-linking reaction between Na-Alg and PSSAMA_Na. WAXD shows a decrease in crystalline domains with an increase in PSSAMA_Na capped Ag_Nps content as well as confirm the presence of Ag_Nps. Contact angle and sorption analysis data prove the enhancement in the hydrophilicity as the content of PSSAMA_Na capped Ag_Nps was increased. DSC illustrated that, as the PSSAMA_Na capped Ag_Nps content increased in the membrane matrix, the area under the curve is enhanced as well as shifted slightly to a higher temperature. This indicates that the stabilized Ag_Nps and polar groups present in the membrane matrix (–OH, –SO−3 and –COO−) increased hydrophilicity of the developed membranes. The compatibility of the chemicals and uniform distribution of the PSSAMA_Na capped Ag_Nps is confirmed by SEM images. Membrane S-3 exhibited the tensile strength of 22.04 MPa which is good enough to carry out the PV experiments at various temperatures. Developed membranes exhibited an anti tradeoff phenomenon that is both separation selectivity and permeation flux were increased simultaneously with an increase in the content of PSSAMA_Na capped Ag_Nps in the membrane matrix. Among the PSSAMA_Na capped Ag_Nps embedded membranes, the Membrane containing 3 mass% of PSSAMA_Na capped Ag_Nps demonstrated the highest separation selectivity of 11![[thin space (1/6-em)]](https://www.rsc.org/images/entities/char_2009.gif) 406 with a permeation flux of 13.40 × 10⁻² kg m−2 h−1 at 30 °C for azeotropic aqueous bioethanol.
406 with a permeation flux of 13.40 × 10⁻² kg m−2 h−1 at 30 °C for azeotropic aqueous bioethanol.
Nomenclature
| Mw | Molecular weight |
| A | Effective membrane area |
| DS | Degree of swelling (%) |
| ET | Ethanol |
| J | Total flux |
| Jo | Pre-exponential factor for permeation |
| PSI | Pervaporation separation index |
| P and F | Mass percent of permeate and feed |
| T | Permeation time (h) |
| T | Temperature (K) |
| W | Mass of permeate |
| Ws and Wd | Mass of the swollen and dry membranes |
Conflicts of interest
There are no conflicts to declare.Acknowledgements
Authors gratefully acknowledge financial support from Vision Group on Science and Technology, Karnataka, India (No. K-FIST(L2)/2016-17/GRD-540/2017-18/103/3).References
- J. Y. Park, I. H. Lee and G. N. Bea, J. Ind. Eng. Chem., 2008, 14, 707–713 CrossRef CAS.
- T. Ding and J. Zhu, Mater. Sci. Eng. B, 2003, 100, 307–313 CrossRef.
- Y. Lin and S. Tanaka, Appl. Microbiol. Biotechnol., 2006, 69, 627–642 CrossRef CAS PubMed.
- G. Najafpour, H. Younes and K. S. K. Ismail, Bioresour. Technol., 2004, 92, 251–260 CrossRef CAS PubMed.
- C. K. Yamakawa, E. C. Rivera, H. Kwond, W. E. H. Agudelo, M. B. W. Saad, J. Leal, C. E. V. Rossell, A. Bonomi and R. M. Filho, Biochemical Engineering Chemistry, 2019, 147, 1–10 CrossRef CAS.
- L. M. Vane, J. Chem. Technol. Biotechnol., 2005, 80, 603–629 CrossRef CAS.
- T. M. Boudreau and G. A. Hill, Process Biochem., 2006, 41, 980–983 CrossRef CAS.
- S. G. Adoor, S. D. Bhat, D. D. Dionysiou, M. N. Nadagouda and T. M. Aminabhavi, RSC Adv., 2014, 4, 52571–52582 RSC.
- C. Ji, S. Xue and Z. Xu, ACS Appl. Mater. Interfaces, 2016, 8, 27243–27253 CrossRef CAS PubMed.
- F. Peng, F. Pan, H. Sun, L. Lu and Z. Jiang, J. Membr. Sci., 2007, 300, 13–19 CrossRef CAS.
- M. Wang, R. Xing, H. Wu, F. Pan, J. Zhang, H. Ding and Z. Jiang, J. Membr. Sci., 2017, 538, 86–95 CrossRef CAS.
- G. Dudek and R. Turczyn, RSC Adv., 2018, 8, 39567–39578 RSC.
- D. Unlu and N. D. Hilmioglu, J. Membr. Sci., 2018, 559, 138–147 CrossRef CAS.
- A. M. Sajjan, B. K. Jeevan Kumar, A. A. Kittur and M. Y. Kariduraganavar, J. Membr. Sci., 2013, 425–426, 77–88 CrossRef CAS.
- A. S. Kulkarni, S. M. Badi, A. M. Sajjan, N. R. Banapurmath, M. Y. Karidurganavar and A. S. Shettar, Chem. Data Collect., 2019, 22, 100245 CrossRef.
- Y. K. Ong, G. M. Shi, N. L. Le, Y. P. Tang, J. Zuo, S. P. Nunes and T. S. Chung, Prog. Polym. Sci., 2016, 57, 1–31 CrossRef CAS.
- A. M. Sajjan, N. R. Banapurmath, N. M. Shivayyanavar, A. S. Kulkarni and A. S. Shettar, IOP Conf. Ser.: Mater. Sci. Eng., 2018, 376, 012073 Search PubMed.
- S. Claes, P. Vandezande, S. Mullens, R. Leysen, K. De Sitter, A. Andersson, F. H. J. Maurer, H. Van den Rul, R. Peeters and M. K. Van Bael, J. Membr. Sci., 2010, 351, 160–167 CrossRef CAS.
- L. Diestel, H. Bux, D. Wachsmuth and J. Caro, Microporous Mesoporous Mater., 2012, 164, 288–293 CrossRef CAS.
- H. Azimi, F. Tezel and J. Thibault, J. Chem. Technol. Biotechnol., 2017, 92, 2901–2911 CrossRef CAS.
- L. Gong, L. Zhang, N. Wang, J. Li, S. Ji, H. Guo, G. Zhang and Z. Zhang, Sep. Purif. Technol., 2014, 122, 32–40 CrossRef CAS.
- Y. Huang, P. Zhang, J. Fu, Y. Zhou, X. Huang and X. Tang, J. Membr. Sci., 2009, 339, 85–92 CrossRef CAS.
- L. Guo, W. Yuan, Z. Lu and C. M. Li, Colloids Surf., A, 2013, 439, 69–83 CrossRef CAS.
- T. Zhu, Y. Luo, Y. Lin, Q. Li, P. Yu and M. Zeng, Sep. Purif. Technol., 2010, 74, 242–252 CrossRef CAS.
- H. G. Premakshi, A. M. Sajjan, A. A. Kittur and M. Y. Kariduraganavar, J. Appl. Polym. Sci., 2014, 132, 41248 Search PubMed.
- P. S. Rachipudi, A. A. Kittur, A. M. Sajjan, R. R. Kamble and M. Y. Kariduraganavar, Chem. Eng. Sci., 2013, 94, 84–92 CrossRef CAS.
- K. Anandalakshmi, J. Venugobal and V. Ramasamy, Appl. Nanosci., 2016, 6, 399–408 CrossRef CAS.
- A. M. Sajjan, M. L. Naik, A. S. Kulkarni, U. Rudgi, M. Ashwini, G. G. Shirnalli, A. Sharanappa and P. B. Kalahal, Chem. Data Collect., 2020, 26, 100338 CrossRef CAS.
- T. Ishikawa, Kemikaru Enjiniyaringu, 1984, 29, 19–25 CAS.
- Q. T. Nguyen, L. Le Blanc and J. Neel, J. Membr. Sci., 1985, 22, 245–255 CrossRef CAS.
- T. Uragami and T. Morikawa, Macromol. Chem. Phys., 1989, 190, 399–404 CrossRef CAS.
- T. Uragami, T. Morikawa and H. Okuno, Polymer, 1989, 30, 1117–1122 CrossRef.
- T. Uragami and M. Saito, Sep. Sci. Technol., 1989, 24, 541–554 CrossRef CAS.
- T. Uragami, H. Matsugi and T. Miyata, Macromolecules, 2005, 38, 8440–8446 CrossRef CAS.
- T. Uragami and K. Takigawa, Polymer, 1990, 31, 668–672 CrossRef CAS.
- V. S. Praptowidodo, J. Mol. Struct., 2005, 739, 207–212 CrossRef CAS.
- M. Rafik, A. Mas, M.-F. Guimon, C. Guimon, A. Elharfi and F. Schué, Polym. Int., 2003, 52, 1222–1229 CrossRef CAS.
- B. Bolto, M. Hoang and Z. Xie, Chem. Eng. Process., 2011, 50, 227–235 CrossRef CAS.
- P. Shao and R. Y. M. Huang, J. Membr. Sci., 2007, 287, 162–179 CrossRef CAS.
- S. Kalyani, B. Smitha, S. Sridhar and A. Krishnaiah, Desalination, 2008, 229, 68–81 CrossRef CAS.
- V. T. Magalad, A. R. Supale, S. P. Maradur, G. S. Gokavi and T. M. Aminabhavi, Chem. Eng. J., 2010, 159, 75–83 CrossRef CAS.
- S. G. Adoor, L. S. Manjeshwar, S. D. Bhat and T. M. Aminabhavi, J. Membr. Sci., 2008, 318, 233–246 CrossRef CAS.
- S. Kalyani, B. Smitha, S. Sridhar and A. Krishnaiah, Ind. Eng. Chem. Res., 2006, 45, 9088–9095 CrossRef CAS.
- M. B. Patil, R. S. Veerapur, S. A. Patil, C. D. Madhusoodana and T. M. Aminabhavi, Sep. Purif. Technol., 2007, 54, 34–43 CrossRef CAS.
| This journal is © The Royal Society of Chemistry 2020 |

