
 Open Access Article
 This Open Access Article is licensed under a Creative Commons Attribution-Non Commercial 3.0 Unported Licence
Hard X-ray excited optical luminescence from protein-directed Au∼20 clusters†
Zuoyue Liu‡
 a,
Kyung Oh Jung‡b,
Ryo Takahatac,
Masanori Sakamotoc,
Toshiharu Teranishic,
Mamoru Fujitsuka*a,
Guillem Pratx*b and
Yasuko Osakada*ad
a,
Kyung Oh Jung‡b,
Ryo Takahatac,
Masanori Sakamotoc,
Toshiharu Teranishic,
Mamoru Fujitsuka*a,
Guillem Pratx*b and
Yasuko Osakada*ad
aThe Institute of Scientific and Industrial Research (SANKEN), Osaka University, Mihogaoka 8-1, Osaka 567-0047, Ibaraki, Japan. E-mail: yosakada@sanken.osaka-u.ac.jp
bDepartment of Radiation Oncology and Medical Physics, Stanford University, 300 Pasteur Dr, Stanford, CA 94305, USA
cInstitute for Chemical Research, Kyoto University, Gokasho, Uji, Kyoto 611-0011, Japan
dInstitute for Advanced Co-creation Studies, Osaka University, 1-1 Yamadagaoka, Suita, Osaka, 565-0871, Japan
First published on 6th April 2020
Abstract
Hard X-ray excited optical luminescence is a unique property of materials, which makes them promising for biological imaging applications. However, the preparation of biocompatible contrast agents for hard X-ray excited optical luminescence remains a considerable challenge that has, to date, not been overcome. In this study, we investigated the luminescence properties of protein-directed Au∼20 clusters upon hard X-ray irradiation, both in solution and when embedded in films.
Introduction
Bio-imaging has become a crucial tool for visualizing biological functions and has demonstrated clinical benefits.1,2 Among the existing imaging modalities, luminescent probes produce high levels of contrast for optical imaging.3–5 However, biological targets deep within tissues cannot be reached via conventional optical excitation because of absorption. To overcome this challenge, hard X-rays have emerged as a potential excitation source for luminescent probes.6–8 However, the development of biocompatible probes for hard X-ray excited optical luminescence (hXEOL) remains limited and further study is necessary. Previously, we reported hXEOL using a protein-protected gold (Au) clusters.9 In brief, we employed a bovine serum albumin (BSA) directed Au25 cluster and observed emission upon hard X-ray (50 kVp) irradiation, while Au8 clusters showed no distinctive contrast. While we observed clear optical emission from Au25, the luminescence process upon hard X-ray irradiation has yet to be clarified. To elucidate the hXEOL mechanism, it is also important to characterize the photoluminescence (PL) properties of the probes upon UV-Vis light irradiation, which would allow for a thorough examination of their characteristics. In this study, we studied the luminescence properties of Au∼20 clusters directed by proteins, upon UV-Vis as well as hard X-ray irradiation, and provide a comprehensive structural characterization of these materials.10,11Results and discussion
In this work, the protein-directed Au∼20 clusters synthesis was carried out using three proteins: human serum albumin (HSA), BSA, and lactoferrin (Fig. 1a). These protein-directed Au∼20 clusters were synthesized under basic conditions (pH 11) as previously described9 with slight modification (see Experimental section). The PL and absorption spectra of the clusters were measured (Fig. 1b and c, as well as Fig. S1–S3†). All the protein-directed Au clusters displayed tail-like absorption bands in the visible range (300–600 nm). Under UV light irradiation (365 nm), a distinctive red PL was observed from the samples (Fig. 1b inset and Fig. S4†). At an excitation wavelength of 370 nm, there were two peaks at 420 and 610 nm, which could be attributed to PL from the tyrosine oxidative dimer12–14 and the Au cluster, respectively (Fig. S2†). Absolute PL quantum yields were measured at an excitation wavelength of 470 nm (Table S1†), and they varied from 3.3% (BSA-Au∼20) to 6.7% (lactoferrin-Au∼20) after dialysis. We observed slight decreases in the PL quantum yield after dialysis of the sample, accompanied by a blue shift (∼10 nm) of the emission peak, possibly because of pH changes and rigidness of the protein structure (Fig. S5 and Table S1†).10,15,16 Yields for the cluster synthesis were calculated via inductively coupled plasma atomic emission spectroscopy (ICP-AES) to compare the Au contents of the samples (Table S2†). All samples had an Au content of 6%, which indicates similar yields (80–88%).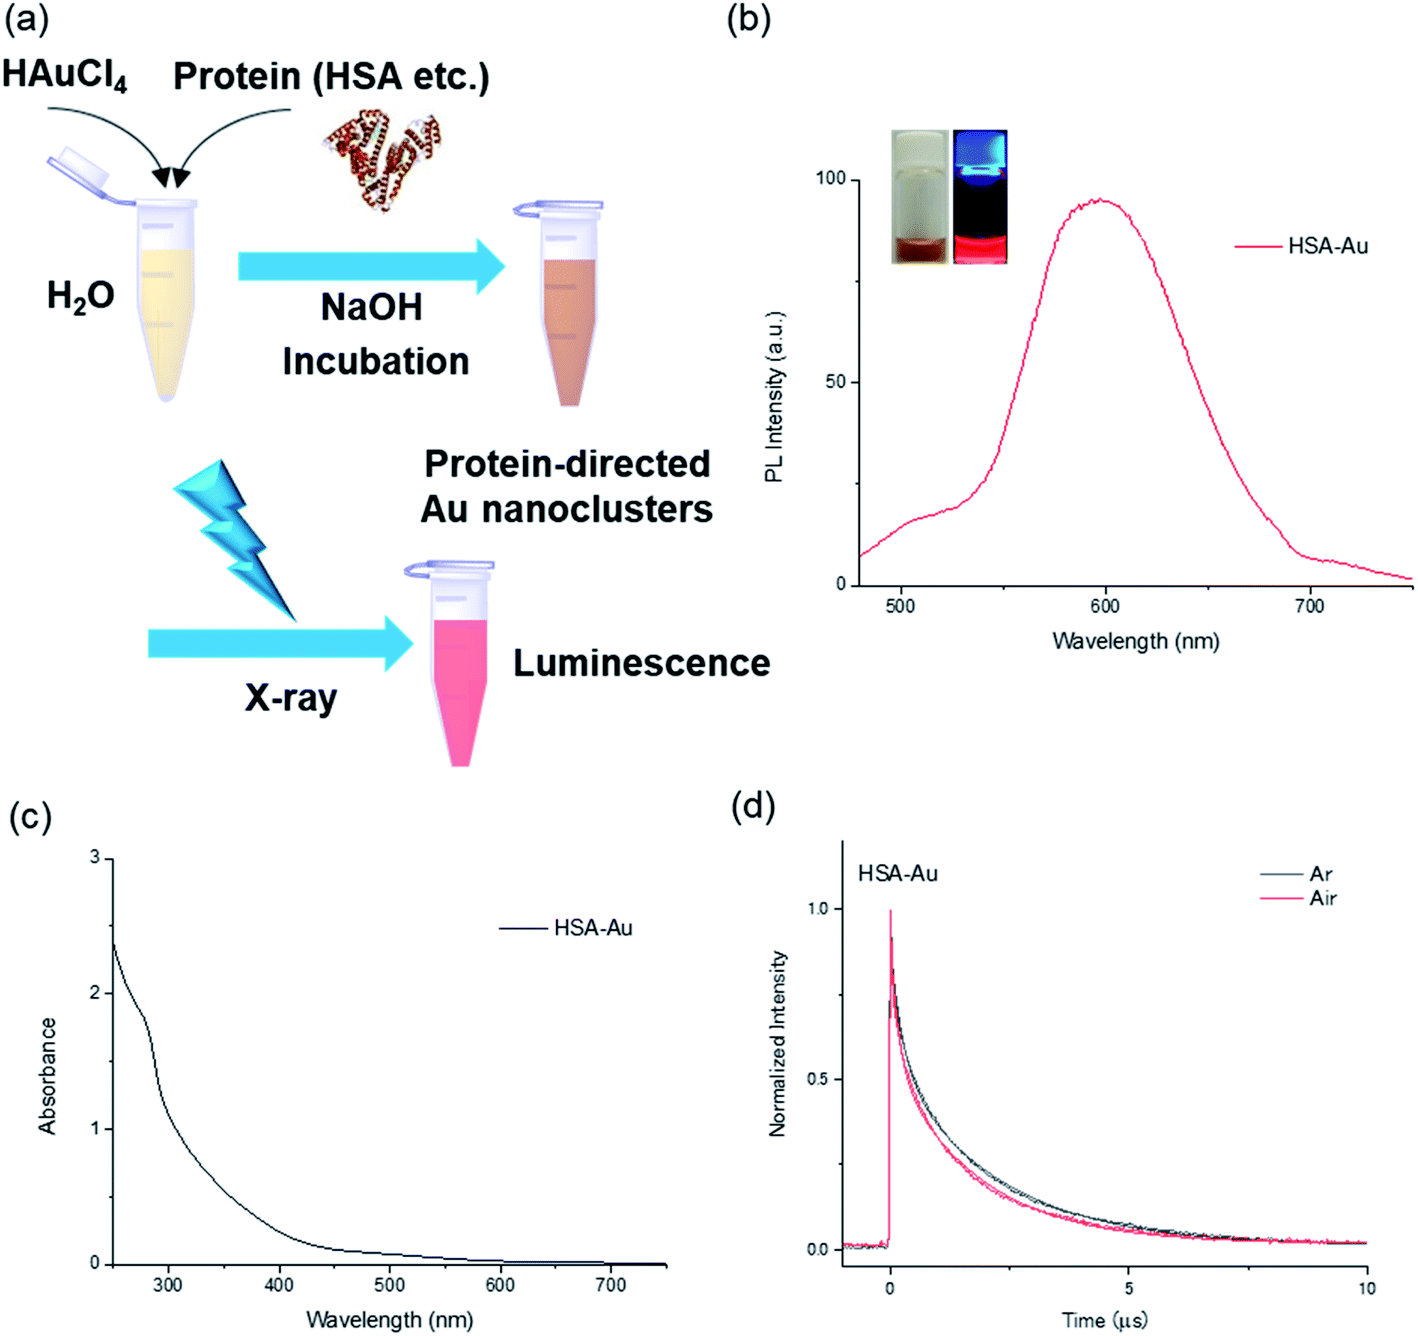 | ||
| Fig. 1 Photochemical properties of HSA-directed Au∼20 clusters. (a) Schematic diagram showing the synthesis of Au clusters. (b) PL spectra of HSA-Au cluster excited at 470 nm. Inset shows photographs of clusters under natural light (left) and when excited with UV light (365 nm). (c) Absorption spectrum for HSA-Au. (d) PL decay curves at 640 nm for HSA-Au clusters excited using a 355 nm laser, under argon (black) and air atmospheres (red) with fitting curves. | ||
We then confirmed the structural properties of the protein-directed Au clusters. To analyze the size of the Au cluster, matrix-assisted laser desorption ionization time-of-flight (MALDI-TOF) mass spectra were obtained for HSA-Au and HSA (Fig. S6a and b†). 3,5-Dimethoxy-4-hydroxycinnamic acid (sinapic acid, SA) was used as the matrix in this study. We observed a broad peak at 70 kDa for HSA-Au, which could be attributed to Au∼20 clusters. Analysis of the fluorescence of HSA-Au using the jellium model also suggested that the number of Au atoms in HSA was ∼20. Based on the jellium model, the number of Au atoms corresponding to the observed fluorescence was 15–25 (Fig. S6c and Table S3†). This result further supports that ∼20 Au atoms were included in the HSA-Au as indicated by the MALDI-TOF mass spectra.17 Subsequently, we conducted X-ray photoelectron spectroscopy (XPS) to compare the oxidation states of the Au 4f or S 2p in the protein-directed metal clusters (Fig. 2a, b, S7, and S8†).18 The peaks at around ∼83.8 and 84.7 eV correspond to the binding energies of Au(0) and Au(I), respectively, and their ratio was quantified for the three individual clusters.18,19 The amount of Au(I) state in the albumin protein-directed Au cluster was ∼11%; this was slightly less than that of lactoferrin-Au, which was 15% (Table S4†). The S 2p peaks at 162.2 and 166.8 eV were fitted to the S–Au bond and the oxidized S state, respectively, although the signals were much weaker than those of Au because of the lower absorption of X-rays by S atoms.15,18 In the FT-IR spectra of the native proteins, we observed peaks that were characteristic of amide bonds. We observed broader peaks in the FT-IR spectra after cluster synthesis and purification, which suggests that the chemical bonds in the main protein chains were preserved, but a large secondary structural change in the protein structure was observed (Fig. 2c and S9†).10,15,18,20 We also noted that the amino acid contents of the proteins did not differ significantly, for example, all three proteins contained similar amounts of cysteine (Table S5†). The native proteins displayed negative peaks at 208 and 222 nm in the circular dichroism (CD) measurements, which could be attributed to the α-helical structures. However, the CD spectra also showed that these secondary protein structures were completely disrupted after the synthesis (Fig. 2d and S10†).12,21
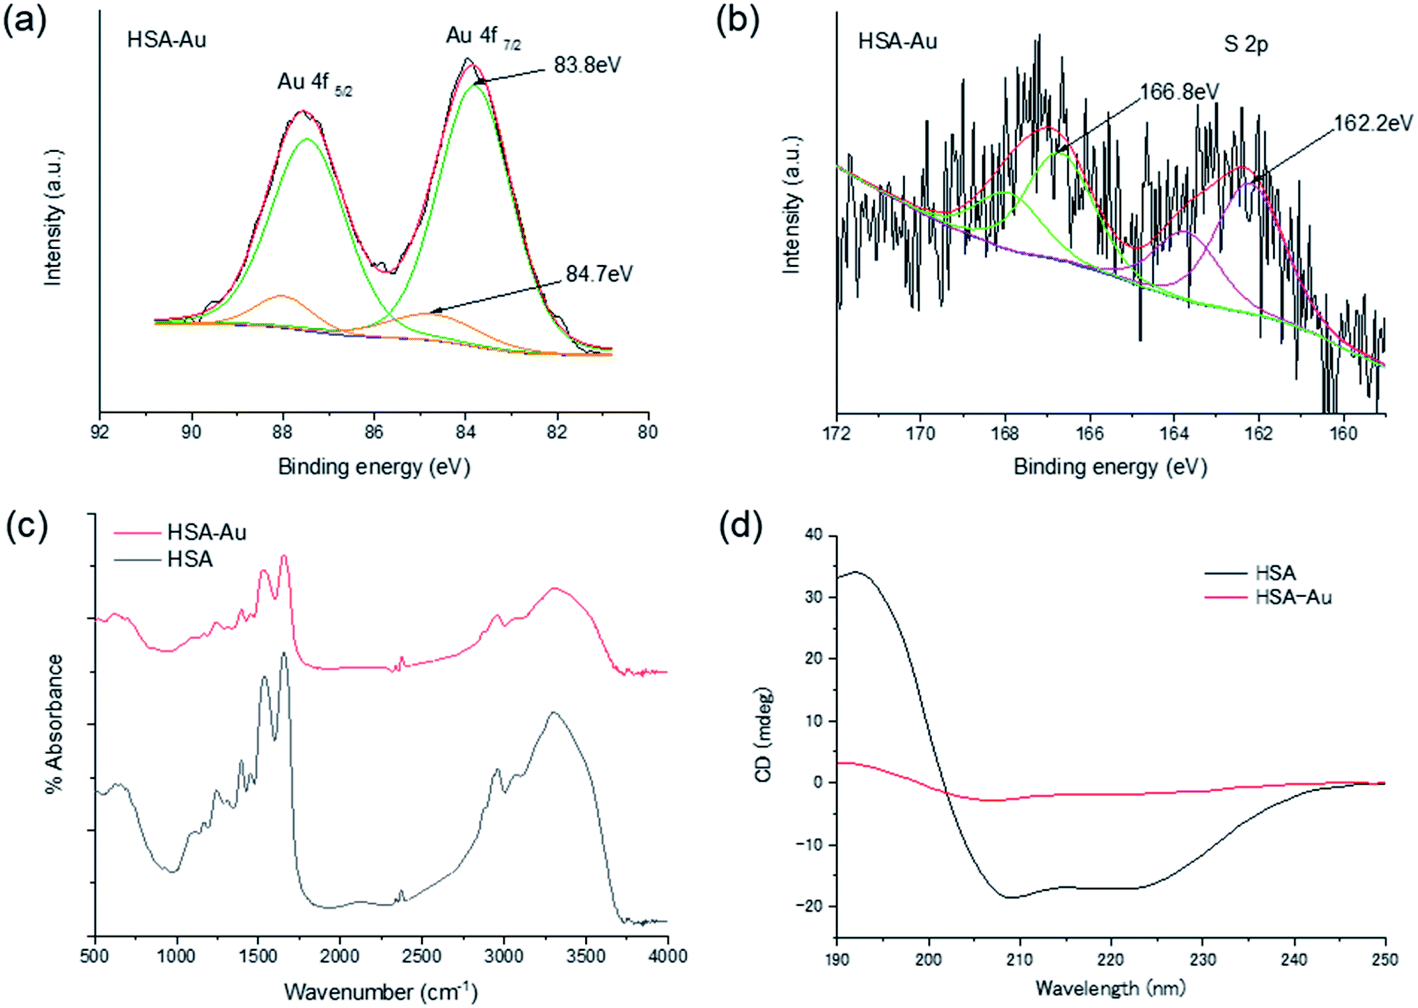 | ||
| Fig. 2 Structural characteristics of HSA-Au clusters. (a and b) XPS spectra of Au 4f and S 2p, respectively. (c) FT-IR spectra of HSA-Au (red) and HSA protein (black). (d) CD spectra of HSA-Au (red) and HSA (black). | ||
To further our understanding of the PL properties of the protein-directed clusters, we investigated the effect of molecular oxygen (O2) on the PL lifetime and compared the steady-state PL in the presence or absence of molecular oxygen (Fig. 1d, and S11†).22 For all protein-directed clusters, a slight quenching of the PL could be observed by molecular oxygen (Fig. S12 and Table S6†). The rate constant for the quenching by molecular oxygen (kq) was estimated using the following equation: kair = kAr + kq[O2]. The rate constants of all three Au∼20 clusters were 13 times smaller than the diffusion-limited rate constant in water (7.4 × 10⁹ L mol−1 s−1, Table S6†),23 which shows that the capping of the Au clusters with protein shells partially prevented bimolecular reactions with molecular oxygen.
We next investigated hXEOL from the protein-directed Au clusters. For imaging, lyophilized samples were dissolved in water and placed in a 96-well plate, and luminescence imaging was carried out via hard X-ray (60 kVp) irradiation using an EM-CCD camera (Fig. 3).24 We observed clear contrast when using these protein-directed Au clusters; in particular, the albumin-directed clusters displayed a slightly higher intensity (Fig. 3a and b). From photochemical and structural analysis, the slightly increased intensities when using the albumin-directed clusters might be because of the prolonged PL lifetimes as well as the higher amounts of Au(0); however, the detailed mechanism requires further investigation and will be part of future work. We then employed the HSA-Au clusters, which displayed the highest contrast, for film imaging experiments. We fabricated an HSA-Au-embedded PVA–PEG film and examined its X-ray excited optical luminescence. The fabricated film was cut into individual shapes as shown in Fig. 3c. Under UV excitation (365 nm), we observed PL from the HSA-Au-embedded films but not the control films. More importantly, they also displayed bright optical emission under hard X-ray excitation.
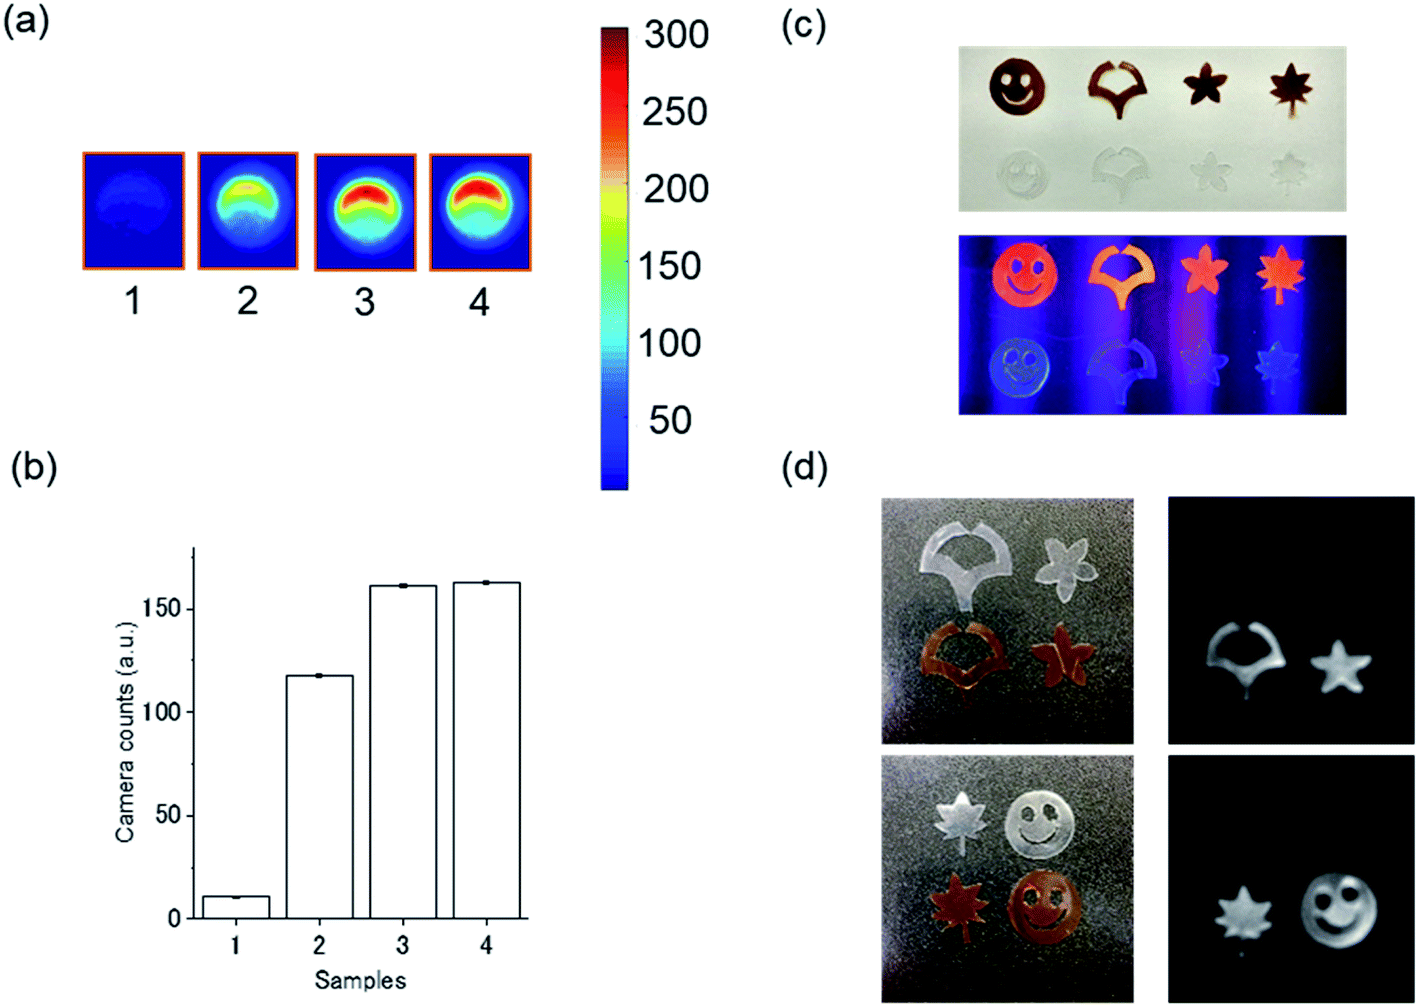 | ||
| Fig. 3 hXEOL imaging (a) and signal quantification (b) for (1) water, (2) lactoferrin-Au (3) BSA-Au and (4) HSA-Au. (c) Images of HSA-Au-embedded PVA–PEG films and control PVA–PEG films shaped as smiley faces, the logo of Osaka University, stars and leaves. The top image shows film under natural light, while bottom row was under UV irradiation (365 nm). (d) Hard X-ray irradiated imaging using HSA-Au embedded films. Left: photographs of films. Right: optical images taken under hard X-ray irradiation (60 kVp). | ||
In this study, we comprehensively studied the photochemical and structural characteristics of Au∼20 clusters obtained via protein directed synthesis to further our understanding of their hXEOL. Upon excitation with hard X-rays (60 kVp), the X-ray is absorbed by an electron in the L-shell of Au (L-edge is 12 keV). The emitted photoelectron transfers energy to other gold electrons in its vicinity via inelastic collisions with orbital electrons, leading to their excitation and subsequent emission of light. Additionally, Auger electrons are emitted when higher shell electrons fill holes in lower shells, potentially acting as an additional excitation source.9 The longer-lived lower excited state is likely a triplet excited state, and thermally activated delayed fluorescence has been reported as the origin of PL from BSA-Au25 clusters.25 The amino acid compositions of the proteins are almost similar, particularly for the binding and reduction of Au3+ to produce the gold clusters.26 The PL quantum yield upon visible light excitation (470 nm) was the highest in lactoferrin-Au, while the PL lifetime was the shortest. XPS also showed that the amount of Au(I) in the lactoferrin-directed cluster was slightly higher than for the other clusters; indeed, Schneider et al. reported the absence of Au(I) in BSA-directed Au8 clusters.18 Synchrotron-based X-ray absorption fine structure (XAFS) spectroscopy would be necessarily to understand the origin of hXEOL.16 While the presence of Au(I) in Au∼20 clusters might be an important factor for the distinct contrast they show for hXEOL, the unique properties of the μs-scale PL lifetimes from the lowest excited state combined with the inhibition of reactions with molecular oxygen are likely primary factor for hXEOL by these clusters.
Experimental section
Materials and method
Gold(III) chloride trihydrate (HAuCl4·3H2O), BSA and HSA were purchased from Sigma-Aldrich (Tokyo, Japan). Lactoferrin and NaOH were purchased from Fujifilm Wako (Osaka, Japan). All the reagents were used as received without further purification.Absorption spectra were recorded using a V630 UV-Vis spectrophotometer (JASCO, Japan). PL spectra were measured using an FP-8200 fluorometer (JASCO, Japan) at 25 °C. Absolute quantum yields were obtained using a C11347-11 Quantaurus-QY absolute PL quantum yield spectrometer (Hamamatsu, Japan). Circular dichroism (CD) spectra were recorded using a J1500 CD spectrometer (JASCO, Japan) with a sample concentration of 0.01 mg mL−1. Fourier-transform infrared spectroscopy (FT-IR) was carried out using a V-770 UV-Vis/NIR spectrometer (JASCO, Japan) with freeze-dried solid samples. ICP-AES was employed to analyze the Au contents of the as-prepared samples using an ICPS-8100 sequential type ICP emission spectrometer (Shimadzu, Japan). MALDI-TOF mass analysis of the Au clusters was conducted using an Ultraflex III (Bruker, USA) with sinapic acid (SA) as a matrix. Before MALDI-TOF mass measurements, the as-prepared Au clusters were washed with Milli-Q water to remove the remaining salts and concentrated 10 times using Vivaspin 2 (10 kDa). The SA matrix was prepared by dissolving 10 mg of SA in 1 mL of a 1![[thin space (1/6-em)]](https://www.rsc.org/images/entities/char_2009.gif) :3 mixture of CH3CN and a 0.1% aqueous solution of trifluoroacetic acid (TFA). Then, 10 μL of the Au clusters were mixed with 20 μL of the SA matrix. When preparing the samples, 2 μL of the mixture was dropped on the steel plate and allowed to dry completely at room temperature. During the measurements, the mass spectra were collected using the positive linear mode. XPS was performed using a JPS-9010MX photoelectron spectrometer (JEOL, Japan). For XPS measurements, all spectra were obtained using the C 1s peak at 285.0 eV as the reference binding energy.18 Time-resolved PL measurements were conducted using a ns-laser flash photolysis system. Nanosecond flash photolysis experiments were performed with a commercially available system, TSP-2000, Unisoku. Pump laser is a 3rd harmonic (355 nm) of pulsed Nd:YAG laser, Surelite EX, Continuum, or a wavelength-tunable laser Horizon OPO, Continuum. Probe light by 150 W xenon lamp for UV/Vis range and 150 W halogen lamp for NIR range transmits through a sample then monochromatized by a spectrograph, Kymera-328, Andor. Detectors are a photomultiplier, R2949, Hamamatsu, for UV/Vis range, and biased InGaAs photodiode, G10899-01K, Hamamatsu, for NIR range. Both detecters were equipped with fast amplifiers, which results in total time resolution of about 10 ns when coupled with the above pulsed laser.
:3 mixture of CH3CN and a 0.1% aqueous solution of trifluoroacetic acid (TFA). Then, 10 μL of the Au clusters were mixed with 20 μL of the SA matrix. When preparing the samples, 2 μL of the mixture was dropped on the steel plate and allowed to dry completely at room temperature. During the measurements, the mass spectra were collected using the positive linear mode. XPS was performed using a JPS-9010MX photoelectron spectrometer (JEOL, Japan). For XPS measurements, all spectra were obtained using the C 1s peak at 285.0 eV as the reference binding energy.18 Time-resolved PL measurements were conducted using a ns-laser flash photolysis system. Nanosecond flash photolysis experiments were performed with a commercially available system, TSP-2000, Unisoku. Pump laser is a 3rd harmonic (355 nm) of pulsed Nd:YAG laser, Surelite EX, Continuum, or a wavelength-tunable laser Horizon OPO, Continuum. Probe light by 150 W xenon lamp for UV/Vis range and 150 W halogen lamp for NIR range transmits through a sample then monochromatized by a spectrograph, Kymera-328, Andor. Detectors are a photomultiplier, R2949, Hamamatsu, for UV/Vis range, and biased InGaAs photodiode, G10899-01K, Hamamatsu, for NIR range. Both detecters were equipped with fast amplifiers, which results in total time resolution of about 10 ns when coupled with the above pulsed laser.
Synthesis of protein-directed Au∼20 clusters
The protein-directed Au cluster synthesis was based on previous literature with slight modifications.9,19 Typically, 500 μL of HAuCl4 solution (20 mM) was added to 500 μL of aqueous protein solution (50 mg mL−1) in a 1.5 mL Eppendorf tube. After intensive mixing for 2 minutes, 100 μL of NaOH solution (1 mM) was introduced, followed by further mixing. The mixture was incubated at 37 °C for 24 h in a heating block. During the process, the color of the mixture changed from light yellow to deep brown. Thereafter, the crude product was dialyzed in Milli-Q water for 24 h using a Spectra/Por6 dialysis membrane (MWCO 10 kDa) to remove unreacted Au3+ and NaOH. After dialysis, the remaining solution in the dialysis tube was collected and lyophilized using an FDU-1200 lyophilizer (EYELA, Japan) for storage. For measurement, the samples were prepared by re-dissolving the lyophilized product in water.Fabrication of films and imaging under UV light excitation
Films were fabricated by mixing HSA-Au clusters with a polymer matrix, prepared as follows: first, 0.5 g PVA (n = 1700, TCI) was dissolved in 5 mL of Milli-Q water at 90 °C with vigorous stirring. Next, 250 μL of PEG (Mw = 200, TCI) was added to the PVA solution with continuous stirring at 90 °C to form a uniform polymer matrix. Finally, 5 mL of the aqueous HSA-Au solution as synthesized above was concentrated to a volume of 1 mL, then mixed with 2 mL of the polymer matrix with vigorous stirring to form a uniform mixture. For film formation, the polymer mixture was placed into a No. 5 glass screw tube bottle (Maruemu corporation, Japan) with a diameter of 25 mm and dried completely in the oven at 50 °C. After cooling to room temperature, the as-synthesized film was taken out from the bottle and cut into various shapes for the X-ray imaging experiments. Control films were synthesized using the same method but with the polymer matrix only. Film shapes included smiley faces, the logo of Osaka University, stars and leaves. The photographs in Fig. 3c were taken using Xiaomi Mi 5 (Xiaomi, China) smart phone under natural light or UV illumination (365 nm).X-ray excited luminescence measurement
X-ray excited luminescence was measured using a small-animal X-ray irradiator equipped with an on-board EM-CCD bioluminescence camera (X-RAD SmART, PXI, North Branford, CT, USA). The samples were dispensed in black 96 well plates (100 μL per well) and placed on the irradiator bed. The X-ray gantry was rotated to position the camera above the sample and the X-ray tube on its side. The X-ray beam was unfiltered and collimated with a 2.5 cm-diameter round aperture, which was large enough to fully irradiate one sample. The X-ray beam was operated at a voltage of 60 kVp and a current of 40 mA. These parameters were optimal for minimizing the stray scattered radiation detected by the camera. The images were acquired as a series of 20 short camera frames (1 s exposure), acquired with an electron gain of 50 and no pixel binning. The frames were then combined using a MATLAB script that removed noise due to stray radiation.Conclusions
In this study, we investigated the photochemical properties of protein-directed Au∼20 clusters upon UV and hard X-ray irradiation. We found that the Au∼20 clusters displayed luminescence upon hard X-ray irradiation both in solution and when embedded in films. These results further demonstrate the possible applications of Au clusters for biological imaging and medical diagnostics.Conflicts of interest
There are no conflicts to declare.Acknowledgements
We thank Prof. B. Cui for kindly allowing us to use equipment. This work was partly supported by Grants-in-Aid for Scientific Research (Projects JP15K13672 (Y. O.) and others) from the MEXT of the Japanese Government, and the Initiative for Realizing Diversity in the Research Environment Project at Osaka University. This work was also performed under the Cooperative Research Program of “Network Joint Research Center for Materials and Devices”. We thank Arun Paraecattil, PhD, from Edanz Group (http://www.edanzediting.com/ac) for editing a draft of this manuscript.Notes and references
- L. Shang, S. Dong and G. U. Nienhaus, Nano Today, 2011, 6, 401–418 CrossRef CAS.
- J. Yang, F. Wang, H. Yuan, L. Zhang, Y. Jiang, X. Zhang, C. Liu, L. Chai, H. Li and M. Stenzel, Nanoscale, 2019, 11, 17967–17980 RSC.
- X.-D. Zhang, Z. Luo, J. Chen, S. Song, X. Yuan, X. Shen, H. Wang, Y. Sun, K. Gao, L. Zhang, S. Fan, D. T. Leong, M. Guo and J. Xie, Sci. Rep., 2015, 5, 8669 CrossRef CAS PubMed.
- X. Kang, H. Chong and M. Zhu, Nanoscale, 2018, 10, 10758–10834 RSC.
- S. Maity, D. Bain and A. Patra, Nanoscale, 2019, 11, 22685–22723 RSC.
- W. Sun, L. Luo, Y. Feng, Y. Cai, Y. Zhuang, R. Xie, H. Chen and X. Chen, Angew. Chem., Int. Ed., 2019, 58, 1–8 CrossRef.
- X.-Y. Ou, T. Guo, L. Song, H.-Y. Liang, Q.-Z. Zhang, J.-Q. Liao, J.-Y. Li, J. Li and H.-H. Yang, Anal. Chem., 2018, 90, 6992–6997 CrossRef CAS PubMed.
- X. Chen, J. Song, X. Chen and H. Yang, Chem. Soc. Rev., 2019, 48, 3073–3101 RSC.
- Y. Osakada, G. Pratx, C. Sun, M. Sakamoto, M. Ahmad, O. Volotskova, Q. Ong, T. Teranishi, Y. Harada, L. Xing and B. Cui, Chem. Commun., 2014, 50, 3549–3551 RSC.
- Y. Xu, J. Sherwood, Y. Qin, D. Crowley, M. Bonizzoni and Y. Bao, Nanoscale, 2014, 6, 1515–1524 RSC.
- A. Kamkaew, F. Chen, Y. Zhan, R. L. Majewski and W. Cai, ACS Nano, 2016, 10, 3918–3935 CrossRef CAS PubMed.
- K. Chaudhari, P. L. Xavier and T. Predeep, ACS Nano, 2011, 5, 8816–8827 CrossRef CAS PubMed.
- L. Su, T. Shu, J. Wang, Z. Zhang and X. Zhang, J. Phys. Chem. C, 2015, 119, 12065–12070 CrossRef CAS.
- T. Shu, J. Wang, L. Su and X. Zhang, Anal. Chem., 2016, 88, 11193–11198 CrossRef CAS PubMed.
- P. L. Xavier, K. Chaudhari, P. K. Verma, S. K. Pal and T. Pradeep, Nanoscale, 2010, 2, 2769–2776 RSC.
- D. M. Chevrier, V. D. Thanthirige, Z. Luo, S. Driscoll, P. Cho, M. A. MacDonald, Q. Yao, R. Guda, J. Xie, E. R. Johnson, A. Chatt, N. Zheng and P. Zhang, Chem. Sci., 2018, 9, 2782–2790 RSC.
- J. Zheng, P. R. Nicovich and R. M. Dickson, Annu. Rev. Phys. Chem., 2007, 58, 409–431 CrossRef CAS PubMed.
- X. Le Guevel, B. Hotzer, G. Jung, K. Hollemeyer, V. Trouillet and M. Schneider, J. Phys. Chem. C, 2011, 115, 10955–10963 CrossRef CAS.
- J. Xie, Y. Zheng and J. Y. Ying, J. Am. Chem. Soc., 2009, 131, 888–889 CrossRef CAS PubMed.
- H.-W. Li, K. Ai and Y. Wu, Chem. Commun., 2011, 47, 9852–9854 RSC.
- H. Kawasaki, K. Yoshimura, K. Hamaguchi and R. Arakawa, Anal. Sci., 2011, 27, 591–596 CrossRef CAS PubMed.
- S. Tobita and T. Yoshihara, Curr. Opin. Chem. Biol., 2016, 33, 39–45 CrossRef CAS PubMed.
- Handbook of Photochemistry, ed. M. Montalti, A. Credi, L. Prodi and M. T. Gandolfi, 3rd edn, 2006 Search PubMed.
- Y. Ren, H. Winter, J. G. Rosch, K. Jung, A. N. Duross, M. R. Landry, G. Pratx and C. Sun, ACS Appl. Nano Mater., 2019, 2, 3718–3727 CrossRef CAS.
- X. Wen, P. Yu, Y.-R. Toh, A.-C. Hsu, Y.-C. Lee and J. Tang, J. Phys. Chem. C, 2012, 116, 19032–19038 CrossRef CAS.
- J. M. Dixon and S. Egusa, J. Am. Chem. Soc., 2018, 140, 2265–2271 CrossRef CAS PubMed.
Footnotes |
| † Electronic supplementary information (ESI) available. See DOI: 10.1039/d0ra01935f |
| ‡ Equally contributed to this work. |
| This journal is © The Royal Society of Chemistry 2020 |