
 Open Access Article
 This Open Access Article is licensed under a Creative Commons Attribution-Non Commercial 3.0 Unported Licence
Phase composition and genesis of pyroxenic jadeite from Guatemala: insights from cathodoluminescence
Chenlu Lin a,
Xuemei He*a,
Zhiyun Lub and
Yuwei Yaoa
a,
Xuemei He*a,
Zhiyun Lub and
Yuwei Yaoa
aSchool of Gemmology, China University of Geosciences, Beijing 100083, China. E-mail: 2009170017@cugb.edu.cn; Hexuemei3127@126.com; 790473878@qq.com
bState Key Laboratory of Superhard Materials, College of Physics, Jilin University, Changchun 130012, China. E-mail: zylu@cugb.edu.cn
First published on 21st April 2020
Abstract
Guatemalan jadeite has a long history, and much Guatemalan jadeite can be found on the market today with a variety of colors and species diversity. Seven varieties of green pyroxenic jadeite from Guatemala with greyish green, yellow green, brilliant green, blue green, dark green, black green and mottled green colors were investigated by combining the methods of XRD, Raman spectroscopy, cathodoluminescence, EPMA and μ-XRF mapping. The results showed that according to the composition, Guatemalan pyroxenic jadeite can be divided into three categories: jadeite jade, omphacite jade, and jadeite–omphacite jade. According to the characteristics of cathodoluminescence, it can be speculated that the formation of jadeite undergoes three stages, and the formation of jadeite jade is mainly due to the crystallization (Jad I) of the early jadeite fluid, along with the second-stage fluid metasomatism/crystallization (Jad II). In the later stage, the fluid that is rich in Ca–Mg–Fe components can replace early Jad I/Jad II, or it can coexist with Jad II, and metamorphism occurs to produce omphacite jade. The jadeite–omphacite jade can be formed when the omphacite fluid with incomplete metasomatism, with uneven texture and reduced transparency.
1. Introduction
Jadeite is a hard and dense monoclinic metamorphic pyroxene that forms under high-pressure and low-temperature conditions (5–11 kbar, 150–400 °C), which are normally found in tectonic subduction zones with fluids.1–3 Due to the special conditions, only a few geological sources exist around the world. In Guatemala, jadeite occurs as blocks in serpentinite mélange in distinct settings on opposite sides of the Motagua fault.4 Jadeite was greatly valued by pre-Hispanic cultures in Mesoamerica, including the Olmecs, the Mayans, and the Aztecs. These great civilizations left behind carved jadeite in many forms.5,6 Guatemala is the second commercial origin in addition to Myanmar.7 With the depletion of Myanmar's jadeite resources and its rising prices, more and more Guatemalan jadeite has entered the Chinese market, with diverse varieties and rich colors. In general, the dominant mineral is jadeite pyroxene (NaAlSi2O6); omphacite, albite, white mica, and other minor minerals can also be present, commonly as replacements of primary jadeite.3Both jadeite and omphacite are forms of monoclinic pyroxene, and the composition of omphacite is complex, usually present in two space groups (P2/n and C2/c); jadeite is relatively pure, mainly being of space group C2/c.8,9 The C2/c space group has the general formula, M2M1{T2O6}. The structure is based on single silicate tetrahedra chains that run along the c-axis. Bonded to these are octahedral M1 chains. The M1 site is a relatively undistorted octahedron, but the M2 site is an irregular polyhedron of eightfold coordination. The C2/c structure requires cation disorder within the M1 as well as within the M2 sites. Zig-zag chains of edge-sharing M1 octahedra are parallel to the crystallographic c-axes. Other zig-zag chains of irregular edge-sharing M2 polyhedra, occupied by larger cations (i.e. Ca2+ or Na+), also run parallel to the c-axes and share common edges with the M1 octahedra. At lower temperatures there is a tendency for the cations to order within the M1 and M2 sites. At sufficiently low temperatures, omphacite in its intermediate composition (Na0.5Ca0.5)(Al0.5Mg0.5)Si2O6 is a cation-ordered pyroxene with two distinct M1 and two M2 sites, denoted as M1 and M11, and M2 and M21. The symmetry is reduced to P2/n.10–13
It is difficult to distinguish jadeite from omphacite under a polarizing microscope, because of their similar optical characteristics, which need to be combined with multiple testing methods for analysis. Common analytical techniques employed in the study of jadeite materials are petrography, X-ray powder diffraction (XRD), Raman spectroscopy, and electron probe microanalysis (EPMA).4 Although these methods can obtain the phase composition and main element distribution of jadeite, they cannot display the internal structures and growth zones of jadeite crystals clearly or intuitively. In contrast, cathodoluminescence enables the rapid identification of minerals, even if they are present in only small volumes and at low concentrations. Many accessory mineral phases or constituents with similar optical properties are overlooked using a conventional petrographic microscope.
Cathodoluminescence (CL) is the phenomenon of light emission on the surface of a material under the bombardment of an electron beam.14,15 The minerals belong to the materials with a very long history in CL studies.16–20 In comparison with the high-purity materials, minerals and rocks are “dirty” with a lot of impurities and defects. Therefore, cathodoluminescence has been developed as a powerful analytical tool for mineralogical and petrological investigations in geosciences and, therefore, its applications are numerous.21 The first applications of CL with petrographic microscopes started in the 20s.16 Cathodoluminescence microscopy can provide very useful information on variations in chemical composition, reflected by visible colors. Different phases contrast well and defects, zoning, and/or internal structures can be revealed using CL microscopy.21 Many of the phases that occur in ceramics, in glasses, and in refractory materials show distinct CL properties, allowing rapid identification of phase distribution and phase transformations.22 In several fields of applied geosciences, CL is an effective addition to conventional analytical methods such as polarizing microscopy, XRD, scanning electron microscopy (SEM) or microprobe analysis.23,24
Although CL has been fully accepted in geological investigations, its important role in the study of the mineralogy involved in a wide variety of problems that have environmental significance has not been fully recognized. The use of CL microscopy to identify and evaluate different growth zones of jadeite is frequently underestimated. There are few studies on the cathodoluminescence of Guatemalan jadeite.
Accordingly, the present article introduces two studies that combine CL microscopy, phase investigation of green pyroxenic jadeite from Guatemala, and jadeite generations. We investigated 7 different Guatemala jadeite materials with different colors (greyish green, yellow green, vivid green, blue green, dark green, black green and mottled green) using X-ray powder diffraction, polarizing microscopy, Raman spectroscopy, cathodoluminescence, EPMA, and micro X-ray fluorescence (μ-XRF).
2. Materials and methods
All the tested samples came from Guatemala. The seven pyroxenic jadeite samples collected were characterized by their color, ranging from greyish green, yellow green, vivid green, blue green, dark green, black green and mottled green, and they were labelled Gre G, Yel G, Viv G, Blu G, Dar G, Bla G, and Mot G, respectively, as shown in Fig. 1.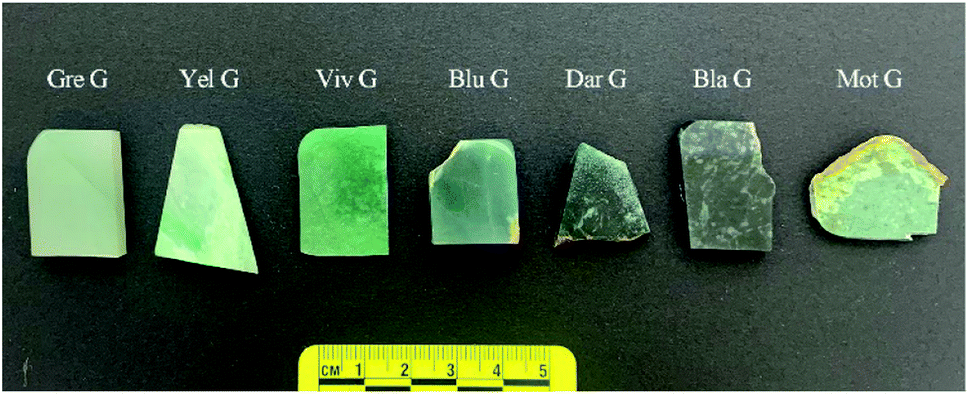 | ||
| Fig. 1 Seven jadeite samples with different color characteristics, from Guatemala. | ||
The surfaces of the samples were polished for μ-XRF and Raman spectroscopy. The samples were ground into mineral thin sections for EPMA testing, and the structural characteristics and the phenomenon of cathodoluminescence were observed. The scraps were pulverized into 300 mesh powders for powder X-ray diffraction analysis.
The phase composition of the samples was analyzed by powder X-ray diffraction (XRD), which was completed in the Powder XRD Laboratory, China University of Geosciences, Beijing (CUGB). The powder XRD data was acquired with a Rigaku Smart lab diffractometer equipped with a conventional copper target X-ray tube set to 45 kV and 200 mA, and with a graphite monochromator, where the scanning speed was 8° min−1 in the range of 3° < 2θ < 70°. The results were processed using the Search-Match software package with the International Center of Diffraction Data (ICDD).
The chemical analyses were verified by traditional EPMA methods on a JXA 8230 microprobe at the School of Materials Science and Engineering, Tsinghua University, at conditions of 15 kV, 20 nA and with a spot size of 1–10 μm. The signal was collected using wavelength-dispersive spectrometers. The results were calibrated by natural and synthetic minerals.
In order to analyze the mineral composition and structural characteristics of the Guatemalan jadeite, an Olympus BX-51 polarizing microscope was used to observe the mineral thin sections.
Cathodoluminescence images (CL imaging) were collected at the Cathode Luminescence Laboratory, CUGB. The test was performed using a CL5-2 cathode luminometer conveniently installed on a Leica microscope stage. First, the mineral thin section to be analyzed was put into a vacuum chamber. Afterwards, with the extraction of the ultimate vacuum (0.3 Pa), a stable voltage and beam were excited and maintained. The best working beam was generally 100–500 μA, and when the voltage reached about 10 kV, the sample could be excited with high brightness.
The Bruker M4 TORNADO fluorescence spectrometer of the National Research Center for Geoanalysis was used to analyze the point and plane distributions of the elements in the Guatemalan jadeite samples with representative special structure. The spectrometer was equipped with an X-ray tube (Rh anode) with a polycapillary X-ray optic, which can collect the X-rays from the tube and focus them onto the smallest sample areas with a diameter of <25 μm. The system worked at 50 kV and 600 μA, and a vacuum pump was used to provide a vacuum environment, allowing for detection of Na. The signal excited by jadeite was detected with a single 30 mm2 SDD, enabling count rates of >600 kcps with an acquisition time of 10 ms per pixel. The data was processed by the mineral analyzer software for M4 TORNADO.
The Raman spectra were recorded on polished blocks with a HORIBA HR-Evolution Raman spectrometer at the Gem Research Center, the School of Gemology, CUGB. The system was equipped with 50× magnification objectives, a 600-lines-per-millimeter diffraction grating and a Peltier-cooled, Si-based CCD detector that worked with a 532 nm solid stage laser, and the laser power (100 mW at the sample surface) was well below the threshold for thermally induced sample degradation. With this system, sample areas as small as 1 μm could be analyzed. The Raman spectra were all recorded at a range of 100 to 1100 cm−1, where the collection time was 10 s and the accumulation was 3 scans.
3. Results
3.1 XRD
XRD tests were performed on seven varieties of Guatemalan jadeite powder, and the results are shown in Fig. 2. The diffraction patterns show that the strongest peaks of the four varieties, Gre G, Yel G, Viv G, and Blu G, coincided with the jadeite standard spectrum peaks that were mainly composed of the jadeite phase.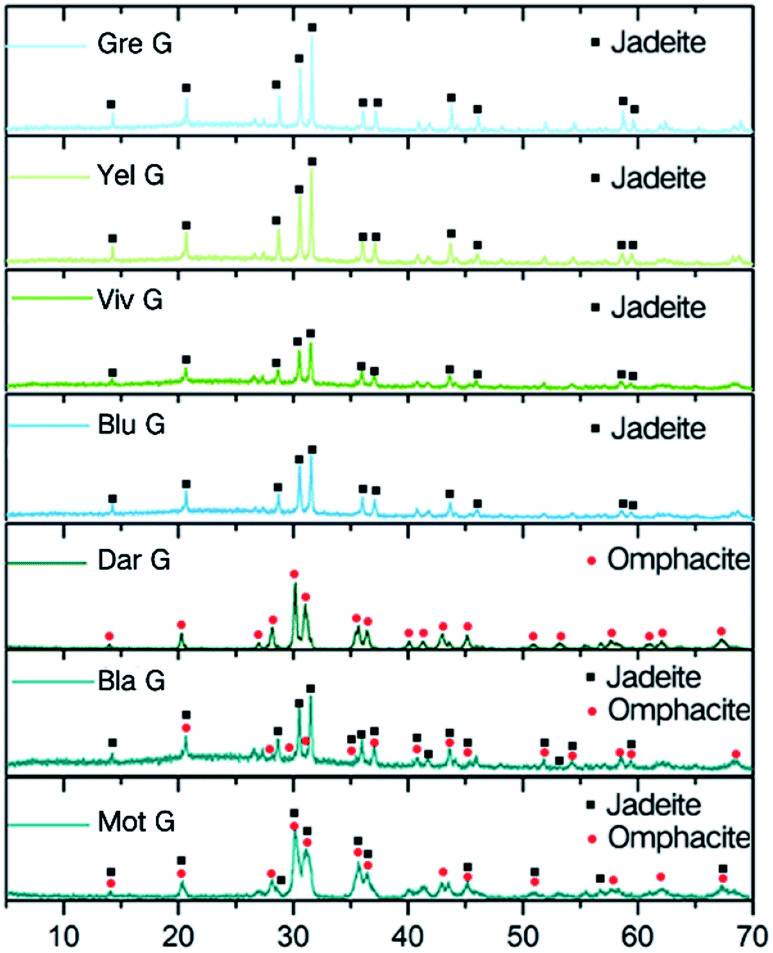 | ||
| Fig. 2 XRD diffraction images of the samples dominated by the jadeite phase, the omphacite phase and the mixed jadeite–omphacite phase. | ||
Dar G coincided with the omphacite standard spectrum peaks, which are mainly composed of the omphacite phase. Bla G and Mot G showed mixed phases of jadeite and omphacite. Bla G was mainly composed of jadeite and contains a small amount of omphacite. Mot G was mainly composed of omphacite and contains a small amount of jadeite. Some eigenvalues are slightly shifted, and this may be related to the isomorphism of ions in pyroxene.
In this paper, seven varieties of Guatemalan jadeites were divided and discussed according to their phases, which were the “jadeite phase”, the “omphacite phase” and the “mixed phase”.
3.2 Jadeite phase
The main mineral compositions of the Gre G, Yel G, Viv G, and Blu G samples are jadeite, belonging to jadeite jade (Fig. 4a). Gre G has a delicate quality and a high transparency. It has mainly a granular metacrystal texture (Fig. 4b). Yel G particles are coarse, and have cleavage flashes on appearance, showing an unequal granular metacrystal texture (Fig. 4c). Viv G has a fine quality and bright color, showing a columnar and fibrous radiation texture (Fig. 4d). Blu G has a fine-grained quality, with mainly a columnar and fibrous metacrystal texture (Fig. 4e). | ||
| Fig. 3 CL image of Gre G at 100× magnification. | ||
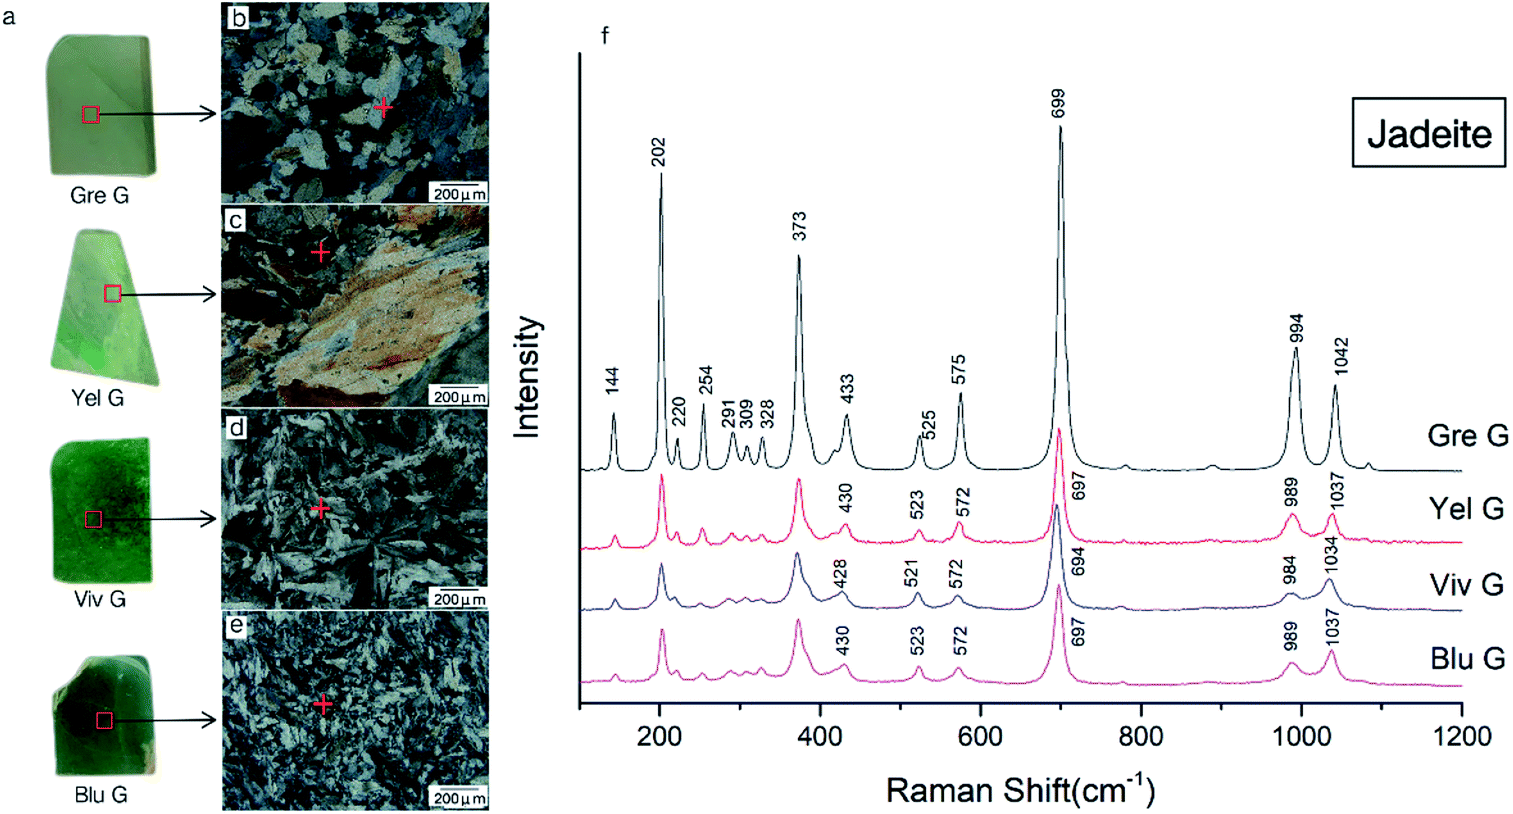 | ||
| Fig. 4 Raman test area and Raman spectra of jadeite jade: (a) Raman test area of four jadeite samples; (b–e) the texture images of the thin-sections corresponding to the blocks under the microscope, using crossed polarizers (100× magnification). Gre G displays a granular metacrystal texture, Yel G displays an unequal granular metacrystal texture, Viv G displays a columnar and fibrous radiation texture, and Blu G displays a columnar and fibrous metacrystal texture; (f) Raman spectra of four samples, which coincide with the jadeite peaks. | ||
Raman spectroscopy can identify different species of pyroxenes and can detect order–disorder transitions.10,12,25,26 For pyroxene, the Raman spectral wavenumber in the band of 950–1200 cm−1 is caused by Si–O non-bridging and bridging stretching vibrations, which are mainly related to the Si–Onb mode; the wavenumber of the Si–Ob–Si stretching vibration can be assigned to the range of 650–750 cm−1, and the position depends on the bond angle and the cation type of M2. The band of 500–590 cm−1 is caused by the bending vibration of O–Si–O in the silicon oxygen tetrahedron. The band of 200–490 cm−1 belongs to the vibration of M–O.10,26 In addition, two modes may result from the Mg–O octahedron (375–490 cm−1) and two modes may result from the Fe–O octahedron (225–325 cm−1).25
The Raman test sites and results for each sample are shown in Fig. 4. The peaks of the samples Gre G, Yel G, Viv G, and Blu G are similar, and there are five relatively strong Raman shift peaks nearby at 202, 373, 699, 994, and 1042 cm−1, which belong to typical jadeite peaks (Fig. 4f). Among them, the peaks of Gre G show a narrow half-width and sharp shape, indicating that the [SiO4] tetrahedron structure in the jadeite crystal is stable, the same chemical bond has little difference, and the mineral crystallinity is high. The peak intensities of Yel G, Blu G, and Viv G are not as good as those of Gre G, and the peak positions are slightly shifted to lower wavenumbers. This is related to the low crystallinity of jadeite and the ion substitution at the M1 and M2 positions.25
Cathodoluminescence was performed on four jadeite jade samples and electron probe micro analysis was performed on different luminescence regions. The results are shown in Fig. 5. The luminescence of the greyish green sample (Gre G) was mainly bright purple. The base of the yellow green, vivid green and blue green samples (Yel G, Viv G, and Blu G) showed green luminescence, accompanied by some purple luminescence. It is worth mentioning that visible purple luminescence in the Yel G and Blu G samples appeared as the remaining residue, and some parts of the Viv G sample did not emit light (Fig. 5b, d, f, and h). Each sample mineral in different luminous parts can be displayed by the Quad-Jd-Ae triangle projection diagram (Fig. 5i), and it can be seen that all luminous minerals are jadeite.
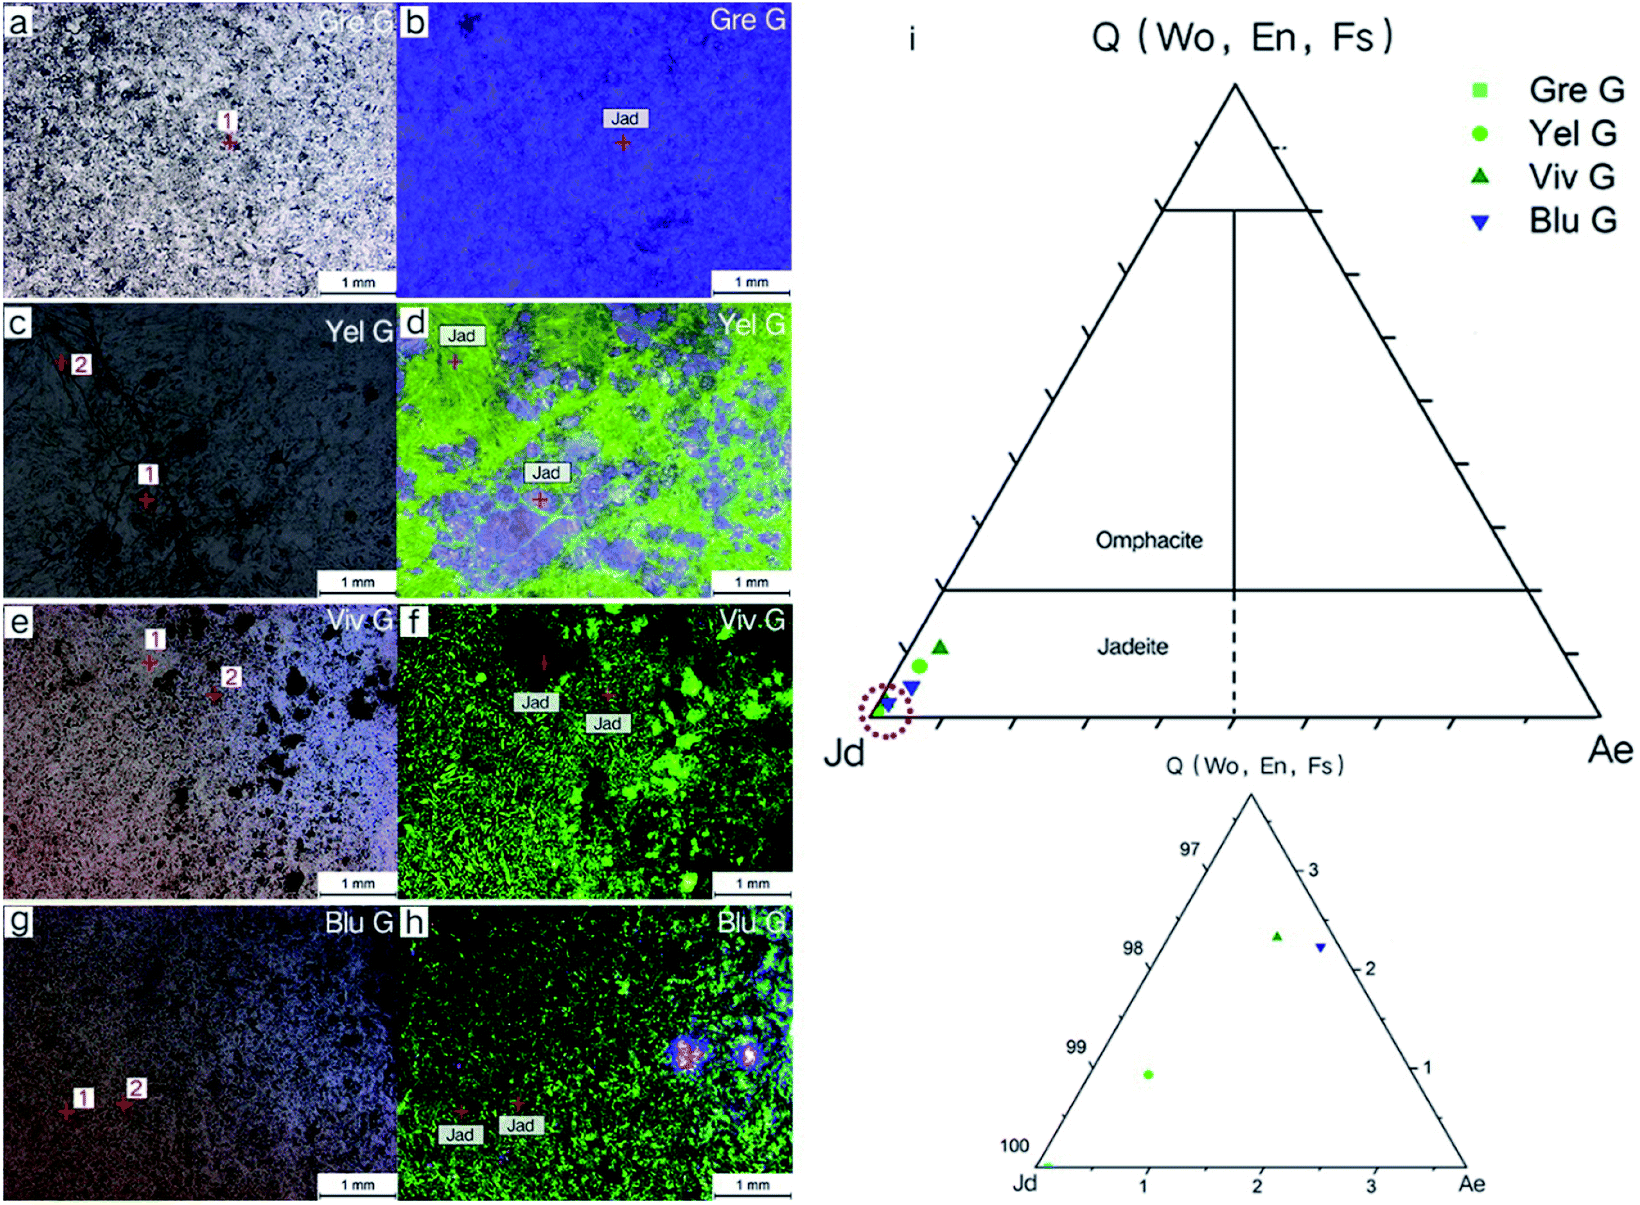 | ||
| Fig. 5 CL imaging of various jadeite jade thin sections and EPMA projections; (a, c, e and g) the images of four jadeite jade thin-sections under a microscope, using single polarizers; (b, d, f and h) images of four jadeite jade thin-sections using CL microscopy, mainly showing purple and green luminescence; (i) Quad-Jd-Ae triangle projection point diagram of four samples. | ||
Oscillatory zoning is a common phenomenon observed in crystals grown from a melt or from hydrothermal fluids.21 An enlarged cathodoluminescence observation image of Gre G shows typical annulus structure (Fig. 3), indicating the origin of fluid crystallization. The annulus boundary is flat and continuous, indicating that the crystallization environment of the fluid is relatively stable.
3.3 Omphacite phase
The mineral composition of the Dar G sample is mainly omphacite, belonging to omphacite jade. Dar G has a delicate quality, a dark green color (Fig. 6a), and shows granular, columnar and fibrous metacrystal textures (Fig. 6b). The Raman test site and results are shown in Fig. 6. Peaks near the 146, 202, 337, 373, 409, 563, 682, and 1024 cm−1 regions can be characteristically assigned to omphacite (Fig. 6c).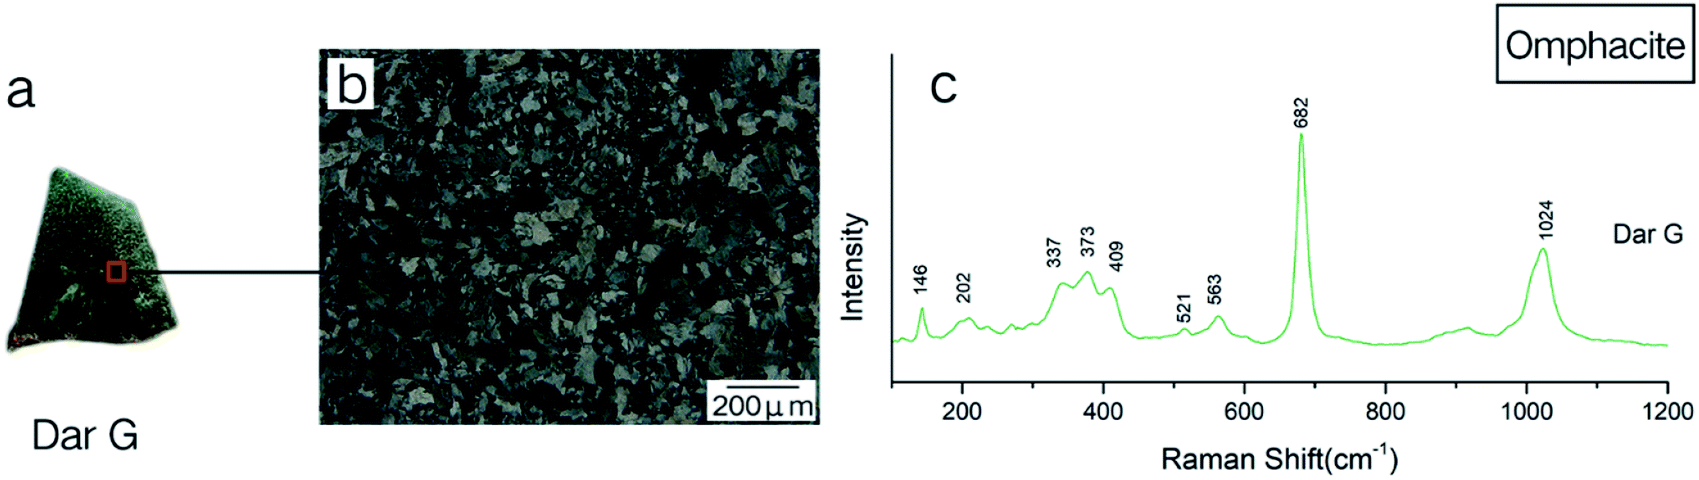 | ||
| Fig. 6 Raman test area and Raman spectrum of omphacite jade: (a) Raman test area of Dar G; (b) the texture image of the thin-section, corresponding to the block under the microscope using crossed polarizers (100× magnification). Dar G has a granular, columnar and fibrous metacrystal texture; (c) Raman spectra of Dar G, which coincides with the P2/n-type omphacite peaks. | ||
Omphacite is a monoclinic pyroxene with a complex composition. The conversion of the C2/c structure to the P2/n structure is related to the change in chemical composition and temperature.10 The peak caused by the asymmetrical bending vibration of Si–O–Si around 400 cm−1 changed significantly with the addition of the Ca–Mg–Fe pyroxene component in jadeite.
Pure jadeite has a strong peak at 373 cm−1 and a weak 430 cm−1 peak near 400 cm−1, and when the Ca–Mg–Fe pyroxene component is added to the jadeite, the bond length of the silicon–oxygen tetrahedron changes. The peak at 373 cm−1 shifted slightly to 376 cm−1, and gentle hills appeared between 376 and 432 cm−1. When the Ca–Mg–Fe pyroxene component approached 50%, the C2/c structure completely changed to the P2/n structure, with the main peak of 376 disappearing. A protruding hill-shaped platform between 351–408 cm−1 shows that the spacing of the Si–O bonds has no major value, but it was replaced by several similar bond lengths.27
The band intensities of Dar G at 337, 373, and 409 cm−1 are comparable, and match the peaks of the omphacite spectrum of the P2/n structure, indicating that the main constituent minerals in the Dar G sample are of P2/n-type omphacite, where the Ca–Fe–Mg pyroxene composition is close to 50%.
The cathodoluminescence image and the EPMA trigonometric projection of the Dar G sample are shown in Fig. 7. The substrate of omphacite jade is mainly dark black luminous, accompanied by blue and a small amount of green luminous minerals (Fig. 7a–d). The EPMA results show that the green luminous mineral is jadeite, and the dark black and blue luminous minerals are omphacite. The blue luminous omphacite and green luminous jadeite are distributed in a “star-like” shape on the base omphacite.
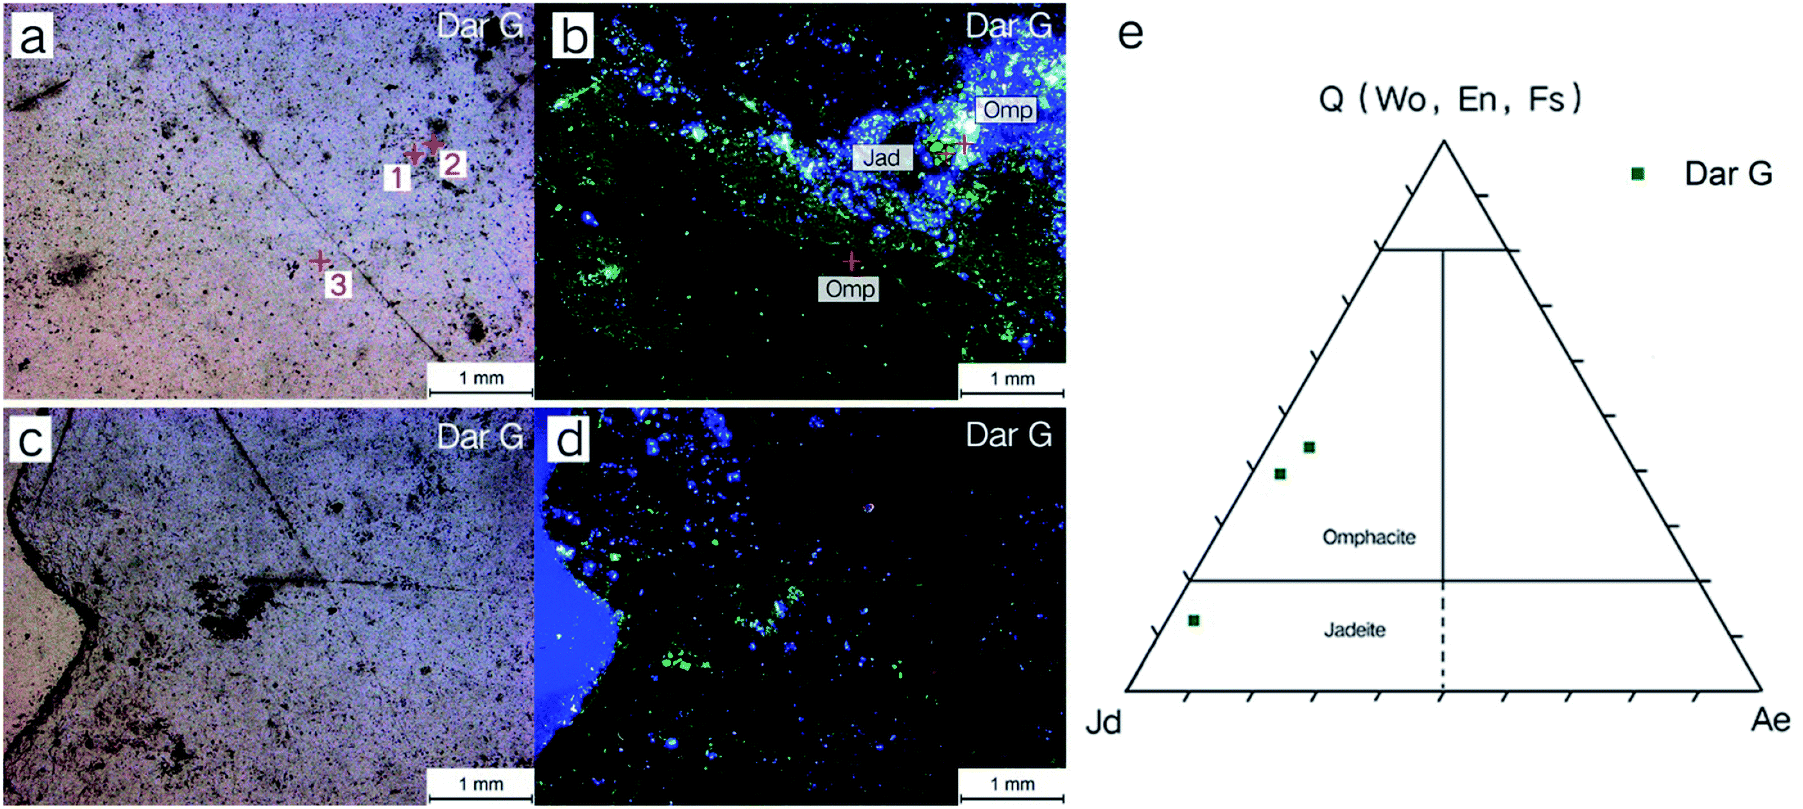 | ||
| Fig. 7 CL imaging of thin sections of Dar G and EPMA projections: (a and c) the image of the Dar G thin-section under a microscope using single polarizers; (b and d) images of the Dar G thin-section under cathodoluminescence (CL) microscopy, mainly showing dark black, blue and a few green luminescence colors; (e) Quad-Jd-Ae triangle projection point diagram for the Dar G sample. | ||
3.4 Mixed phase
Bla G and Mot G, two varieties of Guatemalan pyroxenic jadeite, are composed of jadeite and omphacite, belonging to jadeite–omphacite jade. The quality of these varieties are rough, with some spotted spots visible on the sample surface, along with low transparency (Fig. 8a), showing a metasomatic porphyritic residual structure (Fig. 8b), with columnar, fibrous metacrystal textures (Fig. 8c), etc.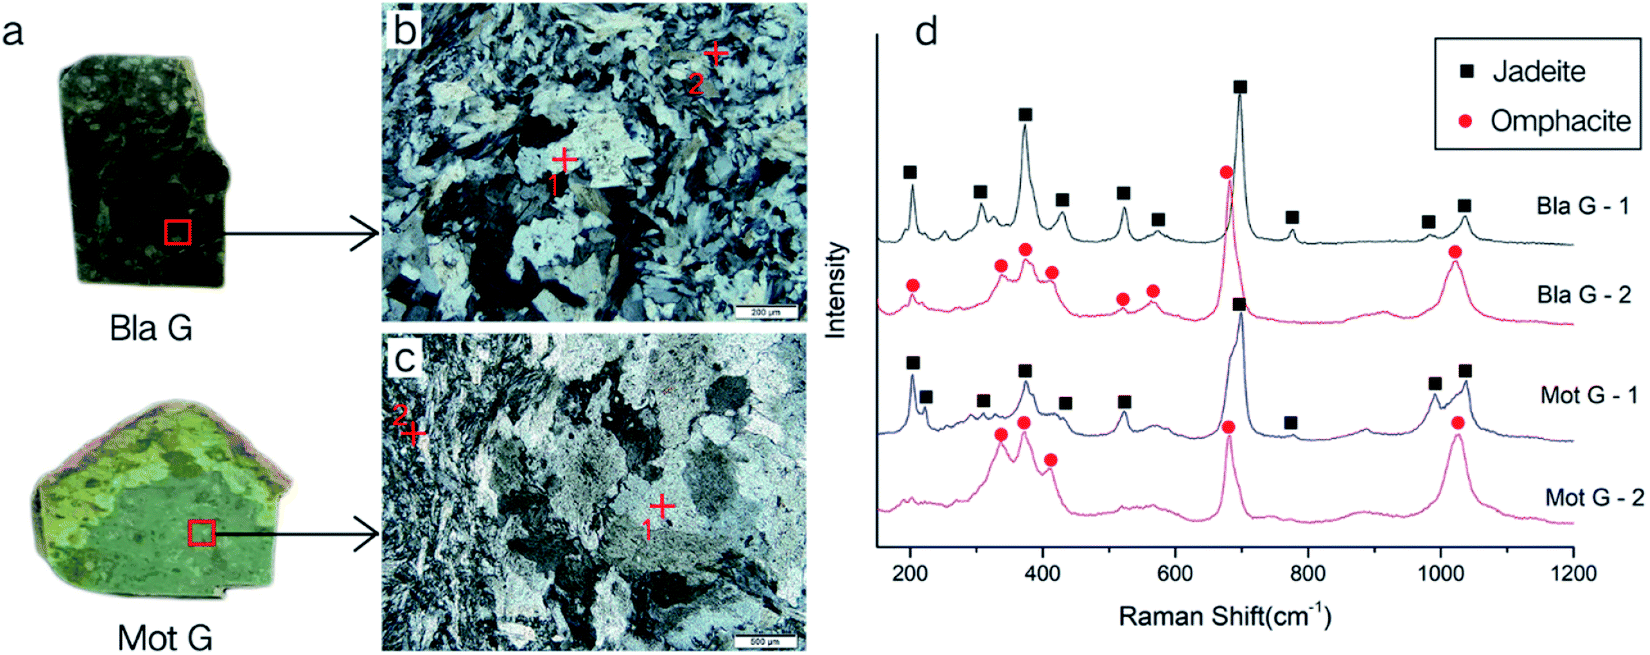 | ||
| Fig. 8 Raman test area and Raman spectra of jadeite–omphacite jade: (a) Raman test areas of the Bla G and Mot G samples; (b and c) the texture images of the thin-sections corresponding to the blocks using a microscope with crossed polarizers (100× magnification). The observed structure images show the metasomatic residual structure of the isolated islands; (d) Raman spectra of Bla G and Mot G samples. The test point 1 coincides with the jadeite and the test point 2 coincides with omphacite. | ||
The Raman test sites and results are shown in Fig. 8. There are both jadeite and omphacite Raman spectra peaks of Bla G and Mot G (Fig. 8d). The test points shown as jadeite peaks are located in the isolated island-shaped residues. The test point shown as the omphacite peak is located at the columnar and fibrous metacrystal around the island, where the mineral particles are relatively small. The characteristics of the peak match the P2/n structure of omphacite.
Cathodoluminescence was performed on two jadeite–omphacite jade samples, and EPMA were performed on different luminescence regions. The results are shown in Fig. 9. The base of the black green sample (Bla G) showed green luminescence, with some purple luminescence in an island shape (Fig. 9b). It could be observed that blue luminous veins cut the early jadeite and surround the edge of the purple island, showing that it is formed behind the purple luminous mineral. The results of the EPMA test show that the purple and green luminous minerals are jadeite, and that the blue luminescence is omphacite (Fig. 9e), indicating that the early jadeite has been replaced by omphacite.
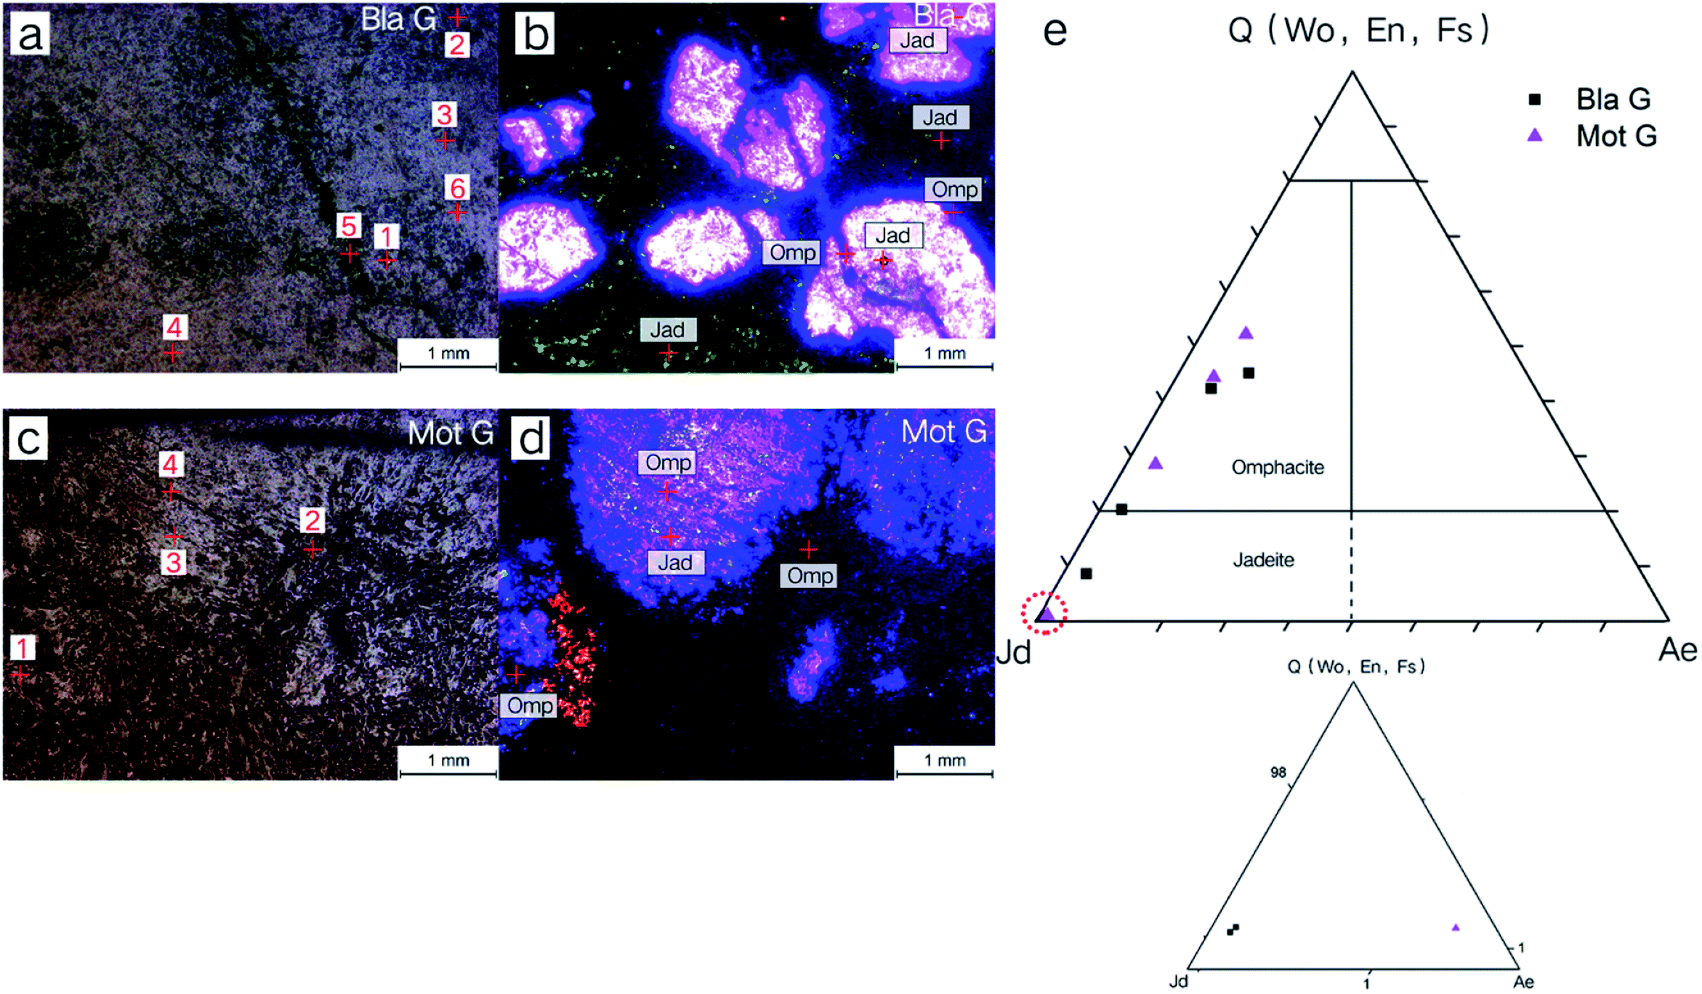 | ||
| Fig. 9 Cathodoluminescence images of thin sections of mixed-phase jadeite and EPMA projections: (a and c) the images of two mixed-phase jadeite thin-sections under a microscope using single polarizers; (b and d) images of two mixed-phase jadeite thin-sections under cathodoluminescence (CL) microscopy, mainly showing purple, green, blue, and dark black luminescence; (e) Quad-Jd-Ae triangle projection point diagram of the two samples. | ||
The mottled green sample (Mot G) base is dark black luminescence, and the island-shaped purple luminescence also exists, with an obvious purple luminous core. The core pyroxene is completely purple in luminescence and its rim is slightly blueish, and this can be speculated to be related to the later metasomatism of the omphacite.
X-ray fluorescence (XRF) is a non-destructive technique with relatively high precision. Recent developments in instrumentation and automation techniques have been applied to XRF, thus producing spectrometers for micro X-ray fluorescence (μ-XRF). μ-XRF can be used to assess the major element chemical compositions of minerals.28–31 μ-XRF scanning was performed on two mixed-phase jadeite (Bla G and Mot G) with clear metamorphism, in order to study the distribution of the different elements. Images with significantly different element distributions were selected, as shown in Fig. 10.
 | ||
| Fig. 10 Elemental maps produced by μ-XRF for Bla G (a) and Mot G (b). The distributions of Na and Al correspond to the isolated island-like jadeite. The distribution of Ca, Mg, Fe, Mn and Ni is linked to the presence of omphacite. | ||
The results showed that the isolated island-like jadeite in Bla G contained more Al element, and the surrounding metasomatic minerals contained more Ni, Ba, Fe, Ca, Mg, Mn, and Ni. It is worth mentioning that the vein going through the island-like jadeite was rich in Fe, Ca and Mg, and is intertwined in a network vein on the substrate. Mot G also showed clear elemental distribution differences between the isolated island-shaped jadeite and the meta-minerals. The minerals that have not been substituted are rich in Al and Na, while the base metasomatic minerals are rich in Ca, Mg, Fe, P, Mn, and Ni.
According to the tests, it can be inferred that the island-like mineral without metasomatic is jadeite, while the base is a metasomatic mineral. The island-like jadeite represents a white-colored “patch” on the appearance of the sample.
4. Discussion
4.1 Relationship between CL and mineral composition
The cationic substitution phenomenon is commonly seen in jadeite. Some substitutions, such as Fe ions replacing Al ions, lead to the increase of the ion radius, and this creates conditions for the entry of trace elements. There is a close relationship between trace element incorporation and CL properties of minerals. Some trace elements are related to the color and intensity of cathodoluminescence.21,32 Under CL microscopy, jadeite pyroxenic usually shows a dark-medium bright green-yellow green colour. When the jadeite component is pure, it emits a purple-red color. The Fe content is related to its blue luminescence, and the luminescence intensity changes from bright to dark with an increase in Fe content.14 A low content of Cr3+ and V3+ are activators of cathodoluminescence, but when the content is high, they are quenchers of cathodoluminescence.33The luminescence of pyroxenic jadeite from Guatemala mainly shows purple-purplish red, yellow green-green, blue, and dark black colors. The EPMA results of the composition analysis of minerals with different cathodoluminescence colors are shown in Table 1, and the Quad-Jd-Ae triangular projection is shown in Fig. 11. By combining μ-XRF, EPMA, and cathodoluminescence, the regular relationships between different luminous colors and the mineral components/elements can be obtained:
| Color | Number | Na2O | Al2O3 | CaO | MgO | FeO | Cr2O3 | TiO2 | NiO | MnO |
|---|---|---|---|---|---|---|---|---|---|---|
| Purple | Gre G-1 | 16.39 | 24.59 | 0.08 | 0.01 | 0.03 | 0.00 | 0.02 | 0.03 | 0.01 |
| Yel G-1 | 15.97 | 24.22 | 0.27 | 0.16 | 0.19 | 0.02 | 0.01 | 0.02 | 0.01 | |
| Bla G-1 | 16.03 | 23.01 | 0.33 | 0.20 | 0.17 | 0.01 | 0.04 | 0.00 | 0.01 | |
| Bla G-2 | 15.92 | 23.50 | 0.35 | 0.17 | 0.17 | 0.00 | 0.02 | 0.02 | 0.02 | |
| Mot G-3 | 16.31 | 23.45 | 0.42 | 0.13 | 0.39 | 0.03 | 0.00 | 0.03 | 0.02 | |
| Green | Yel G-2 | 14.77 | 23.17 | 1.08 | 0.85 | 0.30 | 0.01 | 0.04 | 0.00 | 0.02 |
| Viv G-2 | 15.59 | 22.88 | 0.76 | 0.44 | 0.32 | 0.00 | 0.11 | 0.00 | 0.00 | |
| Blu G-1 | 15.54 | 21.17 | 1.35 | 1.11 | 1.07 | 0.05 | 0.23 | 0.00 | 0.01 | |
| Blu G-2 | 15.87 | 22.94 | 0.70 | 0.38 | 0.48 | 0.00 | 0.00 | 0.00 | 0.00 | |
| Dar G-1 | 13.26 | 20.25 | 3.50 | 2.40 | 1.42 | 0.00 | 0.01 | 0.00 | 0.01 | |
| Bla G-3 | 14.53 | 21.20 | 2.43 | 1.82 | 1.22 | 0.00 | 0.30 | 0.02 | 0.00 | |
| Bla G-4 | 12.80 | 18.30 | 5.15 | 3.96 | 1.13 | 0.00 | 0.03 | 0.02 | 0.02 | |
| Blue | Dar G-2 | 9.00 | 13.11 | 10.79 | 6.97 | 1.46 | 0.01 | 0.30 | 0.00 | 0.07 |
| Bla G-5 | 8.99 | 11.96 | 11.19 | 7.51 | 2.05 | 0.00 | 0.19 | 0.00 | 0.08 | |
| Bla G-6 | 8.06 | 10.51 | 12.61 | 7.95 | 3.74 | 0.00 | 0.11 | 0.03 | 0.09 | |
| Mot G-4 | 8.95 | 11.94 | 11.87 | 8.17 | 1.95 | 0.06 | 0.07 | 0.05 | 0.04 | |
| Dark black | Dar G-3 | 7.93 | 11.31 | 11.77 | 7.20 | 3.08 | 0.01 | 0.17 | 0.00 | 0.07 |
| Mot G-1 | 7.23 | 9.71 | 14.14 | 9.34 | 2.33 | 0.09 | 0.21 | 0.05 | 0.15 | |
| Mot G-2 | 9.90 | 15.05 | 7.50 | 4.74 | 1.56 | 0.00 | 0.15 | 0.02 | 0.04 | |
| None | Viv G-1 | 14.51 | 20.02 | 2.96 | 2.06 | 1.40 | 0.15 | 0.19 | 0.01 | 0.00 |
 | ||
| Fig. 11 Projection of luminescent minerals of different colors under cathodoluminescence (CL) microscopy. It can be seen that the purple luminescent mineral is mainly jadeite with a high Jd terminal element content, and the green luminescent mineral is also jadeite with a higher Ca–Mg–Fe component. The blue and dark black luminous minerals are mainly P2-type omphacite. The point in the c-omphacite region in the picture is Mot G-2, which is located in the gap of the island-like purple luminous jadeite, where the content of the Ca–Mg–Fe component is reduced by substitution. | ||
Purple luminescence: the luminous mineral is jadeite, where the chemical composition is simple. Jadeite is relatively pure, and this results in a high “Jd” terminal element content.
Green luminescence: the luminous mineral is jadeite, where the chemical composition is relatively complicated. More Ca and Mg ions replace the positions of M2 and M1, and the content of Fe, Ti, and Ba is more than that of pure jadeite.
Blue/dark black luminescence: the luminous mineral is mainly omphacite with a complex chemical composition. The replacement of Ca, Mg, and Fe is significantly increased, and the amount of trace elements of Mn, Ti, P, and Ni is also increased.
Non-luminous: Viv G has some non-luminous areas. The main mineral in this area is jadeite, and the content of Cr2O3 is higher (0.15%) than other bright light-emitting areas (0–0.06%). It is presumed that the trace element of Cr3+ is too high to suppress the luminescence of the jadeite mineral.
4.2 Speculation on the formation period of Guatemalan pyroxenic jadeite
The genesis of jadeite is still a focus of academic debate. Traditional theories are summarized as follows: the magma origin,34,35 metamorphogenesis,36,37 the heat hydrogenetic origin and the neomagmatic origin (melt/fluid origin).Current research shows that jadeitite rocks either directly precipitated and crystallized in the aqueous fluid associated with the subduction zone (P-type), or pre-existing rocks formed in this fluid-interpreted subduction zone (R-type). Columnar jadeite with a rhythmic annulus is the main evidence for crystallization in fluid. Most jadeitites are of the P type and are formed by the direct precipitation of some fluids rich in sodium, aluminum, and silicon in cavities, fissures, or fractures in serpentinized peridotite or in high-pressure and low-temperature rocks. In contrast, R-type jadeite retains the original rock structure, the inherited minerals and geochemical characteristics of pre-existing rocks, and both types may exist in the same origin or system.38–40
Another important application of CL is to help reconstruct the growth conditions of the minerals and to reveal secondary alteration processes such as deformation, fluid flow and related processes, such as recrystallization.21 The thin-section of the Gre G sample was magnified for luminescence observation. The purple luminescent mineral showed a typical zonal texture, indicating the P-type origin and that it had been crystallized directly by the fluid. Viv G is a columnar and self-shaped radial aggregate jadeite, and this reflects that the jadeite rock was formed in relatively stable temperature and pressure conditions, for a long time and in a stable and static homogeneous medium. By combining the results of the cathodoluminescence features, EPMA and μ-XRF mapping, it can be presumed that there are three generations in the formation of Guatemalan pyroxenic jadeite:
(1) First generation: the early jadeite fluid crystallizes to form the first stage jadeite (Jad I), and later may undergo metamorphism.
(2) Second generation: the second-stage fluid crystallizes/undergoes metasomatism to form the second-stage jadeite (Jad II), which contains more Ca–Mg–Fe component content than Jad I.
(3) Third generation: the omphacite fluid, which is rich in Ca–Mg–Fe components, flows through the early jadeite (Jad I/Jad II), or coexists with the late jadeite (Jad II), and metasomatism occurs.
Early fluid crystallizes to form the first generation jadeite (Jad I), a purple luminescent mineral, which is relatively complete in its crystal form, and which may undergo metamorphism in a later stage. When a fluid containing a certain amount of Ca–Mg–Fe component is metasomatic in the original first-stage jadeite, it can generate Jad II, green luminescent minerals, such as Yel G and Blu G; Jad II may also be formed directly from the crystallization of this fluid, such as in Viv G. In the later period, the Ca–Mg–Fe-rich omphacite fluid flows through the jadeite formed earlier, and this can generate omphacite jade, such as Dar G. Residues will occur when incomplete metasomatism is carried out, making the jadeite texture uneven and reducing its transparency, such as in Bla G and Mot G.
5. Conclusions
Our systematic investigation of seven varieties of green pyroxenic jadeite from Guatemala demonstrates that the composition of green jadeite is not only made up of pyroxenic jadeite. There are three types of phase combinations: the jadeite phase, omphacite phase and the mixed phase. According to the compositions, Guatemalan pyroxenic jadeite can be divided into three categories: jadeite jade, omphacite jade, and jadeite–omphacite jade. They have mainly granular, columnar and fibrous metacrystal textures. A metasomatic residual structure can be seen frequently occurring in jadeite–omphacite jade.The main constituent mineral of jadeite jade is jadeite, and the main constituent mineral of omphacite jade is omphacite, while jadeite–omphacite jade is a mixed phase of jadeite and omphacite minerals. The formation of jadeite jade is mainly due to the fluid crystallization of early jadeite (Jad I), and the second-stage fluid metastasis/crystallization into Jad II. In the later stages, the fluid that is rich in Ca–Mg–Fe components can replace early jade I/Jad II, or it can co-exist with jade II. The metamorphism occurs during metasomatism, when omphacite is formed. The omphacite formed in the third stage belongs to the P2/n space group. When metasomatism is incomplete, the metasomatic remnants will form a harbor or an island shape, making the jadeite uneven in texture and reducing its transparency.
Using cathodoluminescence (CL) microscopy, the first-stage jadeite (Jad I) shows purple-purple red luminescence; the second-stage jadeite (Jad II) shows green luminescence, and when the Cr content is high, green light emission was suppressed, causing the mineral to exhibit non-emission. Omphacite formed at the third-stage shows blue or dark black luminescence. At present, there is no rule about the difference between blue luminescence and dark black luminescence, and this needs further study.
Compared with Jad I, Jad II has the phenomenon of Ca and Mg ions being present instead of Na and Mg, and its Fe, Ti, and Ba contents are higher. The chemical composition of omphacite is more complicated. Ca, Mg, Fe, Mn, Ti, P, and Ni contents in omphacite are higher than in the jadeite that formed in the early stage.
Conflicts of interest
There are no conflicts to declare.Acknowledgements
The authors thank Drs Zongfeng Yang and Yingying Li for recording the cathodoluminescence images and Dr Manman Xie for recording the μ-XRF mapping data. We also thank the Laboratory of the Jewelry College, China University of Geosciences, Beijing, for their support.Notes and references
- G. Harlow, J. Metamorph. Geol., 1994, 12, 49–68 CrossRef CAS.
- A. I. Okay, Mineral. Mag., 1997, 61, 835–843 CrossRef CAS.
- C. A. Johnson and G. E. Harlow, Geology, 1999, 27, 629–632 CrossRef CAS.
- G. E. Harlow, V. B. Sisson and S. S. Sorensen, Geol. Acta, 2011, 9, 0363–0387 CAS.
- D. Hargett, Gems Gemol., 1990, 26, 134–141 CrossRef.
- R. Seitz, G. E. Harlow, V. B. Sisson and K. E. Taube, Antiquity, 2001, 75, 687–688 CrossRef.
- G. E. Harlow, V. B. Sisson, H. G. Avé Lallemant, S. S. Sorensen and R. Seitz, Ofioliti, 2003, 28, 115–120 Search PubMed.
- G. Rossi, D. C. Smith, L. Ungaretti and M. C. Domeneghetti, Contrib. Mineral. Petrol., 1983, 83, 247–258 CrossRef CAS.
- A. Pavese, V. Diella, D. Levy and M. Hanfland, Phys. Chem. Miner., 2001, 28, 9–16 CrossRef CAS.
- A. Katerinopoulou, M. Musso and G. Amthauer, Vib. Spectrosc., 2008, 48, 163–167 CrossRef CAS.
- F. Pandolfo, F. Nestola, F. Cámara and M. C. Domeneghetti, Am. Mineral., 2012, 97, 407–414 CrossRef CAS.
- A. Coccato, S. Karampelas, M. Wörle, S. van Willigen and P. Pétrequin, J. Raman Spectrosc., 2014, 45, 1260–1265 CrossRef CAS.
- D. Buchs and R. A. Howie, in Reference Module in Earth Systems and Environmental Sciences, Elsevier, 2016 Search PubMed.
- Z. Nai, H. Jin-fa and G. Hong-li, J. Gems Gemmol., 2000, 2, 13–15 Search PubMed.
- D. Stowe, M. Bertilson and J. Hunt, Microsc. Microanal., 2017, 23, 1034–1035 CrossRef.
- R. F. Sippel, Rev. Sci. Instrum., 1965, 36, 1556–1558 CrossRef.
- D. J. Marshall and A. N. Mariano, Cathodoluminescence of geological materials, Taylor & Francis, 1988 Search PubMed.
- C. E. Barker, O. C. Kopp and H. Y. Colburn, Luminescence microscopy and spectroscopy: qualitative and quantitative applications, SEPM Society for Sedimentary, 1991 Search PubMed.
- L. Nasdala, J. Götze, J. M. Hanchar, M. Gaft, M. R. Krbetschek, A. Beran and E. Libowitzky, Spectroscopic methods in mineralogy, 2004, vol. 6, pp. 43–91 Search PubMed.
- A. Gucsik, Cathodoluminescence and its Application in the Planetary Sciences, Springer, 2009 Search PubMed.
- J. Götze, Microsc. Microanal., 2012, 18, 1270–1284 CrossRef PubMed.
- J. Götze, in Cathodoluminescence in geosciences, Springer, 2000, pp. 457–477 Search PubMed.
- N. V. Sobolev, H.-P. Schertl, R. D. Neuser and V. S. Shatsky, Int. Geol. Rev., 2007, 49, 717–731 CrossRef.
- H.-P. Schertl, R. Neuser, A. Logvinova, R. Wirth and N. Sobolev, Russ. Geol. Geophys., 2015, 56, 100–112 CrossRef.
- E. Huang, C. H. Chen, T. Huang, E. H. Lin and J. A. Xu, Am. Mineral., 2000, 85, 473–479 CrossRef CAS.
- R. Wang and B.-M. Zhang, Spectrosc. Spectr. Anal., 2010, 30, 376–381 CAS.
- Z. Ming-kai, Yunnan Geol., 2002, 21, 159–174 Search PubMed.
- L. Germinario, R. Cossio, L. Maritan, A. Borghi and C. Mazzoli, Microsc. Microanal., 2016, 22, 690–697 CrossRef CAS PubMed.
- G. Barone, P. Mazzoleni, D. Bersani and S. Raneri, Open Archaeol., 2017, 3, 194–201 Search PubMed.
- M. Manso, S. Pessanha, M. Guerra, J. Figueirinhas, J. Santos and M. Carvalho, Spectrochim. Acta, Part B, 2017, 130, 35–38 CrossRef CAS.
- P. Cardoso, T. Mateus, G. Velu, R. Singh, J. Santos, M. Carvalho, V. Lourenco, F. Lidon, F. Reboredo and M. Guerra, Spectrochim. Acta, Part B, 2018, 141, 70–79 CrossRef CAS.
- M. Pagel, V. Barbin, P. Blanc and D. Ohnenstetter, Cathodoluminescence in Geosciences, 2000 Search PubMed.
- V. Garnier, D. Ohnenstetter, G. Giuliani, P. Blanc and D. Schwarz, Mineral. Petrol., 2002, 76, 179–193 CrossRef CAS.
- H. S. Yoder, Am. J. Sci., 1950, 248, 225–248 CrossRef CAS.
- A. Miyashiro, Metamorphic petrology, CRC Press, 1994 Search PubMed.
- P. M. Bell and E. H. Roseboom Jr, Mineralogical Society of America Special Paper, 1969, vol. 2, pp. 151–169 Search PubMed.
- G. E. Harlow, J. Metamorph. Geol., 1994, 12, 49–68 CrossRef CAS.
- T. Tsujimori and G. E. Harlow, Eur. J. Mineral., 2012, 24, 371–390 CrossRef CAS.
- N. Takahashi, T. Tsujimori, M. Kayama and H. Nishido, J. Mineral. Petrol. Sci., 2017, 112, 291–299 CrossRef CAS.
- T. Kawamoto, A. Hertwig, H.-P. Schertl and W. V. Maresch, Lithos, 2018, 308–309, 227–241 CrossRef CAS.
| This journal is © The Royal Society of Chemistry 2020 |