 Open Access Article
Designing a super broadband near infrared material Mg3Y2Ge3O12:Cr3+ using cation inversion for future light sources†
Xiangyu Menga,
Xiaoshuai Zhanga,
Xueli Shia,
Keliang Qiua,
Zhijun Wang *a,
Dawei Wangb,
Jinxin Zhaob,
Xue Lia,
Zhiping Yanga and
Panlai Li
 *a
*a
aNational-Local Joint Engineering Laboratory of New Energy Photoelectric Devices, Hebei Key Laboratory of Optic-electronic Information and Materials, College of Physics Science & Technology, Hebei University, Baoding 071002, China. E-mail: wangzj1998@126.com; li_panlai@126.com
bHebei Key Laboratory of Semiconductor Lighting and Display Critical Materials, Baoding 071000, China
First published on 19th May 2020
Abstract
A series of broad emission band near infrared materials Mg3Y2Ge3O12:Cr3+ (650–1200 nm) was prepared based on cation inversion. For trivalent chromium ions (Cr3+), garnet structural components can provide conditions for the occurrence of cation inversion. With an increase in Cr3+ concentration, the Mg2+ and Ge4+ cations are inverted to ensure valence equilibrium, which was explained by recording the low temperature spectrum of the structure and carrying out structural refinement. As a result, this structure provides a new luminescent center [GeO6] for Cr3+, leading to a secondary enhancement in emission intensity. The wavelength of the main peak was found to move from 771 to 811 nm, and the full width at half maximum (FWHM) was broadened from 180 to 226 nm. The lattice occupation, luminescence mechanism and the reasons behind the red-shift and broadening of the spectra were studied in detail. By analyzing the crystallinity and particle size distributions of the samples, as well as the Cr3+ ion energy level shift, it was determined that cation inversion is an effective method that can be used to tune the luminescence performance. Meanwhile, a super broad near infrared light emitting diode (LED) with a FWHM of 260 nm was obtained by combining a GaN chip with MYG:0.40Cr3+.
1 Introduction
To date, phosphor-converted light-emitting diodes (LEDs) have played an important role in the field of luminescent applications because of their energy-saving, environmental protection, and other important characteristics.1–3 However, the application value of broad band near-infrared (NIR) light is becoming ever more important, especially in food detection, biological detection, fingerprint identification and other fields.4–6 Therefore, research on NIR LEDs has attracted increasingly more attention. The most widely used method for producing NIR LED devices is to combine a NIR phosphor and GaN blue LED chip.7,8NIR phosphors have been studied extensively. For example, Kolesnikov et al. reported NIR phosphors with YVO4 as a matrix and Nd3+ as an activator. YVO4:Nd3+ exhibits two emission bands at around 808 and 880 nm when excited by light at 532 nm. Since these bands are thermally coupled over a wide temperature range, YVO4:Nd3+ can be used as a ratiometric luminescence thermal sensor. Singh et al. reported that ZnMgAl10O17:Er3+ emits NIR light in the ranging of 1450–1650 nm.9 At the same time, the introduction of Yb3+ ions was shown to improve the luminescence intensity of Er3+ by energy transfer, which does not affect the occupation of Er3+. Since the luminescence of rare earth ions originates from transitions within the 4f energy level, the emission of the ions is hardly affected by the change in the surrounding crystal field environment, due to the shielding effect of the 5s and 5p electron layers. Transition metal ions are a good choice as NIR activators because their emission spectra can be well adjusted by changing the crystal field environment. For example, the novel NIR luminescent material Li2ZnGe3O8:Mn2+ was prepared by our research group, with an emission spectrum ranging from 650 to 900 nm.10 However, the emission of Mn2+ ions is closer to the red light region, such as for Ca9−x−y−zMgxSryBazCe(PO4)7:Eu2+, Mn2+,11 and MgGeO3:Mn2+.12 The Cr3+ ion is also an excellent NIR activator, which shows different luminescence properties in different crystal field environments. For example, in a strong crystal field environment, the emission of Cr3+ originates from the spin forbidden transition 2E(2G) → 4A2(4F), it displays a sharp band spectrum (the peak is near 700 nm) and is slightly affected by the change in crystal field strength, according to its Tanabe–Sugano (3d3) diagram. Deng et al. prepared LiGa5O8:Cr3+ with enhanced persistent luminescence that has a narrow peak located at 700 nm.13 Cr3+ and Sn4+ ions prefer to occupy octahedral sites. At the same time, the introduction of Sn4+ can effectively improve afterglow performance. In a weak crystal field, the emission of Cr3+ originates from the spin-allowed transition 4T2 → 4A2, showing a broadband emission (probably in the range of 600–1000 nm) that is easily affected by the change in the crystal field environment.14,15 For example, the NIR phosphor Ca2MgWO6:Cr3+ was prepared by Meng et al., which exhibited a broadband peak at 803 nm when excited at 371 nm.16 In Ca2MgWO6, Cr3+ ions substitute Mg2+ sites and are located in a weak crystal field. Shao et al. reported the NIR material ScBO3:Cr3+ and obtained a NIR LED.8 In the host, the Cr3+ ions occupied the Sc3+ sites with relatively low crystal field strength and showed a broadband emission peak at 800 nm.
A garnet has a cubic structure with Ia![[3 with combining macron]](https://www.rsc.org/images/entities/char_0033_0304.gif) d symmetry, which can be described in terms of a 160 atom body-centered cubic unit cell.17 Its chemical formula is generally A3B2C3O12, in which the atoms A, B, and C occupy the lattice sites 24c, 16a, and 24d, respectively.18,19 The coordination numbers of atoms A, B and C are 8, 6, 4, respectively, and each tetrahedron is connected to four octahedra, providing multiple sites for active ions to occupy.20 Since the 1970s, Cr3+-doped garnet phosphors have been one of the most famous types of NIR phosphors, for example, YAG:Cr3+, which is a typical NIR material.21 In addition, Kiss and Duncan further studied the non-radiative energy transfer from Cr3+ to Nd3+ in YAG.22,23 Another characteristic of garnets is the cationic inversion that occurs between the tetrahedra and octahedra, which can be used to improve the luminescence performance of an activator, such as improving luminescence efficiency, broadening excitation or emission spectra.24–26 In order to improve the probability of wide-spectrum NIR emission, an inverse-garnet structure can be used as a host material. In a normal garnet, all three polyhedra are regular polyhedra. In order to increase the probability of wide-spectrum emission, the inverse-garnet structure is a good choice because its polyhedra are distorted. Therefore, in this work, Mg3Y2Ge3O12 with an inverse-garnet structure was chosen as the matrix and Cr3+ ions were selected as an activator to achieve broadband NIR emission. A series of NIR materials were prepared that can cover from 700 to 1200 nm. The full width at half maxima (FWHM) reached 226 nm and the emission intensity was enhanced due to cationic inversion. A NIR LED was prepared by combining MYG:0.40Cr3+ with a GaN chip.
d symmetry, which can be described in terms of a 160 atom body-centered cubic unit cell.17 Its chemical formula is generally A3B2C3O12, in which the atoms A, B, and C occupy the lattice sites 24c, 16a, and 24d, respectively.18,19 The coordination numbers of atoms A, B and C are 8, 6, 4, respectively, and each tetrahedron is connected to four octahedra, providing multiple sites for active ions to occupy.20 Since the 1970s, Cr3+-doped garnet phosphors have been one of the most famous types of NIR phosphors, for example, YAG:Cr3+, which is a typical NIR material.21 In addition, Kiss and Duncan further studied the non-radiative energy transfer from Cr3+ to Nd3+ in YAG.22,23 Another characteristic of garnets is the cationic inversion that occurs between the tetrahedra and octahedra, which can be used to improve the luminescence performance of an activator, such as improving luminescence efficiency, broadening excitation or emission spectra.24–26 In order to improve the probability of wide-spectrum NIR emission, an inverse-garnet structure can be used as a host material. In a normal garnet, all three polyhedra are regular polyhedra. In order to increase the probability of wide-spectrum emission, the inverse-garnet structure is a good choice because its polyhedra are distorted. Therefore, in this work, Mg3Y2Ge3O12 with an inverse-garnet structure was chosen as the matrix and Cr3+ ions were selected as an activator to achieve broadband NIR emission. A series of NIR materials were prepared that can cover from 700 to 1200 nm. The full width at half maxima (FWHM) reached 226 nm and the emission intensity was enhanced due to cationic inversion. A NIR LED was prepared by combining MYG:0.40Cr3+ with a GaN chip.
2 Experimental
2.1 Materials and synthesis
A series of Mg3Y2Ge3O12:xCr3+ materials were synthesized via a high-temperature solid-state method using MgO (99.99%), Y2O3 (99.99%), GeO2 (99.99%) and Cr2O3 (99.99%) as raw materials. The raw materials were weighed using electronic scales with a 0.0001 g accuracy. Then, the raw materials were thoroughly mixed and ground in an agate mortar for 30 min. The mixed materials were transferred into alumina crucibles and sintered at 1350 °C for 6 h in a high temperature furnace. Finally, the synthesized samples were cooled to room temperature and ground to a powder. The chemical reaction formula is as follows:| 3MgO + (1 − x/2) Y2O3 + 3GeO2 + x/2Cr2O3 → Mg3Y2−xGe3O12:xCr3+ |
2.2 Characterization
The phase structures of the as-prepared samples were analyzed using X-ray diffraction (XRD), which was carefully performed using a D8A25 Focus diffractometer (Bruker) measuring at 40 kV and 40 mA and recording patterns in the range of 2θ = 10–80° at a scan rate of 0.05° per second, with a step size of 0.01°. The steady-state photoluminescence spectra of the phosphors were measured using an FL3 (Edinburgh Instruments) fluorescence spectrometer. Furthermore, diffuse reflection spectra of the phosphors were measured using a Hitachi U-4100 machine with a scanning wavelength range of 200–800 nm. The thermoluminescence spectra of the samples were recorded using a FJ-427A1 TL dosimeter with a fixed heating rate of 1 °C s−1 within the range of 25–300 °C. Low temperature photoluminescence (PL) spectra were measured from 10–300 K by a spectrometer equipped with a CCS-150 JANIS temperature control device. An electron paramagnetic resonance (EPR) spectrum was measured using a JES FA300 spectrometer, which can detect that the minimum absolute rotation number is less than 1 × 10⁹ spins per G.3 Results and discussion
3.1 Phase characterization and crystal analysis
Fig. 1 shows the crystal structure of Mg3Y2Ge3O12 (MYG), which is cubic and in the space group Ia![[3 with combining macron]](https://www.rsc.org/images/entities/char_0033_0304.gif) d. The cell features three types of polyhedra, a [GeO4] tetrahedron, a [Mg2O6] octahedron and a twisted [Mg1/Y1O8] dodecahedron, making it an inverse garnet structure. The views of the [111] and [010] directions are shown in Fig. 1(a). In Fig. 1(b), the XRD sample data (MYG, MYG:0.03Cr3+ and MYG:0.30Cr3+) are compared with the standard card of MYG (ICSD #280049). There are no impurity peaks that can be observed and the XRD patterns match well, which indicates that all of the samples are pure. With an increase in Cr3+ concentration, there is no shifting of the peaks, thus the doping of Cr3+ does not change the crystal structure. The X-ray photoelectron (XPS) spectrum of MYG:0.03Cr3+ in Fig. S1† shows that the valence state of Cr did not change. In addition, the Rietveld refinement of MYG was carried out using a general structure analysis system (GSAS) with the initial structure model of Mg3Y2Ge3O12 (ICSD #280049) crystallized in a cubic system, which is shown in Fig. 1(c). The values of the refinement parameters, χ2 (=1.428), Rwp (=11.58%), and Rp (=8.59%), are satisfactory, which also suggests that MYG was well synthesized. The other results of the refinement are presented in Table S1.†
d. The cell features three types of polyhedra, a [GeO4] tetrahedron, a [Mg2O6] octahedron and a twisted [Mg1/Y1O8] dodecahedron, making it an inverse garnet structure. The views of the [111] and [010] directions are shown in Fig. 1(a). In Fig. 1(b), the XRD sample data (MYG, MYG:0.03Cr3+ and MYG:0.30Cr3+) are compared with the standard card of MYG (ICSD #280049). There are no impurity peaks that can be observed and the XRD patterns match well, which indicates that all of the samples are pure. With an increase in Cr3+ concentration, there is no shifting of the peaks, thus the doping of Cr3+ does not change the crystal structure. The X-ray photoelectron (XPS) spectrum of MYG:0.03Cr3+ in Fig. S1† shows that the valence state of Cr did not change. In addition, the Rietveld refinement of MYG was carried out using a general structure analysis system (GSAS) with the initial structure model of Mg3Y2Ge3O12 (ICSD #280049) crystallized in a cubic system, which is shown in Fig. 1(c). The values of the refinement parameters, χ2 (=1.428), Rwp (=11.58%), and Rp (=8.59%), are satisfactory, which also suggests that MYG was well synthesized. The other results of the refinement are presented in Table S1.†
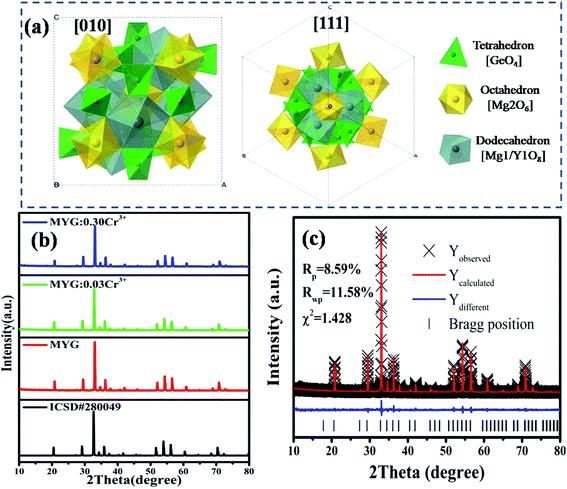 | ||
| Fig. 1 (a) Crystal structure of Mg3Y2Ge3O12; (b) XRD patterns of MYG:xCr3+ (x = 0, 0.03, 0.30) and the standard Mg3Y2Ge3O12 (ICSD #280049) crystal data; (c) X-ray Rietveld refinements for MYG. | ||
The EPR spectrum of MYG was measured to elucidate its structural characteristics at room temperature, as shown in Fig. 2(a). The EPR spectrum exhibits an intense resonance signal centered at g ∼ 2.00, which indicates that there are typical oxygen vacancies in the host.27,28 Generally, an oxygen vacancy can capture one electron, forming a sequential resonance source with S = 1/2, which results in the appearance of a stable EPR signal at around g ∼ 2.00. That is to say, the oxygen vacancies are formed in the process of MYG crystal growth. Furthermore, the thermoluminescence (TL) glow curve of MYG was measured in the range of 300–600 K after 10 minutes of ultraviolet lamp irradiation (254 nm), as shown in Fig. 2(b). There is a peak located at 395 K in the spectrum, which can be attributed to oxygen vacancies. For the host, the trap depth (E) can be obtained using the peak shape method, as shown in the following equation:29,30
| ω = δ + τ | (1) |
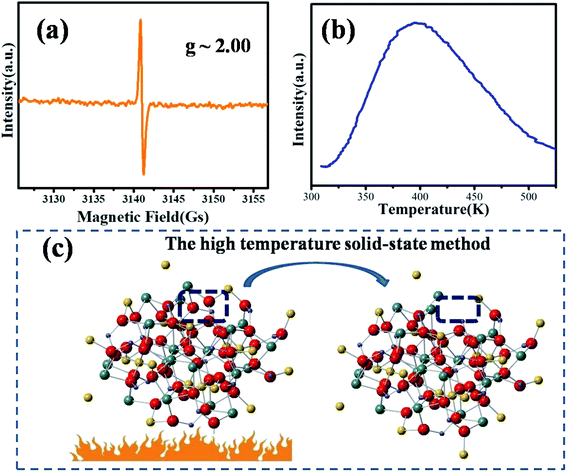 | ||
| Fig. 2 (a) EPR spectrum of MYG at room temperature; (b) TL spectra of MYG; (c) the process of the generation of oxygen defects. | ||
3.2 Properties of low concentration doping MYG:xCr3+(x = 0.005–0.07)
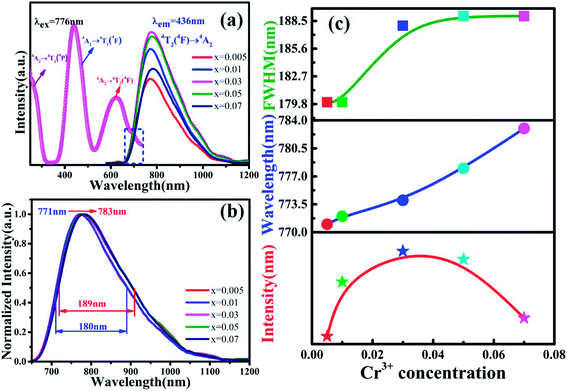
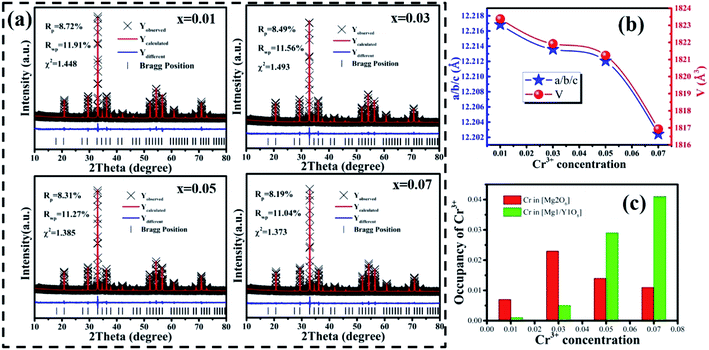
Fig. 3(a) shows the photoluminescence excitation (PLE) spectrum of MYG:0.03Cr3+ and the photoluminescence spectra (PL) of MYG:xCr3+ (x = 0.005, 0.01, 0.03, 0.05, 0.07). The PLE spectrum features three peaks ranging from 250 to 750 nm, which are at 250 nm (4A2 → 4T1(4P)), 436 nm (4A2 → 4T1(4F)) and 624 nm (4A2 → 4T2(4F)).31,32 The phosphors can be excited best under 436 nm irradiation. At the same time, the emission of the GaN chips at 455 nm can also be well absorbed, the absorption intensity at which is about 92% of that at 436 nm, which indicates that the MYG:xCr3+ samples are promising phosphors. The emission spectra ranging from 650 to 1200 nm were obtained under 436 nm irradiation, which originates from the spin-allowed transition 4T2 → 4A2 of Cr3+.33,34 To better observe the changes in the emission spectra with an increase in Cr3+ concentration, the normalization diagram is shown in Fig. 3(b). It can be obviously seen that the emission spectra red-shift and that the FWHM broadens, with more detailed spectral change data given in Fig. 3(c). The peak shifts from 771 to 783 nm with increasing Cr3+ concentration. At the same time, the FWHM of Cr3+ emission is broadened from 180 to 189 nm. When the concentration of Cr3+ is up to 0.03, the emission intensity decreases gradually because of concentration quenching.Generally, the broadband emission of Cr3+ is generated in intermediate or weak crystal field environments. The order of crystal field strength is tetrahedral > octahedral > dodecahedral, therefore, it is hard for Cr3+ to enter into a tetrahedral lattice with its strong crystal field, but it tends to enter octahedral [Mg2O6] and dodecahedral [Mg1/Y1O8] lattices.5,35 To gain further knowledge about the occupation of Cr3+ in MYG and structural information on MYG:xCr3+, the XRD Rietveld refinements of MYG:xCr3+ (x = 0.01, 0.03, 0.05, 0.07) were carried out using the GSAS program, the results of which are shown in Fig. 4(a). A model of MYG (ICSD #280049) was used as the initial structure to refine the samples in the 2θ range of 10–80°. The parameters of the refinement results (Rp, Rwp and χ2) were found to be in line with the standard, which indicates that the Rietveld refinement results are reliable. The atomic positions are shown in Table S2.†
The cell parameters a, b and c, as well as the cell volume, V, of the samples are shown in Fig. 4(b). The values of a, b, c and V gradually decrease, which can be attributed to the radius of Cr3+ (0.0615 nm) being smaller than those of Mg2+ (0.072 nm) and Y3+ (0.1019 nm). In Fig. 4(c), the occupying information of the Cr3+ ions at different Cr3+ concentrations is shown. It can be seen that the Cr3+ ions are only doped into the [Mg2O6] site and [Mg1/Y1O8] site, as we expected. Therefore, there are three luminance centers of Cr3+, which was also proven by the low temperature spectrum of MYG:0.03Cr3+ shown in Fig. S2.† Fig. 5(a) shows the PL spectrum of MYG:0.03Cr3+, which was divided into three sub-peaks with peaks at 748 nm (peak 1), 806 nm (peak 2) and 899 nm (peak 3) using a Gaussian multiple peak fitting technique. At the same time, the corresponding excitation spectra of MYG:0.03Cr3+, monitoring the three sub-peaks, were measured and are shown in Fig. S3.† Taking the energy of the 4A2 state to be equal to zero, the value of the crystal field strength, Dq, and the Racah parameter, B, can be calculated using the following eqn (2) and (3):36–38
| E(4T2) = 10Dq |
 | (2) |
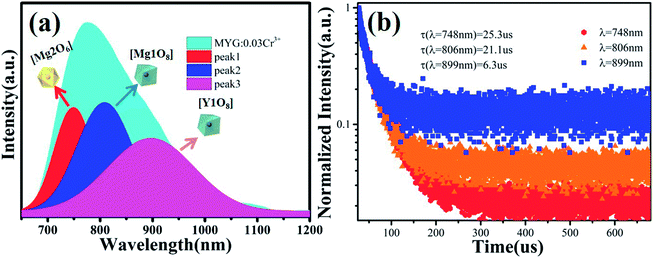 | ||
| Fig. 5 (a) The PL and the three sub-peaks of MYG:0.03Cr3+; (b) fluorescence decay curves of Cr3+ emission in MYG:xCr3+ phosphors monitored at 748, 806 and 899 nm. | ||
The relative energy between the 4T1(4F) and 4T2(4F) levels is represented by the symbol ΔE. Therefore, the Racah parameter, B, can be calculated by simplifying eqn (2), in the following way:
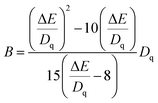 | (3) |
According to eqn (2) and (3), the values of Dq and Dq/B are 1594, 1574, 1557 and 2.38, 2.24, 2.13, indicating that the three sub-peaks arise from different luminescence centers. The value of Dq is inversely proportional to R5.39 Therefore, the bond lengths corresponding to peaks 1, 2 and 3 increase gradually. The average bond lengths of Mg2–O and Mg1/Y1–O are 2.065 and 2.390 Å, respectively. Because the radius of Mg1 (0.089 nm) is smaller than that of Y1 (0.1019 nm), the average bond length of Y1–O is longer than that of Mg1–O. The emission peaks of CrMg2, CrMg1 and CrY1 correspond to peaks 1, 2 and 3, respectively. Fig. 5(b) shows the fluorescence decay curves of Cr3+ emission in the MYG:xCr3+ phosphors monitored at 748, 806 and 899 nm, which were fitted using a double exponential equation:40
I(t) = I0 + A1![[thin space (1/6-em)]](https://www.rsc.org/images/entities/char_2009.gif) e−t/τ1 + A2 e−t/τ1 + A2![[thin space (1/6-em)]](https://www.rsc.org/images/entities/char_2009.gif) e−t/τ2 e−t/τ2
| (4) |
| τ* = (A1τ12 + A2τ22) | (5) |
The lifetimes of the peaks located at 748, 806 and 899 nm are 25.3, 21.1 and 6.3 μs, respectively. Besides this, according to Fig. 4(c), with an increase in the Cr3+ concentration, the Cr3+ content in [Mg1/Y1O8] (CrMg1/Y1) increases, but first increases and then decreases in [Mg2O6] (CrMg2), which is the same change trend as for the emission intensity, as shown in Fig. 3(c). It can be inferred that in the range of 0 < x < 0.1, the luminous intensity of Cr3+ in [Mg2O6] determines the overall luminous intensity.
Because there are defects in the host, as seen from Fig. 2(b), the effect of defects on the luminescence intensity should be considered. Therefore, the TL spectra of the samples were measured and are shown in Fig. S4.† However, the TL peak was observed to gradually disappear, which can be attributed to the unequal substitution of Cr3+. The substitution process of Cr3+ in the host can be represented by the two equations:
 | (6) |
| Cr3+ → Y3+ + CrY | (7) |
When Mg2+ is substituted by Cr3+, a Mg2+  cation vacancy occurs due to different valence states. However, when Y3+ is substituted by Cr3+, there are no cation vacancies. Because of the existence of oxygen vacancies,
  in MYG, the
  make up for the
  defects with an increase in the Cr3+ concentration, which results in the disappearance of the TL peak. In addition, the refined data shown Fig. 4(a) also indicate that the crystallinity improves.
The reflection spectra of MYG:xCr3+ (x = 0.01, 0.03, 0.05, 0.07) were measured and are shown in Fig. 6(b). The two absorption peaks arising from the 4T1(4F) and 4T2(4F) levels shift to a shorter wavelength with an increase in Cr3+ concentration. Using eqn (2) and (3), the values of Dq, B and Dq/B were obtained and are displayed in Table 1. It can be seen from Table 1 that the Dq/B values decrease with an increase in Cr3+ concentration. Together with the Tanabe–Sugano (3d3) diagram shown in Fig. 6(a), the energy difference between the energy levels 4T2 and 4A2 decreases as the value of Dq/B decreases, which leads to a red-shift in the emission spectra.
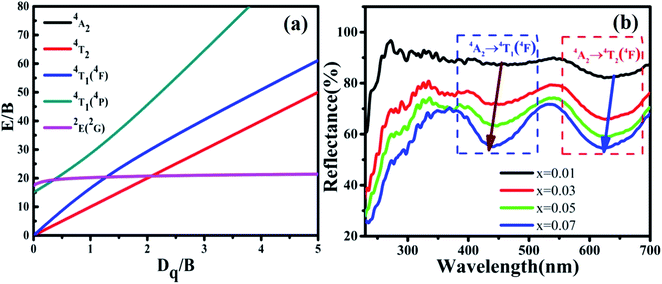 | ||
| Fig. 6 (a) Tanabe–Sugano (3d3) diagram; (b) reflection spectra of MYG:xCr3+ (x = 0.01, 0.03, 0.05, 0.07). | ||
| MYG:xCr3+ | Dq | B | Dq/B |
|---|---|---|---|
| x = 0.01 | 1587.30 | 648.25 | 2.45 |
| x = 0.03 | 1589.83 | 651.24 | 2.44 |
| x = 0.05 | 1594.90 | 671.25 | 2.38 |
| x = 0.07 | 1600.00 | 677.59 | 2.36 |
The spectral broadening is related to the degree of energy splitting. An enhancement in the energy level splitting leads to spectral broadening, whereas in contrast, a reduction in the energy level splitting leads to spectral narrowing. The splitting degree of the energy level is positively correlated with the crystal field strength, Dq. According to Table 1, the value of Dq increases with an increase in the Cr3+ concentration, which leads to an enhanced splitting of the 4T2 energy level and spectral broadening.
3.3 Properties of high concentration doping in MYG:xCr3+(x = 0.1–0.4)
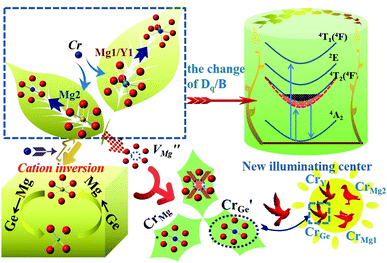
It is well known that energy transfer leads to energy loss, hence we tried three other possible ways to improve the luminous properties of Cr3+. First, for a garnet structure, the inversion of cation sites may occur, which will result in the formation of new lattices to improve the luminescence properties.35 The second is to construct appropriate defects, which can increase the channel of energy acquisition of the Cr3+ ion.41–43 Third, the upper level 4T2 can obtain more electrons via overlapping of the energy levels 4T2 and 2E.44 The 2E level can act as the energy storage level, when the energy levels overlap, the energy transfer from the 2E to 4T2 level occurs. However, through the above analysis, the 4T2 energy level gradually moves down and the defects disappear with an increase in Cr3+ concentration. Thus, the first way is a good choice. Because the selection of host components needs to consider the valence relationship between Cr3+ and the cationic states in the host, Cr3+ not only acts as an activator, but also regulates the composition of the host, which can avoid the introduction of new ions to destroy the structure. We speculate that the structure of the inverse garnet is further disordered due to an increase in the concentration of exogenous ions, resulting in a new arrangement of cations, the process of which is shown in Fig. 7. The cation inversion between a tetrahedron and octahedron occurs and the occupancy of Cr3+ in the octahedron is in agreement with the following equation:
 | (8) |
At the same time, a new luminescence center,  is formed, which enhances the emission intensity and broadens the emission spectra. As the concentration of Cr3+ continues to increase, the value of Dq/B continues to decrease, resulting in the continued red shift of the spectrum. Therefore, it is necessary to further increase the concentration of Cr3+ ions to obtain NIR emission materials with a wider FWHM that are closer to long wave.
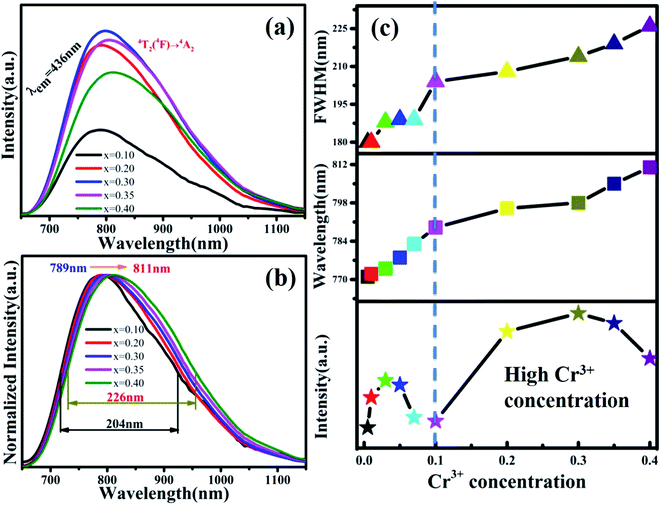
The PL spectra of MYG:xCr3+(x = 0.1, 0.2, 0.3, 0.35, 0.4) are shown in Fig. 8(a). The emission intensities of the samples are enhanced again, the spectra keep red shifting, and the FWHM continues to broaden. In order to show the spectral changes more clearly, the normalized spectra and the PL spectral change curves are shown in Fig. 8(b) and (c), respectively. It is obvious that the emission wavelength moves from 789 to 811 nm, and the FWHM extends 204 nm to 226 nm. The emission intensity first increases and then decreases, and the intensity is strongest at x = 0.30, which is about 1.5 times the emission intensity exhibited by MYG:0.03Cr3+. According to the experimental design, with an increase in the Cr3+ ion concentration, a new luminescence center CrGe should arise. The low temperature spectrum of MYG:0.30Cr3+ at 10 K was measured and is shown in Fig. S5.†
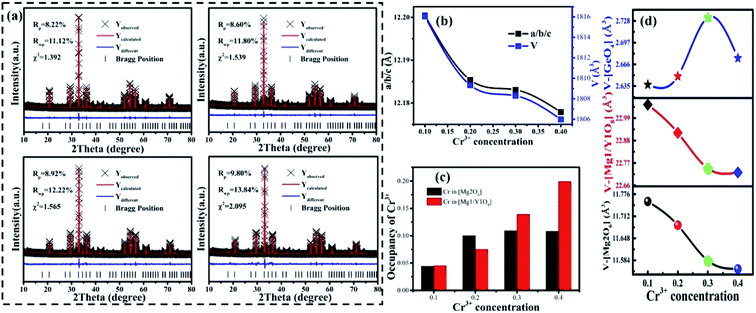
It can be seen that a new peak (peak 4) appears, which means that a new luminescence center is formed with an increase in Cr3+ concentration. The formation of the new luminescence center is due to Ge4+, with a smaller radius, entering the octahedron, i.e., cation inversion. In order to explore the change in sample properties in more detail, the XRD data of the samples were refined and the results are shown in Fig. 9(a). The refinement parameters (Rp, Rwp and χ2) all meet the requirements. The atomic positions are shown in Table S3.†
The important parameters of the refinement results are shown in Fig. 9(b)–(d), such as a/b/c, V, the occupancy of Cr3+ and the volume changes of the tetrahedron (V-[GeO4]), octahedron (V-[Mg2O6]), and dodecahedron (V-[Mg1/Y1O8]). From Fig. 9(b), it can be seen that the cell parameters (a/b/c and V) decrease, as observed in the samples with low Cr3+concentration. According to Fig. 9(c), the Cr3+ ions still substitute for the [Mg2O6] and [Mg1/Y1O8] sites. However, the concentration of CrMg2 increases despite a slight decrease at x > 0.3, which is important for enhancing the luminescence intensity. The increase in CrMg2 indicates that a new luminescence center arises in [Mg2O6], corresponding to peak 4 shown in Fig. S5.†
The source of the new luminescence center can be well observed by analyzing the polyhedral volume in the host shown in Fig. 9(d). Since the Cr3+ is in the positions of [Mg2O6] and [Mg1/Y1O8], and the radius of Cr3+ (0.0615 nm) is less than those of Mg2+ (0.072 nm, N = 6), (0.089 nm, N = 8) and Y3+ (0.1019 nm, N = 8), V-[Mg2O6] and V-[Mg1/Y1O8] will be decreased. As for [GeO4], there are two reasons for the change in volume. One reason is that the [GeO4] volume increases due to the tugging action of [Mg1/Y1O8] and [Mg2O6]. Another reason is the occurrence of cation inversion between Mg2 (0.057 nm, N = 4), (0.072 nm, N = 6) and Ge (0.039 nm, N = 4), (0.053 nm, N = 6). When x > 0.30, due to the decrease in the degree of cation inversion, the volume of [GeO4] decreases. Therefore, it can be inferred that with an increase in Cr3+ concentration (x < 0.30), the degree of cation inversion increases, which leads to an increase in the concentration of Cr3+ in the octahedron, which enhances the emission intensity. However, when x > 0.30, the degree of cation inversion begins to decrease and the emission intensity decreases.
In addition, the reflection spectra of MYG:xCr3+ (x = 0.10, 0.20, 0.30, 0.40) were measured and are shown in Fig. 10(a). Using eqn (2) and (3), the values of Dq, B and Dq/B were calculated and the results are shown in Fig. 10(b), where it can be seen that the value of Dq/B gradually decreases. Therefore, together with the information shown in Fig. 6(a), it was determined that the 4T2 level is close to the 4A2 level, which causes a red shift in the spectrum. The value of Dq gradually increases, which leads to spectral broadening. With an increase in Cr3+ concentration, the change in the crystal field environment is in line with the experimental design and requirements.
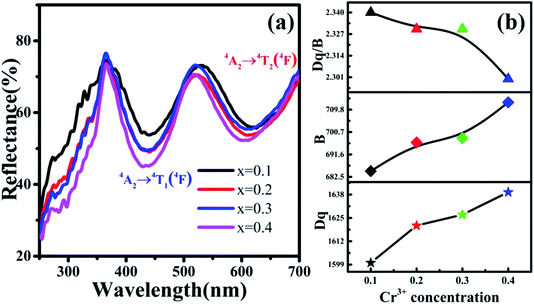 | ||
| Fig. 10 (a) Reflection spectra of MYG:xCr3+ (x = 0.10, 0.20, 0.30, 0.40); (b) the curves of the changes in Dq, B and Dq/B. | ||
3.4 Preparation and performance tests on a NIR LED
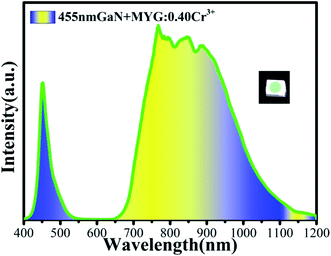
In order to realize its practical application, a NIR LED was prepared by combining MYG:0.40Cr3+ and a GaN blue chip (455 nm). The emission spectrum of the LED was measured under 3 V voltage and 30 mA current, which is shown in Fig. 11. It can be seen that the broad emission band ranges from 650 to 1200 nm, and the FWHM is 260 nm. The photoelectric efficiency and optical power are about 6.6% and 5.9 mW, respectively.4 Conclusions
Broadband NIR Mg3Y2Ge3O12:Cr3+ materials were obtained using a high-temperature solid-state method. With an increase in Cr3+ concentration, the emission peak of the materials shift from 771 to 811 nm and the FWHM is broadened from 180 to 226 nm, which can be attributed to the change in the crystal field strength, Dq and Dq/B. when x > 0.1, cation inversion between Mg2 and Ge occurs to ensure valence equilibrium, which results in the generation of a new luminescence center (CrGe). The formation of cation inversion leads to an increase in Cr3+ concentration in the octahedra and also results in an increase in emission intensity. A super broadband (260 nm) NIR LED was obtained by combining a GaN chip with MYG:0.40Cr3+. This work provides a useful method for achieving a Cr3+-doped gallate composition.Conflicts of interest
The authors declare no competing financial interest.Acknowledgements
The work was supported by the National Natural Science Foundation of China (No. 51672066, 51902080), the Funds for Distinguished Young Scientists of Hebei Province, China (No. A2018201101), the Natural Science Foundation of Hebei Province, China (No. E2019201223), and the personnel training project of Hebei Province, China (No. A201902005).References
- W. B. Dai, S. Ye, E. L. Li, P. Z. Zhuo and Q. Y. Zhang, High quality LED lamps using color-tunable Ce3+-activated yellow-green oxyfluoride solid-solution and Eu3+-doped red borate phosphors, J. Mater. Chem. C, 2015, 3(31), 8132–8141 RSC.
- E. F. Schubert and J. K. Kim, Solid-state light sources getting smart, Science, 2005, 308(5726), 1274–1278 CrossRef CAS PubMed.
- Z. Xia, Z. Xu, M. Chen and Q. Liu, Recent developments in the new inorganic solid-state LED phosphors, Dalton Trans., 2016, 45(28), 11214–11232 RSC.
- I. O. Afara, I. Prasadam, Z. Arabshahi, Y. Xiao and A. Oloyede, Monitoring osteoarthritis progression using near infrared (NIR) spectroscopy, Sci. Rep., 2017, 7(1), 11463 CrossRef PubMed.
- L. Zhang, S. Zhang and Z. Hao, et al., A high efficiency broad-band near-infrared Ca2LuZr2Al3O12: Cr3+ garnet phosphor for blue LED chips, J. Mater. Chem. C, 2018, 6(18), 4967–4976 RSC.
- M. Ye, Z. Gao, Z. Li, Y. Yuan and T. Yue, Rapid detection of volatile compounds in apple wines using FT-NIR spectroscopy, Food Chem., 2016, 190, 701–708 CrossRef CAS PubMed.
- D. Hayashi, A. M. van Dongen, J. Boerekamp, S. Spoor, G. Lucassen and J. Schleipen, A broadband LED source in visible to short-wave-infrared wavelengths for spectral tumor diagnostics, Appl. Phys. Lett., 2017, 110(23), 233701 CrossRef.
- Q. Shao, H. Ding, L. Yao, J. Xu, C. Liang and J. Jiang, Photoluminescence properties of a ScBO3: Cr3+ phosphor and its applications for broadband near-infrared LEDs, RSC Adv., 2018, 8(22), 12035–12042 RSC.
- V. Singh, M. Seshadri, N. Singh, P. K. Singh, M. K. Tiwari and M. Irfan, Investigation of near-infrared luminescence in Er3+ and Er3+/Yb3+ co-doped ZnMgAl10O17 phosphors, Optik, 2018, 158, 1283–1288 CrossRef CAS.
- J. Cheng, P. Li and Z. Wang, et al., Synthesis, structure and luminescence properties of novel NIR luminescent materials Li2ZnGe3O8: x Mn2+, J. Mater. Chem. C, 2017, 5(1), 127–133 RSC.
- C. Wang, Z. Wang and P. Li, et al., Relationships between luminescence properties and polyhedron distortion in Ca9−x−y−zMgxSryBazCe(PO4)7: Eu2+, Mn2+, J. Mater. Chem. C, 2017, 5(41), 10839–10846 RSC.
- Y. Katayama, T. Kayumi, J. Ueda, P. Dorenbos, B. Viana and S. Tanabe, The role of Ln3+(Ln= Eu, Yb) in persistent red luminescence in MgGeO3: Mn2+, J. Mater. Chem. C, 2017, 5(34), 8893–8900 RSC.
- W. Huang, X. Gong and R. Cui, et al., Enhanced persistent luminescence of LiGa5O8: Cr3+ near-infrared phosphors by codoping Sn4+, J. Mater. Sci. Mater. Electron., 2018, 29(12), 10535–10541 CrossRef CAS.
- Q. Bai, S. Zhao, L. Guan, Z. Wang, P. Li and Z. Xu, Design and control of the luminescence of Cr3+-doped phosphors in the near-infrared I region by fitting the crystal field, Cryst. Growth Des., 2018, 18(5), 3178–3186 CrossRef CAS.
- X. Wu, D. Xu, W. Li, T. Wang, L. Cao and J. Meng, Synthesis and luminescence of novel near-infrared emitting BaZrSi3O9: Cr3+ phosphors, Luminescence, 2017, 32(8), 1554–1560 CrossRef CAS PubMed.
- D. Xu, X. Wu and Q. Zhang, et al., Fluorescence property of novel near-infrared phosphor Ca2MgWO6:Cr3+, J. Alloys Compd., 2018, 731, 156–161 CrossRef CAS.
- Z. Xia and A. Meijerink, Ce3+-Doped garnet phosphors: composition modification, luminescence properties and applications, Chem. Soc. Rev., 2017, 46(1), 275–299 RSC.
- J. Song, K. Song and J. Wei, et al., Ionic occupation, structures, and microwave dielectric properties of Y3MgAl3SiO12 garnet-type ceramics, J. Am. Ceram. Soc., 2018, 101(1), 244–251 CrossRef CAS.
- H. Ji, L. Wang and M. S. Molokeev, et al., New garnet structure phosphors, Lu3−xYxMgAl3SiO12: Ce3+(x= 0–3), developed by solid solution design, J. Mater. Chem. C, 2016, 4(12), 2359–2366 RSC.
- Y.-N. Xu, W. Y. Ching and B. K. Brickeen, Electronic structure and bonding in garnet crystals Gd3Sc2Ga3O12, Gd3Sc2Al3O12, and Gd3Ga3O12 compared to Y3Al3O12, Phys. Rev. B, 2000, 61(3), 1817 CrossRef CAS.
- J. P. Hehir, M. O. Henry, J. P. Larkin and G. F. Imbusch, Nature of the luminescence from YAG: Cr3+, J. Phys. C: Solid State Phys., 1974, 7(12), 2241 CrossRef CAS.
- M. J. Taylor, An experimental study of the efficiency of optical energy transfer between Cr3+ and Nd3+ ions in yttrium aluminium garnet, Proc. Phys. Soc., 1967, 90(2), 487 CrossRef CAS.
- Z. J. Kiss and R. C. Duncan, Cross-Pumped Cr3+− Nd3+: YAG Laser System, Appl. Phys. Lett., 1964, 5(10), 200–202 CrossRef CAS.
- Y. Zorenko, A. Voloshinovskii, I. Konstankevych, V. Kolobanov, V. Mikhailin and D. Spassky, Luminescence of excitons and antisite defects in the phosphors based on garnet compounds, Radiat. Meas., 2004, 38(4–6), 677–680 CrossRef CAS.
- Y. Zorenko, Luminescence of isoelectronic impurities and antisite defects in garnets, Phys. Status Solidi C, 2005, 2(1), 375–379 CrossRef CAS.
- M. Nikl, J. Pejchal and E. Mihokova, et al., Antisite defect-free Lu3(GaxAl1−x)5O12: Pr scintillator, Appl. Phys. Lett., 2006, 88(14), 141916 CrossRef.
- J. Ni, Q. Liu and J. Wan, et al., Novel luminescent properties and thermal stability of non-rare-earth Ca-α-sialon: Mn2+ phosphor, J. Lumin., 2018, 202, 514–522 CrossRef CAS.
- E. Cui, Q. Meng and C. Ge, et al., The roles of surface oxygen vacancy over Mg4Ta2O9-x photocatalyst in enhancing visible-light photocatalytic hydrogen evolution performance, Catal. Commun., 2018, 103, 29–33 CrossRef CAS.
- W. Chen, Y. Wang, W. Zeng, G. Li and H. Guo, Enhancement of yellow persistent luminescence in Eu2+-doped β-Ba3P4O13 phosphor by Ga3+ codoping, RSC Adv., 2016, 6(54), 48411–48414 RSC.
- Z. Liu, Y. Ding, C. Z. Y. Meng, J. Tang and Q. Qiu, An efficient UV converted blue-emitting Lu2CaGeO6: Bi3+ persistent phosphor for potential application in photocatalysis, Ceram. Int., 2018, 44(12), 14712–14716 CrossRef CAS.
- Y. Zhang, R. Huang and Z. Lin, et al., Co-dopant influence on near-infrared luminescence properties of Zn2SnO4: Cr3+, Eu3+ ceramic discs, J. Alloys Compd., 2016, 686, 407–412 CrossRef CAS.
- Y. Zhang, R. Huang and H. Li, et al., Germanium substitution endowing Cr3+-doped zinc aluminate phosphors with bright and super-long near-infrared persistent luminescence, Acta Mater., 2018, 155, 214–221 CrossRef CAS.
- F. Shen, C. Deng, X. Wang and C. Zhang, Effect of Cr on long-persistent luminescence of near-infrared phosphor Zn3Ga2Ge2O10: Cr3+, Mater. Lett., 2016, 178, 185–189 CrossRef CAS.
- Y. Zhuang, J. Ueda and S. Tanabe, Tunable trap depth in Zn(Ga1−xAlx)2O4: Cr, Bi red persistent phosphors: considerations of high-temperature persistent luminescence and photostimulated persistent luminescence, J. Mater. Chem. C, 2013, 1(47), 7849–7855 RSC.
- H. Lin, G. Bai, T. Yu, M. Tsang, Q. Zhang and J. Hao, Site Occupancy and Near-Infrared Luminescence in Ca3Ga2Ge3O12: Cr3+ Persistent Phosphor, Adv. Opt. Mater., 2017, 5(18), 1700227 CrossRef.
- S. S. Pedro, L. P. Sosman, R. B. Barthem, J. C. G. Tedesco and H. N. Bordallo, Effects of Cr3+ concentration on the optical properties of Cs2NaAlF6 single crystals, J. Lumin., 2013, 134, 100–106 CrossRef CAS.
- B. Struve and G. Huber, The effect of the crystal field strength on the optical spectra of Cr3+ in gallium garnet laser crystals, Appl. Phys. B, 1985, 36(4), 195–201 CrossRef.
- M. G. Brik, S. J. Camardello and A. M. Srivastava, Influence of covalency on the Mn4+2Eg→4A2g emission energy in crystals, ECS J. Solid State Sci. Technol., 2015, 4(3), R39–R43 CrossRef CAS.
- P. D. Rack and P. H. Holloway, The structure, device physics, and material properties of thin film electroluminescent displays, Mater. Sci. Eng., R, 1998, 21(4), 171–219 CrossRef.
- X. Gao, H. Liu, X. Yang, Y. Tian, X. Lu and L. Han, A novel Eu3+/Eu2+ co-doped MgSrLa8(SiO4)6O2 single-phase white light phosphor for white LEDs, RSC Adv., 2017, 7(3), 1711–1717 RSC.
- J. Han, L. Li and M. Peng, et al., Toward Bi3+ red luminescence with no visible reabsorption through manageable energy interaction and crystal defect modulation in single Bi3+-doped ZnWO4 crystal, Chem. Mater., 2017, 29(19), 8412–8424 CrossRef CAS.
- Y. H. Kim, P. Arunkumar and B. Y. Kim, et al., A zero-thermal-quenching phosphor, Nat. Mater., 2017, 16(5), 543 CrossRef CAS PubMed.
- W. Ji, M.-H. Lee and L. Hao, et al., Role of oxygen vacancy on the photoluminescence of BaMgSiO4: Eu phosphors: experimental and theoretical analysis, Inorg. Chem., 2015, 54(4), 1556–1562 CrossRef CAS PubMed.
- A. Monteil, W. Nie, C. Madej and G. Boulon, Multisites Cr3+ in GGG and GSGG garnets, Opt. Quant. Electron., 1990, 22(1), S247–S257 CrossRef CAS.
Footnote |
| † Electronic supplementary information (ESI) available. See DOI: 10.1039/d0ra01742f |
| This journal is © The Royal Society of Chemistry 2020 |


