DOI:
10.1039/D0RA01621G
(Paper)
RSC Adv., 2020,
10, 19576-19586
Adsorption and dissociation behavior of H2 on PuH2 (100), (110) and (111) surfaces: a density functional theory+U study
Received
19th February 2020
, Accepted 17th May 2020
First published on 22nd May 2020
Abstract
The density functional theory (DFT) and DFT plus correction for on-site Coulomb interaction (DFT+U) method were performed to investigate the adsorption and dissociation of H2 on PuH2 (100), (110) and (111) surfaces. Overall, the H2 molecule can be adsorbed on the PuH2 surface without spontaneous dissociation. The calculated H–H bond lengths (RH–H) are all elongated to different degrees, and the RH–H at different adsorption sites is about 0.84–4.21% longer than in the gas phase. We found that the dissociation of H2 on the (110) surface is a spontaneous exothermic process, and a total energy of 0.60 eV is released in the whole process. The smaller barriers corroborate that the migration of an H atom on the PuH2 surface is possible, and even spontaneous diffusion may occur. The spontaneous migration of a hydrogen atom adsorbed on the (110) surface from the surface to the interior promotes the conversion of PuH2 to PuH3, which may be the fundamental driving force of hydrogenation corrosion. Our results provide useful information to explain the mechanism of hydrogenation corrosion on the PuH2 surface.
1. Introduction
Metal plutonium is a very important radioactive material in the field of the nuclear industry;1 due to its complex 5f electronic structure, plutonium has very complex physical and chemical properties,2–4 such as very low melting point, large anisotropic coefficient of thermal expansion, low symmetry crystal structure, and many solid–solid phases. Plutonium and its compounds are very important nuclear materials in the nuclear industry, and are widely used in nuclear energy, nuclear weapons and other national defense nuclear energy engineering fields.5 In addition, plutonium compounds also have many novel and complex properties, e.g., superconductivity, topological insulator and so on.3,6 The chemical activity of plutonium is very strong, even at room temperature, it will self-ignite,7 and it will very easily react with the environment atmosphere and corrode, which is very unfavorable to the long-term storage of plutonium and the recycling of nuclear waste. When plutonium interacts with H2, H2O and hydrogen containing impurities (such as rubber, plastic, etc.) in environmental atmosphere, it is easy to form plutonium hydrides.8 Due to the very active chemical properties of plutonium and the zero activation energy in the hydrogenation process, the reaction is completed in an instant, and once the hydride is formed, it will act as a catalyst to accelerate its corrosion rate in room temperature air.
The hydrogenation of plutonium is an autocatalytic exothermic reaction, and the reaction is very fast, so the hydrogen reaction of plutonium is considered to be the most serious corrosion reaction that may be encountered in the practical application of plutonium.9 However, there are relatively few studies on the plutonium hydride system, which plays an important role in the overall corrosion of plutonium. Only a few literature reports are preliminary studies on the synthesis of plutonium hydride, kinetics and thermodynamics of plutonium hydrogen reaction.10–14 The low ratio PuHx (x = 2–2.75) is a cubic structure, and the lattice parameters range from 5.34 to 5.36 Å. With the increase of hydrogen atom, the cell size becomes smaller, i.e., the volume becomes smaller.15 Experiments corroborate that when the range of hydrogen atom is between 2.75 and 3.0, there are both cubic and hexagonal structures.16 The ground state structure of PuH3 may be distorted LaF3 type structure, tripartite structure (P![[3 with combining macron]](https://www.rsc.org/images/entities/char_0033_0304.gif) c1, space group no. 165), or orthogonal YF3 (Pnma, space group No. 62) structure.17 When there is PuHx on the surface of plutonium, it will accelerate the aging of plutonium and play a catalytic role.8 The growth and cracking process of H2 on the surface and inside of plutonium was revealed by SEM.18
c1, space group no. 165), or orthogonal YF3 (Pnma, space group No. 62) structure.17 When there is PuHx on the surface of plutonium, it will accelerate the aging of plutonium and play a catalytic role.8 The growth and cracking process of H2 on the surface and inside of plutonium was revealed by SEM.18
Because it is difficult to carry out the research of plutonium hydride experimentally, the theoretical research reports on the plutonium hydrogen system have been increasing in the past decade, e.g., the structure, electronic structure and dehydrogenation behavior of plutonium hydrides. The phase transition behavior of PuH3 is induced by pressure, and the electronic properties of the predicted structure are calculated by the first principle GGA+U (U = 6.0 eV).19 Under environmental conditions, the dissociation reaction of H2 molecule adsorbed on (100) surface is very active, resulting in the formation of hydrogen ions similar to hydrides on Pu surface.20 The electronic structure, chemical bond, kinetics and thermodynamic properties of cubic PuH2 and PuH3 were studied by LDA+U/LDA+U + SOC methods, and the influence of SOC effect on the electronic structure of plutonium hydride was discussed.21 Under atmospheric pressure, the hydrogen absorption and dehydrogenation behaviors of cubic PuH2 and PuH3 are closely related to temperature.22 The hydrogenation and diffusion properties of cubic PuH2+x (x = 0, 0.25, 0.5, 0.75, 1) are performed by GGA+U method.23 In the past few years, we have also employed high-precision all-electron full potential linearized augmented plane wave plus local orbitals (FP-LAPW+lo) to study the structure, electronic properties and lattice dynamics properties of plutonium hydrides in detail, taking into account the Coulomb interaction and SOC effect between Pu-5f electrons.24–26
Among the corrosion products of plutonium, the oxide of plutonium has been reported by a large number of literatures both experimentally and theoretically. However, there are few studies on plutonium hydrides. On the one hand, it is very toxic, easy pulverization and self-ignition, which makes it difficult to characterize the relevant experiments. On the other hand, there are still many controversies on the structure of plutonium hydrides. In the present study, we performed first-principles approach to investigate the source power of hydrogen corrosion on the PuH2 surface. The rest of this article is arranged as follows. In section 2, the theoretical algorithm details are briefly introduced. In section 3, the results and discussion are presented, including the adsorbate sites and free H2 molecule (see 3.1), the stable adsorption site of H2 on PuH2 surface (see 3.2), the dissociation of H2 molecule on PuH2 (110) surface (see 3.3) and the adsorption and diffusion behavior of H on the PuH2 surface (see 3.4). And finally, our conclusions are summarized in section 4.
2. Methodology
The DFT calculations were executed employing the projector augmented wave (PAW)27,28 scheme, as implemented in the Vienna ab initio Simulation Package (VASP) code.29–31 The exchange-correlation energies were approximated in the generalized gradient approximation (GGA) using the Perdew–Burke–Ernzerhof functional.32–34 The cutoff energy for the plane wave expansion set was kept at a constant value of 500 eV. According to the convergence test, a 4 × 4 × 1 grid of Monkhorst–Pack scheme35 in the Brillouin zone can be used for the surface simulations. The 6s27s26p66d25f4 and 1s1 orbitals25 are treated as valence electrons of Pu and H, respectively. The strong Coulomb repulsion between the localized 5f electrons of Pu is described by the GGA+U method.36 According to this theory, the effective U parameter, Ueff = (U − J), is the difference between the Coulomb U and the exchange J parameter, hereinafter referred to as U. Referring to the previous research of our team, here we introduce an effective U parameter U = 4 eV (ref. 25) to describe the Pu–H system. The convergence criteria of energy and force are that the energy difference of electron self-consistent cycle is less than 10−5 eV and the force between net atoms is less than 0.01 eV Å−1. The climbing image nudged elastic-band (CI-NEB) algorithm37,38 is used to examine the energy barrier and the minimum energy path (MEP) of hydrogen diffusion on the surface of PuH2. All image structures are completely relaxed until the force on each atom in the model is less than 0.01 eV Å−1.
In the present study, we selected (100), (110) and (111)39,40 three classical representative surfaces to simulate the Pu–H system. We use 2 × 2 supercells to construct PuH2 surface, and each surface is composed of periodic repeating slabs, and the construction of each surface has undergone strict convergence test, i.e., the (100) surface is 16 PuH2 units arranged in 8 layers (Fig. 1d), the (110) surface is 24 PuH2 units arranged in 6 layers (Fig. 1e), and the (111) surface is composed of 16 PuH2 units arranged in 12 layers (Fig. 1f), as presented in Fig. 1. In order to eliminate the interaction between the periodic repeating slabs, the thickness of the vacuum layer of the two adjacent slabs is set to 15 Å along the c direction. The influence of dipole interaction on total energy is eliminated by decoupling the slab with dipole correction approach. Unless otherwise stated, all the results reported here allow the top four layers of Pu and H atoms as well as the adsorbates to completely relax, and the lower layers of Pu and H atoms are frozen at their equilibrium bulk positions because they are almost unaffected.
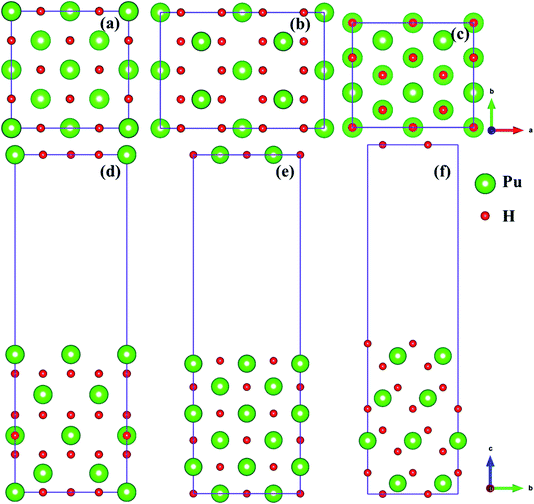 |
| | Fig. 1 Side and top views of the (100) [(a) and (d)], (110) [(b) and (e)], and (111) [(c) and (f)] surfaces. | |
The adsorption energy is considered as an indicator of adsorption strength of adsorbate. The adsorption energy here is defined by subtracting the total energy of the adsorption system from the sum of the energy of clean surface and adsorbate (H atom or H2 molecule), which is expressed as:41
| | |
Eads = (Eslab + Eabsorbate) − Eslab+adsorbate
| (1) |
where
Eslab and
Eabsorbate are the total energy of pure PuH
2 surface and isolated hydrogen atom or free gas-phase H
2 molecule, respectively.
Eslab+adsorbate is the total energy of the adsorption system on the surface of PuH
2. According to the definition, the positive (negative) value of adsorption energy represents the exothermic (endothermic) process, which is thermodynamically stable (unstable).
3. Results and discussions
3.1 Adsorbate sites and free H2 molecule
As mentioned above, we employed (100), (110) and (111) typical surfaces to simulate the evolution behaviors of H or H2 on the PuH2 surface, trying to elucidate the potential mechanism of hydrogen corrosion. Side views of (100), (110) and (111) surfaces of PuH2 are shown in Fig. 1d–f, while top views are presented in Fig. 1a–c, respectively. Here, we select the top, center and bridge sites of Pu atom on the PuH2 surface as potential adsorption sites and the positions of these special points are consistent with the previous literature.40,42 For (100), (110) surfaces, the top, center, and bridge sites were selected as candidate adsorption sites, and the following are simply labeled with 1, 2 and 3 sites, respectively, while for (111) surface, the top and bridge sites are chosen as the alternate sites, i.e. 1 and 3 sites. The free H2 molecule is simulated in a 10 Å × 10 Å × 10 Å cube box, with two hydrogen atoms 1 Å apart and allowing the hydrogen atoms to fully relax. The calculated H–H bond length (RH–H) is 0.7500 Å, which is in good agreement with the theoretical (0.749 Å)43 and experimental values (0.740 Å) (Fig. 2).44
 |
| | Fig. 2 Potential adsorption sites on the (100) (a), (110) (b) and (111) (c) surfaces. | |
3.2 Stable adsorption site of H2 on PuH2 surface
Theoretically, the axial direction of the adsorbed H2 molecule may be at any angle with the PuH2 surface, so it is difficult to simulate all saturations. In our calculation, for each adsorption site on each surface, only two limit cases are considered, i.e. parallel or perpendicular to the PuH2 surface direction, which are abbreviated as L and V respectively. Please note that the P–H distance (DPu–H) is employed to measure the relative position of H2 molecule and PuH2 surface before and after optimization, and the critical value of H2 bond length (0.745 Å) in gas-phase43 is used to judge whether it dissociates. Initially, H2 molecule is placed at different adsorption sites on the (100), (110) and (111) surfaces of PuH2 according to a certain P–H distance, and the hydrogen atoms are about 1 Å apart. We found that the spontaneous dissociation of H2 molecule occurred in the 2-L, 2-V and 3-L models on the (100) surface, as shown in Fig. 3. By comparing Fig. 3a and d, for the 2-L model, after complete relaxation, DPu–H = 4.4022 Å, RH–H = 3.7868 Å, it is obvious that the P–H distance increases, and the H–H bond length is far longer than 0.745 Å in the gas-phase, indicating the spontaneous dissociation of H2 molecule on the surface. The models 2-V and 3-L are similar to the above dissociation process, except that in Fig. 3b, after the dissociation of H2 molecule, the hydrogen atom diffuses through the (100) surface to the interior, which is the possible inducement of hydrogen corrosion.
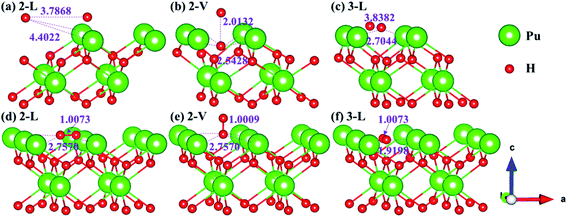 |
| | Fig. 3 Initial and spontaneous dissociation models of 2-L [(a) and (d)], 2-V [(b) and (e)], and 3-L [(c) and (f)] on (100) surface. | |
The side views of H2 molecules before and after optimization of stable adsorption sites on (100) (Fig. 4), (110) (Fig. 5 and 6) and (111) (Fig. 7 and 8) surfaces are listed in Fig. 4–8, respectively. The adsorption energies of the stable adsorption sites of H2 on the PuH2 surface are summarized in Table 1. In general, H2 molecule can be adsorbed stably on the PuH2 surface without spontaneous dissociation. The calculated H–H bond lengths are all elongated to different degrees, and the RH–H at different adsorption sites is about 0.84–4.21% longer than the gas phase. For (100) surface, H2 molecule can be adsorbed at 1-L (Fig. 4a and d), 1-V (Fig. 4b and e) and 3-V (Fig. 4c and f) sites, and the side views are shown in Fig. 4. However, the calculated adsorption energies are −0.82, −5.29 and −7.60 eV respectively, indicating that the adsorption of H2 at these three sites is an endothermic process and thermodynamic unstable. In Fig. 5 and 6, we find that H2 molecule can be adsorbed on all adsorption sites of (110) surface without spontaneous dissociation, and it is adsorbed above the surface, and DPu–H and RH–H are stretched to different degrees. The adsorption energy values in Table 1 confirm that 1-L, 2-L, 2-V and 3-V are all stable adsorption sites, and the larger adsorption energies indicate that the adsorption of H2 molecule at the above sites belongs to chemisorption, in which 2-L model is the strongest adsorption model (Eads = 7.64 eV) on (110) surface, while 1-V site has the most negative adsorption energy (Eads = −12.28 eV) and is the most unstable configuration. The side view of 2-L model is displayed in Fig. 5c, it can be seen that the H2 molecule is about 1.7296 Å away from the surface, and the H–H bond is elongated to 0.7608 Å, compared with 0.745 Å in the gas-phase. For the (111) surface, the side views of the stable adsorption models of H2 molecule are exhibited in Fig. 7 and 8. The smaller positive adsorption energies of 1-L (Eads = 0.03 eV) and 3-L (Eads = 0.59 eV) configurations indicate that the adsorption of H2 on the relaxed PuH2 surface belongs to physisorption. However, the negative adsorption energy of 1-V (Eads = −1.94 eV) and 3-V (Eads = −0.29 eV) models means that the adsorption of H2 at these sites is endothermic and thermodynamic unstable. The dissociation of H2 molecule adsorbed at the sable site is still possible, which is very important to reveal the mechanism of hydrogen corrosion on the PuH2 surface. More work is needed to further study its underlying causes.
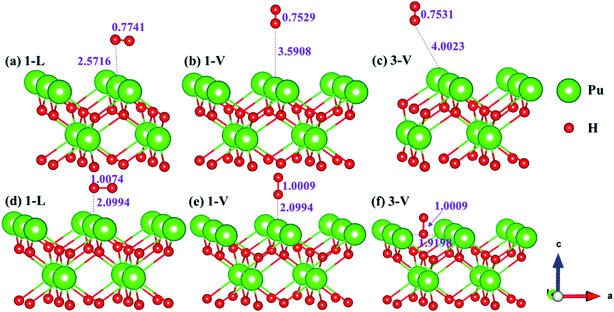 |
| | Fig. 4 Initial and final configurations of 1-L [(a) and (d)], 1-V [(b) and (e)], and 3-V [(c) and (f)] H2 adsorption on (100) surface. | |
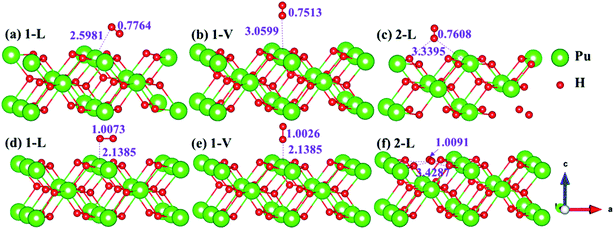 |
| | Fig. 5 Initial and final models of 1-L [(a) and (d)], 1-V [(b) and (e)], and 2-L [(c) and (f)] H2 adsorption on (110) surface. | |
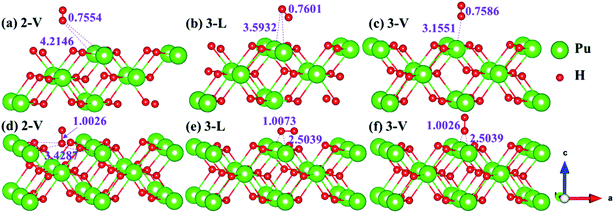 |
| | Fig. 6 Initial and final configurations of 2-V [(a) and (d)], 3-L [(b) and (e)], and 3-V [(c) and (f)] H2 adsorption on (110) surface. | |
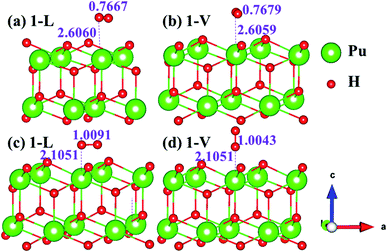 |
| | Fig. 7 Initial and final models of 1-L [(a) and (c)] and 1-V [(b) and (d)] H2 adsorption on (111) surface. | |
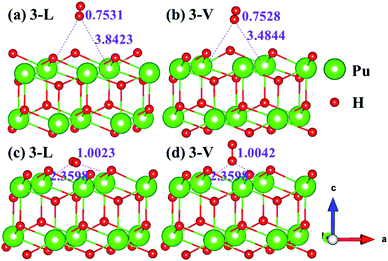 |
| | Fig. 8 Initial and final configurations of 3-L [(a) and (c)] and 3-V [(b) and (d)] H2 adsorption on (111) surface. | |
Table 1 Adsorption energies of different H2 adsorption configurations on the PuH2 (100), (110) and (111) surfaces
| Surface |
Site |
Type |
Eads/eV |
Fig. |
| (100) |
1 |
L |
−0.82 |
4d |
| V |
−5.29 |
4e |
| 3 |
V |
−7.60 |
4f |
| (110) |
1 |
L |
4.39 |
5d |
| V |
−12.28 |
5e |
| 2 |
L |
7.64 |
5f |
| V |
2.79 |
6d |
| 3 |
L |
−0.92 |
6e |
| V |
2.30 |
6f |
| (111) |
1 |
L |
0.03 |
7c |
| V |
−1.94 |
7d |
| 3 |
L |
0.59 |
8c |
| V |
−0.29 |
8d |
3.3 Dissociation of H2 molecule on PuH2 (110) surface
In order to further explore the root cause of hydrogenated corrosion of PuH2 surface, we utilize CI-NEB approach to determine the possible dissociation path and energy barrier of H2 molecule at the stable adsorption site. According to the adsorption energy values in Table 1, we choose (110) surface to elucidate the dissociation behavior of H2 molecule at the 2-L adsorption site. After testing, the final state is the fully relaxed model of the coadsorption sites of the two hydrogen atoms on the PuH2 surface along the a and b axis directions, and the initial state is the H2 molecule adsorbed on 2-L configuration. The energy barrier and structure diagrams of H2 molecule dissociation at the 2-L adsorption site on the (110) surface of PuH2 are plotted in Fig. 9.
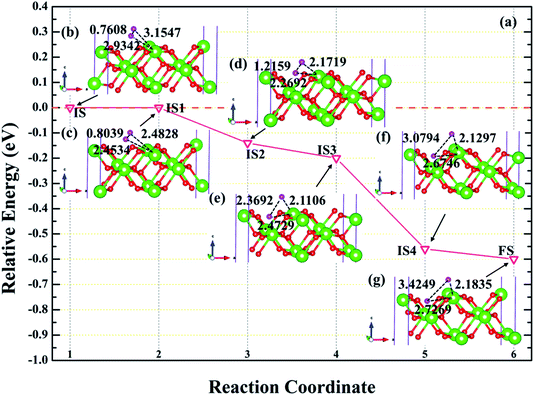 |
| | Fig. 9 The energy barrier and structure diagrams of H2 dissociation on the (110) surface. The inserted models represent the image state [(c), (d), (e) and (f)] from the initial state (b) to the final state (g) in the dissociation process. | |
It can be clearly seen from Fig. 9a that the dissociation of H2 at the 2-L site on the (110) surface is a spontaneous exothermic process, and a total of 0.60 eV is released during the whole dissociation process. We also note that the dissociation of H2 molecule from initial state to final state (IS→FS) has gone through four image states (IS), labeled as IS1, IS2, IS3 and IS4, respectively. Besides, the dissociation process can be divided into five stages, i.e. IS→IS1→IS2→IS3→IS4→FS. In the first stage, i.e., IS→IS1, as shown in Fig. 9b and c, the H2 molecule underwent spontaneous non-thermal migration, the RH–H was stretched from 0.7608 to 0.8039 Å, and the relative positions of the two hydrogen atoms and the PuH2 surface changed, that is, DPu–H changed from 3.1547 (2.9342) to 2.4828 (2.4534) Å. In the IS1→IS2 stage, the two hydrogen atoms are closer to the PuH2 surface, and the RH–H is stretched to 1.2159 Å, and gives off 0.14 eV of energy. Similarly, in the IS2→IS3 stage, RH–H is further stretched to 2.3692 Å, and the DPu–H changes to 2.1106 and 2.4729 Å. In the IS3→IS4 stage, RH–H is stretched to 3.0794 Å, releasing 0.36 eV in the process. In the final stage of the dissociation process, RH–H is 3.4249 Å, and two hydrogen atoms co-adsorbed at stable positions near the bridge and center sites. More work is needed to explore the migration of hydrogen atoms adsorbed on the surface between stable adsorption sites.
3.4 Adsorption of H on the PuH2 surface
3.4.1 Diffusion of H atom between adsorption sites on the surface. To investigate the possibility of migration between two hydrogen atoms co-adsorbing on the PuH2 surface after spontaneous dissociation, we adopted CI-NEB algorithm to determine the energy barriers and the minimum energy paths (MEPs). Initially, we placed hydrogen atom at two adsorption sites respectively, allowing the top four layers of atoms and adsorbate to relax completely, thus reaching the lowest energy state, and used these two states as the initial and final states respectively to examine the possibility of hydrogen migration adsorbed on the surface. For (100) and (110) surfaces, we consider three diffusion paths of hydrogen atoms, i.e. 1→2, 1→3 and 2→3, as exhibited in Fig. 10b and 11b. While for (111) surface, we only considers the diffusion of hydrogen atom from 1 to 3, is presented in Fig. 12b. The energy barrier and structure diagrams of hydrogen atom migration between adsorption sites on the (100), (110) and (111) surfaces of PuH2 are shown in Fig. 10–12.
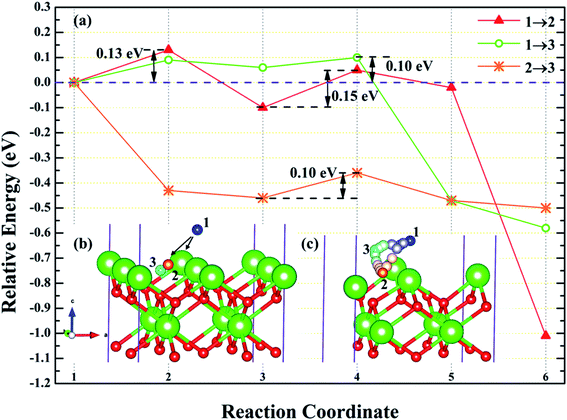 |
| | Fig. 10 The energy barrier and structure diagrams of hydrogen atom migration between potential adsorption sites on the (100) surface. | |
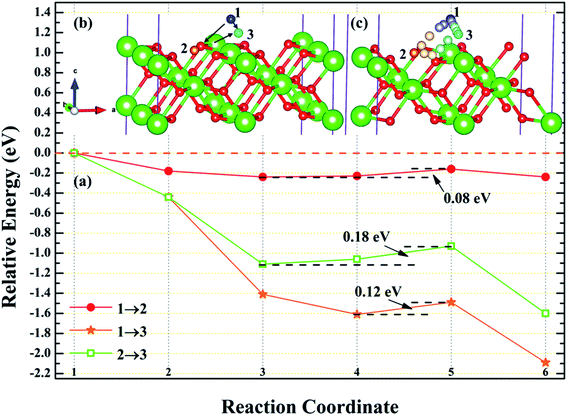 |
| | Fig. 11 The energy barrier and structure diagrams of hydrogen atom migration between potential adsorption sites on the (110) surface. | |
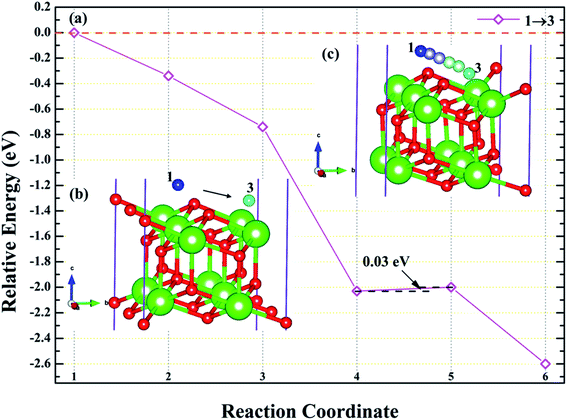 |
| | Fig. 12 The energy barrier and structure diagrams of hydrogen atom migration between potential adsorption sites on the (111) surface. | |
For the (100) surface, it can be seen from Fig. 10a that hydrogen atom need to overcome the energy barrier of 0.13 and 0.10 eV during the migration of 1→2 and 1→3, while there is no energy barrier in the migration of 2→3, but the diffusion energy of image state 3 to 4 increases by 0.10 eV, indicating that hydrogen atom are more likely to realize the migration of 1→3 and 2→3, and the structure diagrams are shown in Fig. 10c. For (110) surface, there is no energy barrier for the migration of hydrogen atoms from 1→2, 1→3, and 2→3, but the energy of the migration from inserted image state 4 to 5 increases 0.08, 0.12, and 0.18 eV, respectively, as presented in Fig. 11a, and the structure diagrams are displayed in Fig. 11c. For the (111) surface, Fig. 12a shows that there is no energy barrier for the migration of hydrogen atom from 1 to 3, similarly, the energy of diffusion from the inserted image state 4 to 5 increases by 0.03 eV. In summary, hydrogen atom adsorbed on the surface of PuH2 is likely to migrate, in particular, hydrogen atom can almost spontaneously diffuse on the (110) and (111) surface. In addition, whether the hydrogen atom adsorbed on the surface can diffuse to the interior remains to be verified by more work.
3.4.2 Stable adsorption sites of H atom. We have examined the stability of H atom adsorption model at different sites on the (100), (110) and (111) surfaces, the calculated adsorption energies are summarized in Table 2, and the side views of the most stable adsorption structure before and after optimization are listed in Fig. 13. Furthermore, the Bader charges of the most stable adsorption system and clean slab on the (100), (110) and (111) surfaces are calculated, which are generalized in Table 3. At the same time, the charge density difference is calculated to measure the interaction mechanism between adsorbate and PuH2 surface, so as to better understand hydrogenated corrosion from the perspective of charge transfer, as shown in Fig. 14.
Table 2 Adsorption energies of hydrogen atom at potential adsorption sites on the PuH2 (100), (110), and (111) surfaces
| Surface |
Site |
Eads/eV |
| (100) |
1 |
0.63 |
| 2 |
9.20 |
| 3 |
0.43 |
| (110) |
1 |
5.88 |
| 2 |
8.79 |
| 3 |
3.93 |
| (111) |
1 |
1.89 |
| 3 |
2.78 |
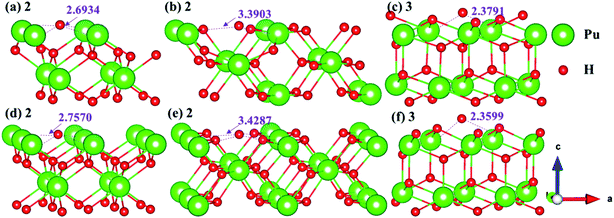 |
| | Fig. 13 Initial and final models of hydrogen atom at the most stable adsorption sites on the PuH2 (100), (110), and (111) surfaces. | |
Table 3 The Bader charges of the most stable adsorption system and clean slab on the PuH2 (100), (110) and (111) surfaces. “δ” indicates the difference of Bader charges after adsorption
| Surface |
Site |
Atom |

(slab)/|e| |

(slab + H)/|e| |
δ/|e| |
| (100) |
2 |
H |
|
1.689 |
+0.689 |
| Pu34 |
15.340 |
15.047 |
−0.293 |
| Pu38 |
|
15.047 |
−0.293 |
| Pu42 |
|
15.047 |
−0.293 |
| Pu46 |
|
15.047 |
−0.293 |
| (110) |
2 |
H |
|
1.572 |
+0.572 |
| Pu51 |
14.601 |
14.567 |
−0.034 |
| Pu57 |
|
14.567 |
−0.034 |
| Pu63 |
|
14.567 |
−0.034 |
| Pu69 |
|
14.567 |
−0.034 |
| (111) |
3 |
H |
|
1.547 |
+0.547 |
| Pu37 |
14.555 |
14.508 |
−0.047 |
| Pu38 |
|
14.502 |
−0.053 |
| Pu45 |
|
14.508 |
−0.047 |
| Pu46 |
|
14.502 |
−0.053 |
 |
| | Fig. 14 The charge density difference of the most stable hydrogen adsorption model on the PuH2 (100) (a), (110) (b), and (111) (c) surfaces. The value of the isosurface is 0.005 e Å−3. | |
From Table 2, it can be seen that the adsorption energies of all adsorption configurations are positive, which proves that the adsorption of hydrogen atom on the PuH2 surface is exothermic and thermodynamically stable. For (100) surface, the adsorption energies of 1- and 3-site are 0.63 and 0.43 eV respectively, implying that the adsorption of H atom is physisorption, while the adsorption energies of 2-site are 9.20 eV, suggesting that the adsorption of hydrogen atom belongs to chemisorption. For the (110) and (111) surfaces, the relatively large adsorption energies indicate that the adsorption of hydrogen atom is chemisorption. By comparing the adsorption energies in Table 2, we found that 2-, 2- and 3-site were the most stable adsorption sites on the (100), (110) and (111) surfaces, respectively. It can be seen from Fig. 13 that the hydrogen atom adsorbed at the stable site is still adsorbed on the PuH2 surface after completely relaxing, except that the relative position of hydrogen atoms to the surface has changed, e.g., the DPu–H of hydrogen atoms adsorbed on the (110) surface has changed from 3.4287 to 3.3903 Å (Fig. 13b and e).
We defined the charge density difference as the difference between the charge density of adsorbate system and the sum of the charge density of isolated hydrogen atom and slab, which reflects the charge redistribution and net charge transfer between adsorbate and surface. As can be seen from Fig. 14, for the (100) (Fig. 14a), (110) (Fig. 14b) and (111) (Fig. 14c) surfaces, there is a charge aggregation zone between the hydrogen atom adsorbed on the surface and the surrounding Pu atoms, indicating that there is bond interaction between Pu and hydrogen atoms. To further quantify the charge transfer between Pu and H atoms, Bader charge analysis45 was used to evaluate the charge transfer. As can be seen from Table 3, for the 2-site on the (100) surface, the charge amount of the four Pu atoms on the pure slab surface is 14.564|e|. After adsorbing an H atom, each Pu atom on the surface lost 0.293|e| of charge, while the adsorbate gained 0.689|e| of charge. For the 2-site on the (110) surface, after adsorption of an H atom, the four Pu atoms around the adsorbent all lost the charge of 0.034|e|, while the H atom gained a total charge of 0.572|e|. For the 3-site on the (111) surface, after adsorption of an H atom, four Pu atoms near the adsorbent lost electrons to varying degrees, i.e., Pu37 and Pu45 lost 0.047|e| of charge, while Pu38 and Pu46 lost 0.053|e| of charge, and the hydrogen atom gained a total charge of 0.547|e|. In conclusion, the existence of adsorbate causes charge redistribution and net charge transfer between surface atoms, and the path of charge transfer is Pu→H.
3.4.3 Diffusion of H atom between surface and bulk stable adsorption site. In order to understand the root cause of hydrogenation corrosion on the PuH2 surface, we used CI–NEB method to evaluate the possibility of internal diffusion of H atom adsorbed on the surface. Compared with the adsorption energies in Table 2, we chose the (110) surface with stable adsorption system to test the diffusion behavior of H atom. After testing, the 3-site of (110) surface and the bridge site of Pu5 and Pu17 (Fig. 15g) on the subsurface after complete relaxation were taken as the initial (IS) and final state (FS) structures respectively. The energy barrier and structure diagrams of hydrogen atom diffusion from 3-site on (110) surface to the internal are shown in Fig. 15.
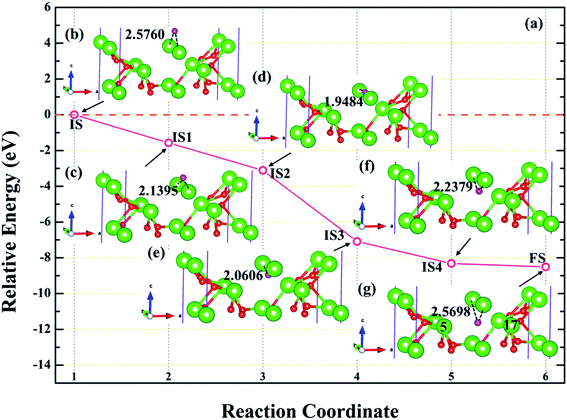 |
| | Fig. 15 The energy barrier and structure diagrams for the diffusion of hydrogen atom from (110) surface to internal. | |
From Fig. 15, we are surprised to find that the diffusion of hydrogen atom from the (110) surface to the interior is a spontaneous exothermic process, releasing a total of 8.51 eV of energy. In detail, the hydrogen atom migrates through four image states in IS→FS, so the diffusion process can be divided into five stages, i.e., IS→IS1→IS2→IS3→IS4→FS. During the first stage of the diffusion, i.e., IS→IS1, from Fig. 15a, DPu–H changes from 2.5760 to 2.1395 Å (Fig. 15b and c) and gives off 1.57 eV of energy. In the diffusion of IS1→IS2, hydrogen atom migrate to the surface and DPu–H becomes 1.9484 Å (Fig. 15d), releasing 1.54 eV of energy. In the third stage of the diffusion, i.e., IS2→IS3, the hydrogen atom crosses the surface and migrates inward, DPu–H changes to 2.0606 Å (Fig. 15e), releasing 3.98 eV of energy in the process. During the migration of IS3→IS4, DPu–H changes to 2.2379 Å (Fig. 15f) and releases 1.23 eV of energy. In the final stage of the migration, i.e., IS4→FS, the hydrogen atom diffuses to a stable site on the subsurface, DPu–H becomes 2.5698 Å (Fig. 15g) and gives off 0.19 eV of energy. In summary, the spontaneous migration of hydrogen atom from the surface to the interior can be attributed to the conversion of PuH2 to PuH3 after the adsorption of one hydrogen atom, which may be the fundamental driving force of hydrogenation corrosion.
4. Conclusions
The adsorption and dissociation of H2, as well as the diffusion behavior of H atoms on PuH2 (100), (110) and (111) surfaces have been studied by density functional theory (DFT) and DFT plus correction for on-site Coulomb interaction (DFT+U) method. Our conclusions are summarized as follows.
In general, H2 molecule can be adsorbed stably on the PuH2 surface without spontaneous dissociation. Our results show that H2 molecule placed horizontally at the center site (2-L site) of the (110) surface is the most stable adsorption configuration, and its adsorption energy is 7.64 eV, which belongs to chemisorption. During the whole dissociation process, H2 molecule released 0.60 eV energy on the (110) surface.
In summary, hydrogen atom adsorbed on the surface of PuH2 is likely to migrate, in particular, hydrogen atom can almost spontaneously diffuse on the (110) and (111) surface. The adsorption energies of all configurations are positive, proving that the adsorption of hydrogen on the PuH2 surface is exothermic and thermodynamically stable. The results of Bader charge and charge density difference indicate that the presence of adsorbate causes the charge redistribution and net charge transfer between surface atoms, which also shows the bond interaction between Pu and H. The spontaneous migration of hydrogen atom adsorbed on the (110) surface from surface to interior leads the conversion of PuH2 to PuH3, which may be the essential cause of the hydrogenation corrosion on the PuH2 surface. Our theoretical predictions provide useful information for interpreting complex experimental data.
Conflicts of interest
There are no conflicts to declare.
References
- A. E. Gorden, J. Xu, K. N. Raymond and P. Durbin, Chem. Rev., 2003, 103, 4207–4282 CrossRef CAS PubMed.
- S. Méot-Reymond and J. M. Fournier, J. Alloys Compd., 1996, 232, 119–125 CrossRef.
- J. C. Martz and A. J. Schwartz, JOM, 2003, 55, 19–23 CrossRef CAS.
- D. Kolman, M. Griego, C. James and D. Butt, J. Nucl. Mater., 2000, 282, 245–254 CrossRef CAS.
- S. S. Hecker, Metall. Mater. Trans. A, 2004, 35, 2207–2222 CrossRef.
- X. Zhang, H. Zhang, J. Wang, C. Felser and S. C. Zhang, Science, 2012, 335, 1464–1466 CrossRef CAS PubMed.
- W. Weber, R. Ewing, C. Catlow, T. D. De La Rubia, L. Hobbs, C. Kinoshita, H. Matzke, A. T. Motta, M. Nastasi and E. Salje, J. Mater. Res., 1998, 13, 1434–1484 CrossRef CAS.
- M. Brierley, J. P. Knowles, A. Sherry and M. Preuss, J. Nucl. Mater., 2016, 469, 145–152 CrossRef CAS.
- J. M. Haschke, T. H. Allen and L. A. Morales, Science, 2000, 287, 285–287 CrossRef CAS PubMed.
- K. Balasubramanian, T. E. Felter, T. Anklam, T. W. Trelenberg and W. McLean II, J. Alloys Compd., 2007, 444, 447–452 CrossRef.
- O. Eriksson, Y. Hao, B. Cooper, G. Fernando, L. Cox, J. Ward and A. Boring, Phys. Rev. B: Condens. Matter Mater. Phys., 1991, 43, 4590–4597 CrossRef CAS PubMed.
- G. Cinader, D. Zamir and Z. Hadari, Phys. Rev. B: Solid State, 1976, 14, 912–920 CrossRef CAS.
- M. Butterfield, T. Durakiewicz, E. Guziewicz, J. Joyce, A. Arko, K. Graham, D. Moore and L. Morales, Surf. Sci., 2004, 571, 74–82 CrossRef CAS.
- L. Dinh, J. Haschke, C. Saw, P. Allen and W. McLean II, J. Nucl. Mater., 2011, 408, 171–175 CrossRef CAS.
- T. Muromura, T. Yahata, K. Ouchi and M. Iseki, J. Inorg. Nucl. Chem., 1972, 34, 171–173 CrossRef CAS.
- R. N. Mulford and G. E. Sturdy, J. Am. Chem. Soc., 1956, 78, 3897–3901 CrossRef CAS.
- W. Runde, L. F. Brodnax, G. S. Goff, S. M. Peper, F. L. Taw and B. L. Scott, Chem. Commun., 2007, 1728–1729 RSC.
- M. Brierley, J. Knowles and M. Preuss, J. Nucl. Mater., 2016, 469, 39–42 CrossRef CAS.
- B. T. Wang, W. Yin, W. D. Li and F. Wang, J. Appl. Phys., 2012, 111, 013503 CrossRef.
- N. Goldman and M. A. Morales, J. Phys. Chem. C, 2017, 121, 17950–17957 CrossRef CAS.
- J. J. Zheng, B. T. Wang, I. Di Marco and W. D. Li, Int. J. Hydrogen Energy, 2014, 39, 13255–13265 CrossRef CAS.
- Y. Yang and P. Zhang, Phys. Lett. A, 2015, 379, 1649–1653 CrossRef CAS.
- X. Yang, Y. Yang, Y. Lu, Z. Sun, S. Hussain and P. Zhang, Int. J. Hydrogen Energy, 2018, 43, 13632–13638 CrossRef CAS.
- S. Li, X. Ye, T. Liu, T. Gao, S. Ma and B. Y. Ao, J. Mater. Chem. A, 2018, 6, 22798–22808 RSC.
- S. Li, B. Ao, X. Ye, R. Qiu and T. Gao, J. Phys. Chem. C, 2018, 122, 10103–10112 CrossRef CAS.
- S. Li, Y. Guo, X. Ye, T. Gao and B. Y. Ao, Int. J. Hydrogen Energy, 2017, 42, 30727–30737 CrossRef CAS.
- G. Kresse and D. Joubert, Phys. Rev. B: Condens. Matter Mater. Phys., 1999, 59, 1758–1775 CrossRef CAS.
- P. E. Blöchl, Phys. Rev. B: Condens. Matter Mater. Phys., 1994, 50, 17953–17979 CrossRef PubMed.
- G. Kresse and J. Hafner, Phys. Rev. B: Condens. Matter Mater. Phys., 1993, 47, 558–561 CrossRef CAS PubMed.
- G. Kresse and J. Furthmüller, Phys. Rev. B: Condens. Matter Mater. Phys., 1996, 54, 11169–11186 CrossRef CAS PubMed.
- G. Kresse and J. Hafner, J. Phys.: Condens. Matter, 1994, 6, 8245–8257 CrossRef CAS.
- J. P. Perdew, J. A. Chevary, S. H. Vosko, K. A. Jackson, M. R. Pederson, D. J. Singh and C. Fiolhais, Phys. Rev. B: Condens. Matter Mater. Phys., 1992, 46, 6671–6687 CrossRef CAS PubMed.
- J. P. Perdew, K. Burke and M. Ernzerhof, Phys. Rev. Lett., 1996, 77, 3865–3868 CrossRef CAS PubMed.
- J. P. Perdew, K. Burke and M. Ernzerhof, Phys. Rev. Lett., 1998, 80, 891 CrossRef CAS.
- H. J. Monkhorst and J. D. Pack, Phys. Rev. B: Solid State, 1976, 13, 5188–5192 CrossRef.
- S. Dudarev, G. Botton, S. Savrasov, C. Humphreys and A. P. Sutton, Phys. Rev. B: Condens. Matter Mater. Phys., 1998, 57, 1505–1509 CrossRef CAS.
- G. Henkelman, B. P. Uberuaga and H. Jónsson, J. Chem. Phys., 2000, 113, 9901–9904 CrossRef CAS.
- G. Henkelman and H. Jónsson, J. Chem. Phys., 2000, 113, 9978–9985 CrossRef CAS.
- Q. Shi and R. Sun, Comput. Theor. Chem., 2017, 1106, 43–49 CrossRef CAS.
- B. E. Tegner, M. Molinari, A. Kerridge, S. C. Parker and N. Kaltsoyannis, J. Phys. Chem. C, 2017, 121, 1675–1682 CrossRef CAS.
- X. Kong, Y. Yu, S. Ma, T. Gao, T. Lu, C. Xiao, X. Chen and C. Y. Zhang, Appl. Surf. Sci., 2017, 407, 44–51 CrossRef CAS.
- M. Huda and A. Ray, Physica B, 2004, 352, 5–17 CrossRef CAS.
- H. Yu, G. Li, H. Li, R. Qiu, H. Huang and D. Meng, J. Alloys Compd., 2016, 654, 567–573 CrossRef CAS.
- P. Allen and L. E. Sutton, Acta Crystallogr., 1950, 3, 46–72 CrossRef CAS.
- W. Tang, E. Sanville and G. Henkelman, J. Phys.: Condens. Matter, 2009, 21, 084204 CrossRef CAS PubMed.
|
| This journal is © The Royal Society of Chemistry 2020 |
Click here to see how this site uses Cookies. View our privacy policy here.  Open Access Article
 *a,
Lei Wan
 b,
Gan Lia and
Tao Gaob
![[3 with combining macron]](https://www.rsc.org/images/entities/char_0033_0304.gif) c1, space group no. 165), or orthogonal YF3 (Pnma, space group No. 62) structure.17 When there is PuHx on the surface of plutonium, it will accelerate the aging of plutonium and play a catalytic role.8 The growth and cracking process of H2 on the surface and inside of plutonium was revealed by SEM.18
c1, space group no. 165), or orthogonal YF3 (Pnma, space group No. 62) structure.17 When there is PuHx on the surface of plutonium, it will accelerate the aging of plutonium and play a catalytic role.8 The growth and cracking process of H2 on the surface and inside of plutonium was revealed by SEM.18


