DOI:
10.1039/D0RA01610A
(Paper)
RSC Adv., 2020,
10, 11339-11347
Fabrication of resorcinol-based porous resin carbon material and its application in aqueous symmetric supercapacitors
Received
19th February 2020
, Accepted 11th March 2020
First published on 20th March 2020
Abstract
Carbon materials with porous structures with their unique surface area and charge transport properties have been attracting significant attention as electrode materials in renewable energy storage devices. The rapid agglomeration of layered materials during electrochemical processes reduces their shelf life and specific capacitance, which can be prevented by the introduction of suitable pores between the layers. In this study, resorcinol-based porous resin carbon was facilely prepared via a simple carbonization of the potassium salts of resorcinol-potassium resin. The morphology, structure and surface properties of the carbon materials were investigated using scanning electron microscopy (SEM), transmission electron microscopy (TEM), N2 adsorption and energy dispersive spectroscopy (EDS). It is proposed that the fast nucleophilic addition between the phenols and formaldehyde produces nano-sized gel particles, followed by carbonization into carbon particles, finally packing to the mesopores. Due to the synergistic effects of the tailored porosity and O-doping, the prepared carbon materials show a high specific capacitance (198 F g−1 for RC700), good capacitance retention (96.5% for RC700) at 2 A g−1 in 6 M KOH and the specific area of RC700 is 540 m2 g−1.
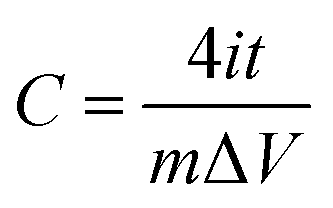
A supercapacitor is an important electrochemical energy storage device.1–3 A single supercapacitor is composed of electrodes, separators, electrolytes and fluid collectors, in which the electrode material is the most important component.4 The key to the technological progress of supercapacitors lies in the development of high performance electrode materials.5 Porous carbon materials have been widely used in supercapacitor electrodes, and the research is deepening day by day.6,7 Carbon-based supercapacitors mainly use the double layer formed at the interface of electrodes and electrolytes for charge storage. Pore structure of carbon materials, including specific surface area, pore size and size distribution, is the key to determine the capacitance performance of carbon electrode materials.8,9 According to the double layer model, the specific capacitance of carbon materials can be calculated by eqn (1).| |
 | (1) |
This indicates that the energy storage of supercapacitors is proportional to the surface area of porous carbon and inversely proportional to the distance from the pore wall to the ion center. Previous studies have shown that micropore has a greater contribution to the capacitance performance of carbon materials, especially for high performance supercapacitors.10,11 This is attributed to the formation of a thinner electric double layer (i.e., a smaller d value) in the micropore. Therefore, matching the pore size of carbon material with the conductive ion size of electrolyte is the key to obtain high capacitance.12 Therefore, carbon materials as supercapacitor electrodes should have uniform micropore channels. Simon pointed out that 0.7 nm is the most suitable pore size in aqueous electrolyte.13 In addition to pore size adjustment, proper surface modification can also help to improve the capacitance performance of porous carbon electrodes. Recently, the introduction of heteroatoms (O/N/S) in carbon skeleton has effectively increased the specific capacitance of carbon electrode materials in water electrolyte.14–17 The mechanism of capacitance increase may be the Faraday reaction with heteroatom functional groups and the increase of wettability of channels.17 Considering the above factors, if a material has both homogeneous ultrapore and heteroatom, it should have good capacitance performance. The preparation methods of carbon materials with adjustable pore size and large specific surface area include chemical activation, physical activation, template method, polymer carbonization method and dealloying method.18–23 Among the above methods, chemical activation method has comprehensive advantages, such as low cost, high efficiency, good preparation technology and one-step preparation of porous carbon with large specific surface area. Therefore, chemical activation method has been widely studied and applied. In typical chemical activation processes, carbon precursors are fully mixed with activators (such as KOH).24,25 The developed porosity is mainly formed by complex redox reactions during activation.
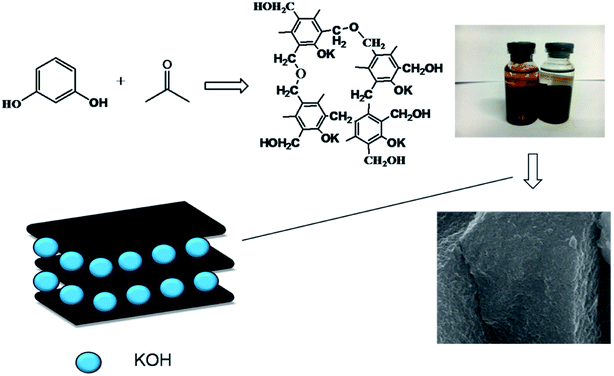
In this work, we developed an “in situ self-activation” method for the preparation of porous carbon materials with homogeneous oxygen doping.26 Firstly, phenolic resin carboxylate were synthesized, and then oxygen-doped porous carbon materials were prepared by direct carbonization and activation. K+ dispersed in phenolic resin uniformly in the form of –O–K+ produced uniform ultrafine pore of 0.7 nm during activation. The supercapacitor based on the obtained porous carbon (RC700) exhibits a specific capacity of 198 F g−1, an energy density of 24.75 W h kg−1 and a high retention capacity of 96.5% after 3000 cycles at a current density of 2 A g−1, 6 M KOH.
Results and discussion
The preparation process of oxygen-doped porous carbon materials is shown in the Fig. 1. In order to achieve both uniform pore size and abundant heteroatom doping, oxygen-doped phenolic resin potassium salt was prepared from the molecular structure design of carbon precursor using resorcinol as raw material and KOH as both catalyst and activator precursor. In the reaction process, “–O–K+” was formed from strong alkaline KOH and phenolic hydroxyl.7 The highly crosslinked structure of phenolic resin makes K+ disperse uniformly in it, avoiding the problem of non-uniform activator. In the process of carbonization, homogeneous ultrapore can be formed by in situ activation of uniformly dispersed activation ion K+ and it can be inferred that the micropore formed is short in length and highly permeable.
 |
| | Fig. 1 Schematic illustration of preparation of porous carbon (RC). | |
Fig. 2 is presenting the scanning electron microscopy (SEM) images of the prepared carbon materials. The surface of the material is porous which is carbonized at 700 °C, but the others look as if more compact. When the dosage of activator is constant, activation temperature plays a key role. When the temperature is below 600 °C, the main reactions (eqn (2)–(5)) occur as follows:27
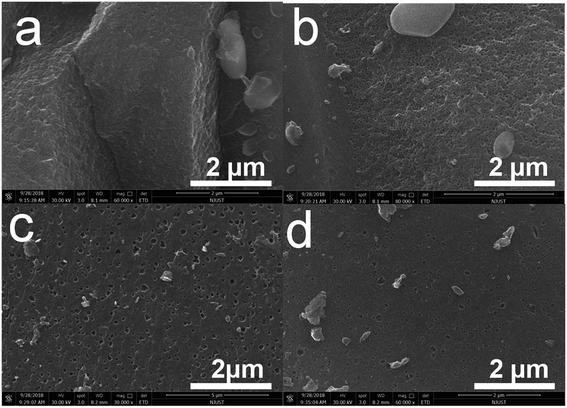 |
| | Fig. 2 SEM images of hierarchical structure at different magnifications. (a) RC500; (b) RC600; (c) RC700; (d) RC800. | |
When the temperature is higher than 700 °C, the extra reactions (eqn (6)–(8)) may occur as follows:
It indicates that the activation of KOH increases further with the increase of temperature, resulting in more pores in carbon materials. When the temperature is too high, such as 800 °C, KOH will spill over quickly, and the activation will be reduced.
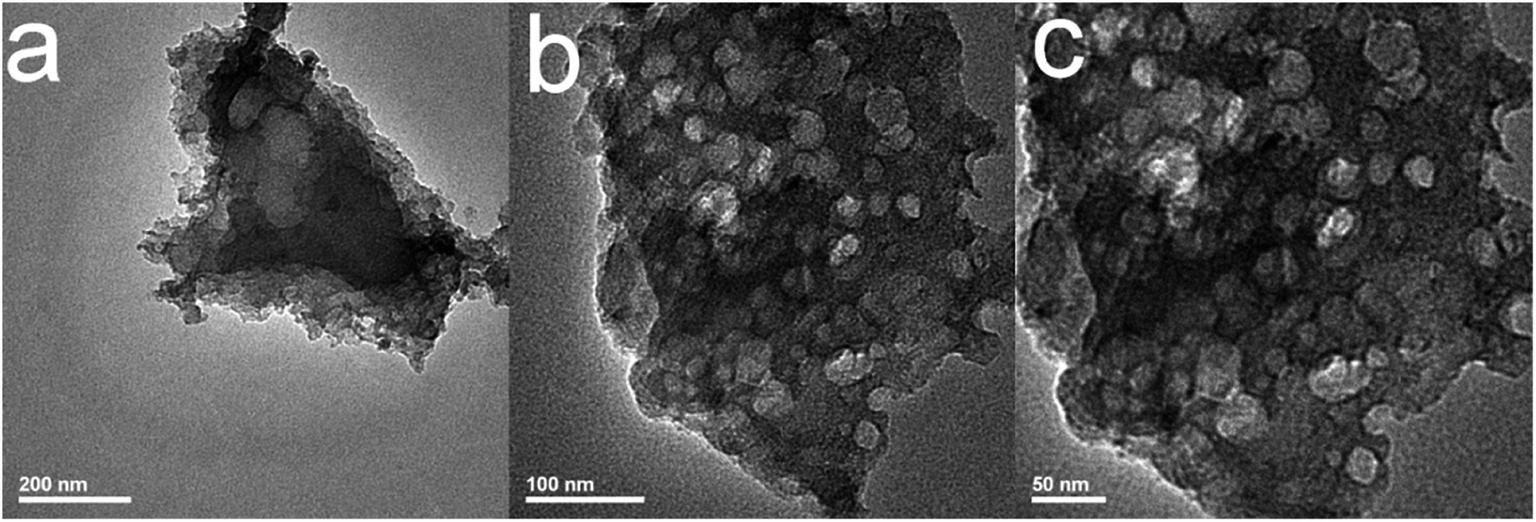
The micro-morphology of the material can be observed by TEM at a higher magnification. As shown in Fig. 3, RC700 sample is composed of a large number of small size nanoparticles, whose particle size is 50–150 nm, and the accumulation gap of these particles forms a large number of mesoporous pores. High resolution TEM images show that resin carbon materials have abundant wormlike micropore channels, which originate from homogeneous monodisperse K+ “in situ self-activation”. The results of SEM and TEM show that carbonization temperature has an important effect on the morphology of phenolic resin and the size of gel particles. Combined with Table 1, when the carbonization temperature is low (500 °C), the specific surface area of the material is smaller, and the pore structure is mainly microporous. With the increase of temperature, the mesoporous volume of the material increases obviously at 700 °C and 800 °C. The total mesoporous volume of RC700 is 0.15 cm3 g−1.
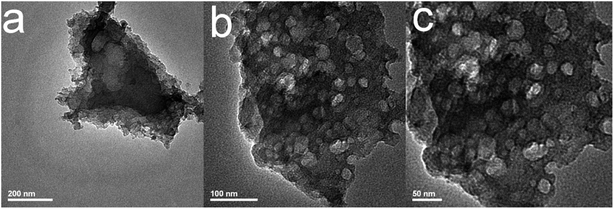 |
| | Fig. 3 TEM images of hierarchical structure at different magnifications. RC700 (a–c). | |
Table 1 Specific surface area and pore structure parameters of materials
| Sample |
SBET/m2 g−1 |
Vtotal/cm3 g−1 |
Vmeso/cm3 g−1 |
Vmicro/cm3 g−1 |
Pore size/nm |
| RC500 |
363 |
0.19 |
0.04 |
0.15 |
4.5 |
| RC600 |
458 |
0.25 |
0.06 |
0.19 |
2.4 |
| RC700 |
540 |
0.40 |
0.15 |
0.25 |
5.4 |
| RC800 |
466 |
0.27 |
0.07 |
0.20 |
2.2 |
Fig. 4 shows the EDS elemental composition and content. Generally speaking, the compositions of the materials are carbon and oxygen. Combination with Table 2, we give the proportion of elements in the corresponding materials. The data shows that the carbon content in RC800 material is the highest, which is mainly due to the reduction of oxygen content in RC800 material due to the higher activation temperature. RC600 is the highest in terms of oxygen content, which is mainly due to the activation reaction of KOH at this temperature and the full participation of oxygen in the related reaction. From Fig. 4, the carbon and oxygen elements of each material are uniformly distributed in the material, which lays the foundation for the rapid transmission of electrons in the material.
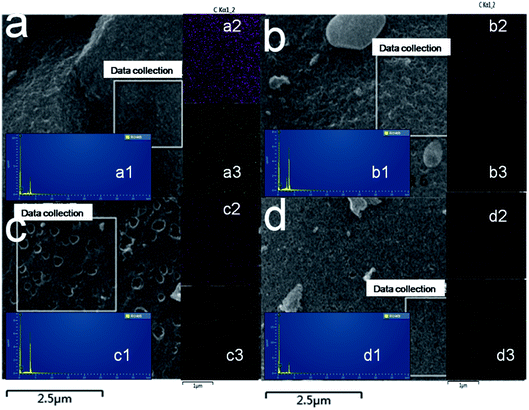 |
| | Fig. 4 EDS mapping of RC500; RC600; RC700; RC800 (a–d); elemental composition and content (a1–d1); C element (a2–d2); O element (a3–d3). | |
Table 2 The content of materials and percentage
| Sample |
C |
O |
C/% |
O/% |
| RC500 |
86.3 |
13.7 |
86.3% |
13.7% |
| RC600 |
80.1 |
19.9 |
80.1% |
19.9% |
| RC700 |
86.4 |
13.6 |
86.4% |
13.6% |
| RC800 |
87.3 |
12.7 |
87.3% |
12.7% |
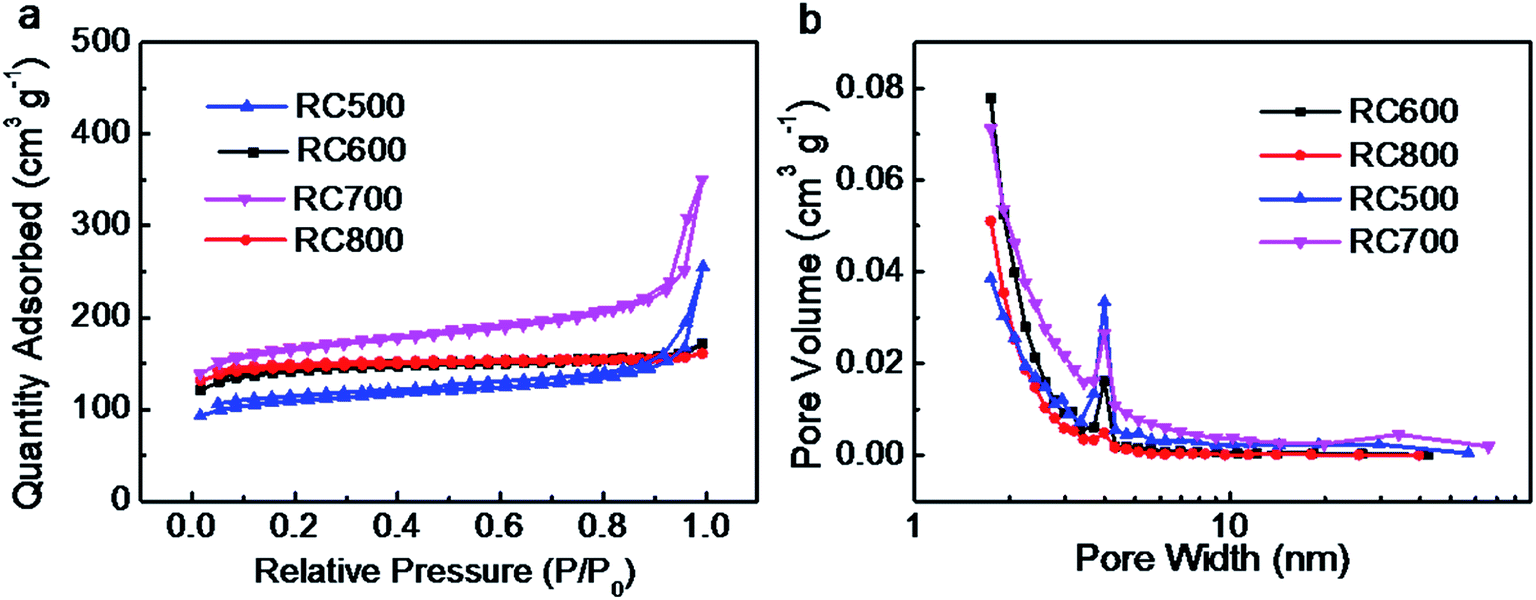
The internal structures of samples were tested by Brunauer–Emmett–Teller (BET) method. Fig. 5a presents the nitrogen isothermal adsorption curves of RC materials. From the shape of the curves, it is a typical adsorption curve of mesoporous materials-the IV isotherm. It is obvious that the nitrogen adsorption value of RC700 is the highest (350 cm3 g−1), while the value of RC500, RC600, RC800 is 252, 151, 149 cm3 g−1. The existence of hysteretic loop can be clearly seen on the nitrogen desorption curve of RC700, which can prove the existence of mesoporous materials. At the same time, the hysteresis loop of RC500 is also clearly visible.
 |
| | Fig. 5 (a) N2 adsorption/desorption isotherms and (b) pore-size distributions of carbon materials (RC500, RC600, RC700, RC800). | |
Fig. 5b is the pore size distribution of RC materials. The average pore size of RC500, RC600, RC700 and RC800 is 4.5, 2.4, 5.4 and 2.2 nm, however, the pore volumes are quite different. The RC700 has the largest total pore volume – 0.4 cm3 g−1. All the BET analytical data are shown in Table 1. As shown in Table 1, the specific surface area (SBET) of RC500, RC600, RC700 and RC800 is 363, 458, 540 and 466 m2 g−1, respectively. Evidently, RC700 has much larger SBET values than rest three samples. The material RC500 exhibits the smallest SBET value due to the insufficient carbonation temperature. Therefore, RC700 possesses the largest specific surface area and pore volume, which can provide plenty of space for the storage of electrolyte ions, contributing to good electrochemical capacitive properties. From the N2 isotherm adsorption desorption curve, it can be seen that with the increase of carbonization temperature from 500–800, the specific surface area of RC material first increases and then decreases, and RC700 has the largest specific surface area of 540 m2 g−1, and the largest total pore volume of 0.4 cm3 g−1. This shows that the material has good structural properties at this temperature. These characteristics show that the specific surface area and pore size distribution of the material can be effectively controlled by controlling the carbonization temperature when the activator proportion is determined.
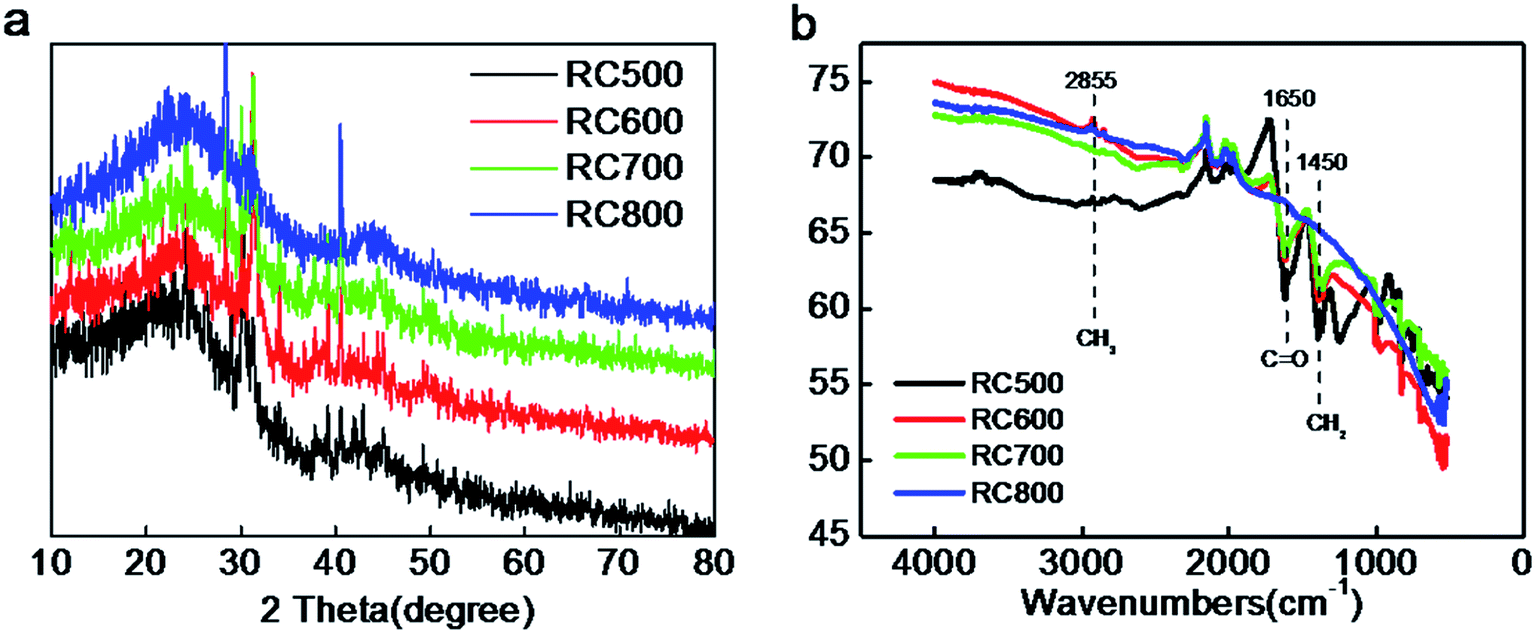
The X-ray diffraction (XRD) patterns of RC samples are shown in Fig. 6a. Two diffraction peaks can be observed at 2θ values of around 25.6° and 43°, which can be assigned to (002) and (101) planes of hexagonal carbon material, respectively. With the carbonization temperature increasing, the intensity of the peak at around 25.6° is basically unchanged, and the peak position is not shift, while the full-width at half-maximum (FWHM) decreases.28,29 These observations suggest an increased crystallite size, corresponding to the higher graphitized degree. A weak peak at 2θ = 43° is assigned to the (101) crystalline plane of carbon materials.
 |
| | Fig. 6 (a) XRD patterns of RC500, RC600, RC700, RC800 (b) Fourier transform infrared spectrophotometer (FTIR) of RC500, RC600, RC700, RC800. | |
FTIR spectrum of RC500, RC600, RC700 and RC800 are depicted in Fig. 6b. RC materials exhibit several peaks in 2855, 1650, and 1450 cm−1 corresponding the CH2, C![[double bond, length as m-dash]](https://www.rsc.org/images/entities/char_e001.gif) O, and C–H2 stretching vibration peaks. The peak at 810 cm−1 originates from the characteristic in plane breathing vibrational mode of s-triazine units.30 From the Fig. 6b, with the change of carbonization temperature, the content of CH2 in the material has changed greatly. RC500 has the most content of CH2, while the RC800 has less CO and CH2 than others. Corresponding to Table 2, the oxygen content of RC800 is the lowest among the four materials. Similarly, the CO functional group content of RC800 is the lowest. The data show that a certain high temperature carbonization treatment can effectively reduce the content of oxygen in carbon materials (RC800). Although the content of different groups has changed, the corresponding peak position has not shifted, which proves that the material has a good stability. According to the results of Table 2, the carbon content of RC500, RC600, RC700 and RC800 is 86.3%, 80.1%, 86.4% and 87.3%, respectively. The change of carbon content is directly related to carbonization temperature and time. In this work, the carbonization time is 120 min. Generally speaking, with the increase of carbonization temperature, the content of oxygen is decreasing, and the content of carbon is increasing. The composition of C–O, O–C–O and CO equivalent bond is changing. As for the optimization of oxygen doping, according to the results of Fig. 6b, the CO of RC700 and RC800 is less, reflecting that the C–O bond is destroyed more at high temperature, and the content of oxygen in the material will be reduced if the carbonization time is extended properly.
O, and C–H2 stretching vibration peaks. The peak at 810 cm−1 originates from the characteristic in plane breathing vibrational mode of s-triazine units.30 From the Fig. 6b, with the change of carbonization temperature, the content of CH2 in the material has changed greatly. RC500 has the most content of CH2, while the RC800 has less CO and CH2 than others. Corresponding to Table 2, the oxygen content of RC800 is the lowest among the four materials. Similarly, the CO functional group content of RC800 is the lowest. The data show that a certain high temperature carbonization treatment can effectively reduce the content of oxygen in carbon materials (RC800). Although the content of different groups has changed, the corresponding peak position has not shifted, which proves that the material has a good stability. According to the results of Table 2, the carbon content of RC500, RC600, RC700 and RC800 is 86.3%, 80.1%, 86.4% and 87.3%, respectively. The change of carbon content is directly related to carbonization temperature and time. In this work, the carbonization time is 120 min. Generally speaking, with the increase of carbonization temperature, the content of oxygen is decreasing, and the content of carbon is increasing. The composition of C–O, O–C–O and CO equivalent bond is changing. As for the optimization of oxygen doping, according to the results of Fig. 6b, the CO of RC700 and RC800 is less, reflecting that the C–O bond is destroyed more at high temperature, and the content of oxygen in the material will be reduced if the carbonization time is extended properly.
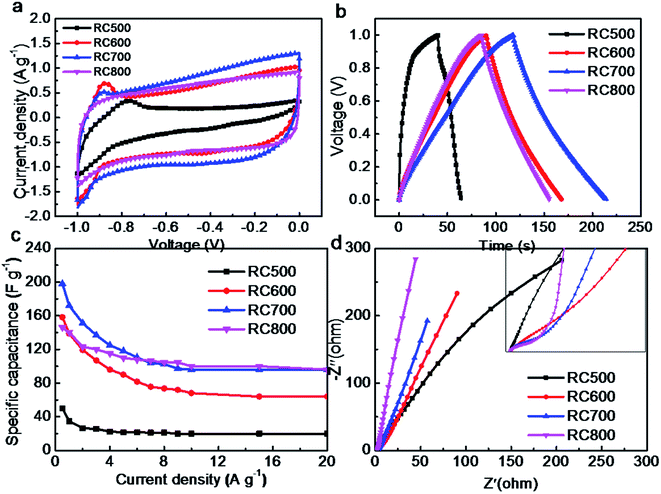
Fig. 7a is the cyclic voltammetry curve of RC material at 5 mV s−1 scanning rate. The cyclic voltammetric curve of RC600, RC700 and RC800 is approximately rectangle, which indicates that the charge–discharge reversibility of the material is better, and the main behavior is the electric double-layer capacitance.31 The area of cyclic voltammetry curve of RC700 material with larger specific surface area is larger at the same sweep speed, mainly because the charge storage of double-layer capacitor is proportional to the specific surface area of the material. The curve of RC500 deviates from rectangle seriously, and there are obvious redox peaks. The main reason is that the complex redox reactions occur during charging and discharging with a large number of oxygen-containing functional groups.
 |
| | Fig. 7 Electrochemical performance of RC materials in symmetric supercapacitors (a) cyclic voltammetry at 5 mV s−1 (b) galvanostatic charge and discharge diagrams at 0.5 A g−1 (c) the specific capacitance diagrams, (d) EIS of RC samples at 0.5–100![[thin space (1/6-em)]](https://www.rsc.org/images/entities/char_2009.gif) 000 Hz. 6 M KOH. 000 Hz. 6 M KOH. | |
Fig. 7b shows the galvanostatic charging and discharging (GCD) diagrams of RC materials at a constant current of 0.5 A g−1. As shown in Fig. 7b, the RC700 has a longer charge–discharge time at 0.5 A g−1, which proves that the material is superior in performance. Based on specific capacitance calculating formula eqn (4), the specific capacitance of RC500, RC600, RC700 and RC800 is 50, 158, 198 and 146 F g−1, respectively. This is in good agreement with the specific surface area data of the materials mentioned above.
Fig. 7c is the relationship between specific capacitance and current density of the materials. It can be seen from the Fig. 7c that the specific capacitance of RC700 material is the highest at different current densities, which is related to its larger specific surface area. It should be noted that the maximum value of RC700 is only 198 F g−1, which indicates that the utilization rate of specific surface area of the material is not high, which is related to the smaller pore size of the prepared carbon material. Hydrated ions in the electrolyte cannot enter the material effectively in charge and discharge process, and the contact area between the materials and the electrolyte is also low, resulting in a small amount of electrostatic storage charges.32 From the Fig. 7b, it can be found that the charging and discharging time of RC700 is longer than that of RC600 and RC800. The specific surface area of RC600 and RC800 is close, so the charge–discharge time and specific capacitance of RC600 and RC800 are close. Charge and discharge tests in KOH electrolyte also prove this point. In theory, electrolyte ions can diffuse into larger channels (K+/OH−, 0.3/0.35 nm, respectively), but considering the actual situation of the electrode reaction, the diffusion degree and velocity are bound to be affected in smaller channels. When charged and discharged at high current density, ions cannot effectively enter small channel, which reduces the utilization of the specific surface area.
Fig. 7d is the Nyquist diagram of the material. The range of the test is from 0.01 Hz to 100000 Hz. The impedance spectrum of various carbon materials has a similar appearance. In the high frequency region, the imaginary impedance is close to zero, and the real impedance is the sum of the contact resistance of each part, and the semicircle in the middle and high frequency region represents the internal resistance of charge transfer (Rct), and the 45° inclined line in the middle frequency region represents the Warburg impedance, and the length of the inclined line represents the diffusion velocity of ionic solution.10,33 Unlike most porous carbon materials, the impedance curves of these four materials at low frequencies are still at an angle of about 45° to the transverse axis, which indicates that the diffusion rate of electrolyte ions in these materials is very slow, mainly due to the concentrated distribution of supermicropore size.34
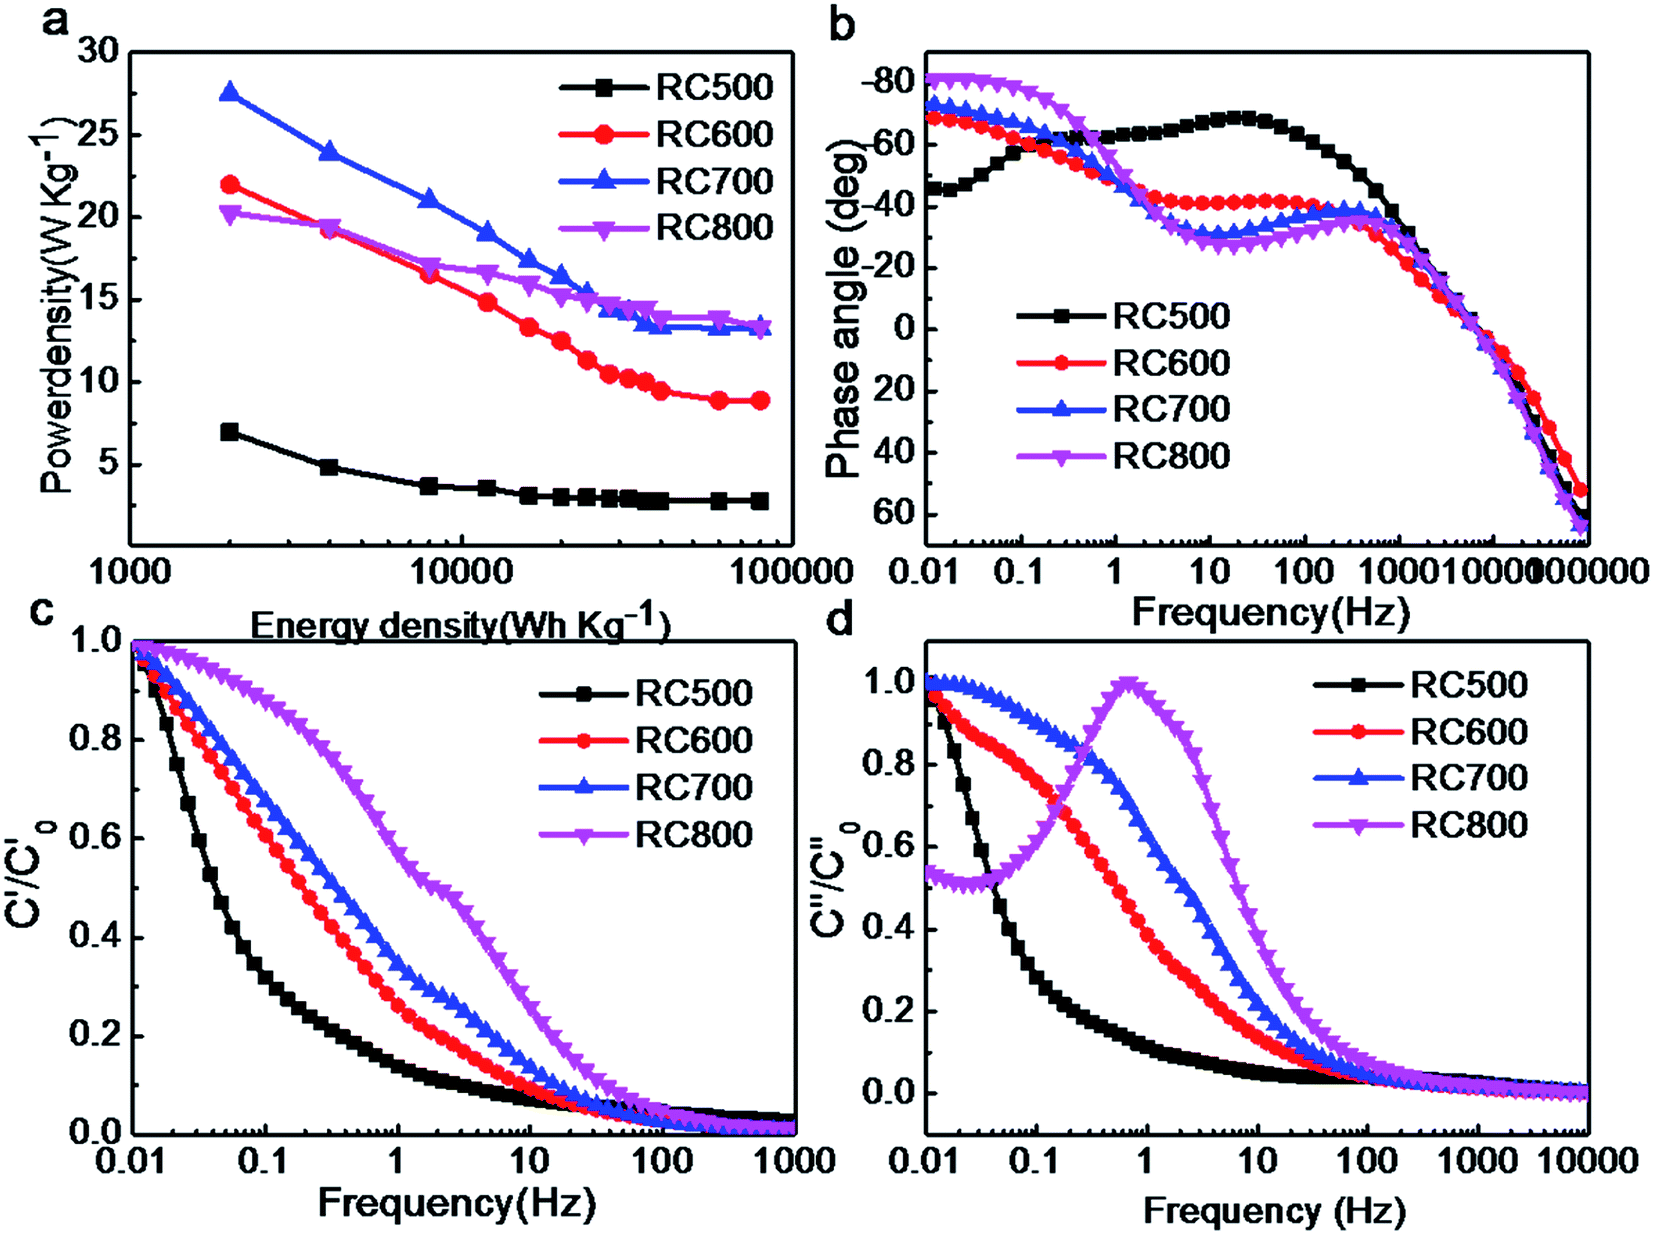
As shown in Fig. 8a, the maximum power densities of RC500, RC600, RC700 and RC800 are 7, 22, 28, 20 W kg−1, respectively. With the increase of energy density, the power density of materials decreases. The curves of RC600 and RC800 in Fig. 8b are almost coincide, indicating that there is little difference between them in KOH electrolyte. The maximum phase angle of the two electrodes (RC600/RC800) is −70°, which indicates that the proton transfer resistance in the electrodes is large, which is consistent with the impedance measurement.35 In the Fig. 8c, with the increase of frequency, the relative real capacitance decreases rapidly, which is mainly due to the fact that electrolytes can not effectively enter the internal channels of materials at high frequencies. RC600, RC700 and RC800 have a smaller slope and better retention performance than RC500. In Fig. 8d, the relaxation time of RC500, RC600, RC700 and RC800 is 10, 7, 1 and 6 s, respectively. The similar relaxation time of RC600 and RC800 indicates that they have similar charging and discharging efficiency in KOH.
 |
| | Fig. 8 (a) Comparison of energy density and power density of RC materials; (b) phase angle-frequency of RC materials; (c) real capacitance of RC materials at different frequencies; (d) imaginary capacitance of RC materials at different frequencies. 6 M KOH. | |
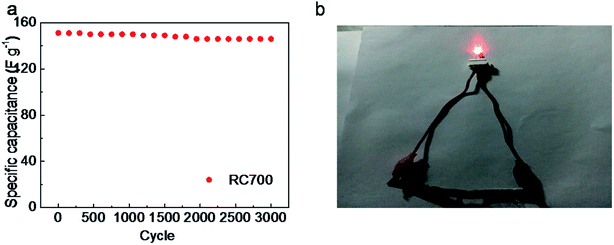
Fig. 9a shows that the initial specific capacitance of the RC700 material is 151.2 F g−1 at 2 A g−1. After 3000 cycles, the specific capacity of the material is 146 F g−1, and the capacitance retention rate of the material is 96.5% of the first cycle. After 3000 cycles, the capacitor's specific capacity is still high. Compared with the initial, the decrease of capacitance is mainly due to the electrochemical consumption of O element. Charging and discharging at high current density can fully demonstrate that the material has a good cycling performance in practical applications. Fig. 9b shows a red LED illuminated by a symmetrical supercapacitor made of RC700 as an electrode material.
 |
| | Fig. 9 (a) Cycling performance of symmetric supercapacitor constructed with RC700 as electrodes; (b) symmetric supercapacitor with RC700 as electrodes lit red LED. | |
Conclusion
Starting from the precursor of molecular design, several porous carbon materials with good performances were successfully prepared using crosslinked resins formed by resorcinol and formaldehyde as precursors, KOH as catalyst and activator, and successfully applied in water-system symmetric supercapacitors. SEM and TEM results showed that the surface morphology of the RC materials is different at different activation temperatures. XRD and FTIR characterization showed that the porous materials were mainly composed of carbon, and had a high graphitization, which was conducive to the transmission of electrons and electrolyte ions. The maximum specific surface area and pore volume of RC700 are 540 m2 g−1 and 0.4 cm3 g−1. The specific capacitance of RC700 material is 198 F g−1 at 0.5 A g−1, 151.2 F g−1 at 2 A g−1, 146 F g−1 after 3000 cycles, and the specific capacitance retention rate is 96.5%. At lower energy density, the maximum power density of the material is 28 W kg−1. The above results show that using simple phenolic resin as precursor can effectively construct commercially available electrode materials.
Experimental section
Preparation
Resorcinol (10 mmol) 1.10 g and 0.56 g KOH (10 mmol) were dissolved in 5 mL deionized water and stirred for 1 h to form a yellowish transparent solution. At 25 °C, 1.60 g formaldehyde solution (37 wt%, 20 mmol) was added to the above solution. After stirring for 30 minutes, the mixture was sealed and transferred to the oven at 80 °C. It was observed that the solution turned red rapidly and solidified 30 minutes later. After 72 hours of curing, the obtained deep red jelly-like resin hydrogel was immersed in acetone for 3 days, during which fresh acetone was replaced everyday. After soaking, the hydrogel was dried in dry air and formed a deep red xerogel. A certain amount of phenolic resin gel was placed in a tubular resistance furnace. Under argon protection, the temperature was heated at 3 °C min−1 to 600 °C and carbonizing for 2 h. After cooling at room temperature, the black solid residue was obtained, washed thoroughly with excess of 1 M HCl and then rinsed to neutral. The carbon materials were named as RC500, RC600, RC700, RC800, respectively.
Characterization
The microscopic morphology was observed with a scanning electron microscope (SEM, Sirion 200 FEI Netherlands) and a transmission electron microscope (TEM, JEM2100, JEOL, Japan). The surface chemical properties were determined by energy dispersive spectroscopy (EDS, INCA Energy Spectrometer). N2 adsorption–desorption isotherms were measured at liquid nitrogen temperature (−196 °C) using a surface area and porosity analyzer (ASAP2020, Micromeritics, USA). The carbon samples were degassed at 350 °C for 6 h under turbo molecular vacuum before the sorption measurements were carried out. The BET (Brunauer–Emmett–Teller) surface area was calculated using the N2 adsorption isotherm data within the relative pressure ranging from 0.05 to 0.25. The total pore volume was obtained at a relative pressure of 0.995. The micropore surface area and micropore volume were calculated using the t-plot method. For advanced porosity analysis, the pore size distributions were determined using the non-linear density functional theory (NLDFT) method considering sorption of nitrogen at −196 °C in carbon as a model adsorbent and slit-like pores as a pore model.
Electrochemical test
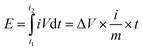
The electrochemical properties of the material were carried out on CHI660D (Shanghai CHI) workstation. All electrochemical performance tests, including cyclic voltammetry (CV), galvanostatic charging and discharging (GCD), electrochemical impedance spectroscopy (EIS) and cyclic life, were performed in a two-electrode system. All electrodes and electrolytes are deoxygenated prior to use to avoid side effects. In this paper, the scanning speed of the cyclic voltammetry is 5–500 mV s−1, and the range of the constant current charge and discharge is 0.5–20 A g−1, and the electrolyte is 6 M KOH, and the voltage window is −1–0 V. The cycle life test was carried out at 2 A g−1. The energy and power densities were calculated from the galvanostatic charge/discharge curves based on the following equations:| |
 | (9) |
| |
 | (10) |
| |
 | (11) |
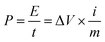
where E (W h kg−1) is energy density, P is power density (W kg−1), C (F g−1) is specific capacitance, ΔV (V) is the voltage range, i (A) is the discharge current, t (s) is the discharge time and m (g) is the total mass of anode and cathode active materials.
Conflicts of interest
There are no conflicts to declare.
Acknowledgements
This work is supported by The Weapon-equipment Pre-research Project Foundation, China (No. 41419030203 and No. 41419050202).
References
- Y. Zhou, Z. Zhu, C. Zhao, K. Zhang, B. Wang, C. Zhao and G. Chen, ACS Sustainable Chem. Eng., 2019, 7, 5095–5102 CrossRef CAS.
- Q. Zhou, Y. Gong and K. Tao, Appl. Surf. Sci., 2019, 478, 75–86 CrossRef CAS.
- Z. Zhang, Y. Huang, J. Yan, C. Li, X. Chen and Y. Zhu, Appl. Surf. Sci., 2019, 473, 266–274 CrossRef CAS.
- J. Zhou, Z. Zhang, Z. Li, T. Zhu and S. Zhuo, RSC Adv., 2015, 5, 46947–46954 RSC.
- S. Zhang, X. Shi, R. Wróbel, X. Chen and E. Mijowska, Electrochim. Acta, 2019, 294, 183–191 CrossRef CAS.
- J. Zhou, T. Zhu, W. Xing, Z. Li, H. Shen and S. Zhuo, Electrochim. Acta, 2015, 160, 152–159 CrossRef CAS.
- J. Zhou, Z. Qiu, J. Zhou, W. Si, H. Cui and S. Zhuo, Electrochim. Acta, 2015, 180, 1007–1013 CrossRef CAS.
- W. Si, W. Lei, Z. Han, Q. Hao, Y. Zhang and M. Xia, Sens. Actuators, B, 2014, 199, 154–160 CrossRef CAS.
- L.-B. Xing, S.-F. Hou, J.-L. Zhang, J. Zhou, Z. Li, W. Si and S. Zhuo, Mater. Lett., 2015, 147, 97–100 CrossRef CAS.
- N. Cai, J. Fu, V. Chan, M. Liu, W. Chen, J. Wang, H. Zeng and F. Yu, J. Alloys Compd., 2019, 782, 251–262 CrossRef CAS.
- Y. Bao, Y. Huang, X. Song, J. Long, S. Wang, L.-X. Ding and H. Wang, Electrochim. Acta, 2018, 276, 304–310 CrossRef CAS.
- B. Chang, W. Shi, S. Han, Y. Zhou, Y. Liu, S. Zhang and B. Yang, Chem. Eng. J., 2018, 350, 585–598 CrossRef CAS.
- P. Simon, Y. Gogotsi and B. Dunn, Science, 2014, 343, 1210–1211 CrossRef CAS PubMed.
- D. Chen, S. Zhou, H. Quan, R. Zou, W. Gao, X. Luo and L. Guo, Chem. Eng. J., 2018, 341, 102–111 CrossRef CAS.
- L. Cheng, Y. Hu, L. Ling, D. Qiao, S. Cui and Z. Jiao, Electrochim. Acta, 2018, 283, 664–675 CrossRef CAS.
- S. T. Gunday, E. Cevik, A. Yusuf and A. Bozkurt, J. Energy Storage, 2019, 21, 672–679 CrossRef.
- H. Guo, B. Ding, J. Wang, Y. Zhang, X. Hao, L. Wu, Y. An, H. Dou and X. Zhang, Carbon, 2018, 136, 204–210 CrossRef CAS.
- I. I. Gurten Inal, S. M. Holmes, E. Yagmur, N. Ermumcu, A. Banford and Z. Aktas, J. Ind. Eng. Chem., 2018, 61, 124–132 CrossRef CAS.
- Z. Hou, C. Shu and J. Long, Electrochim. Acta, 2018, 290, 657–665 CrossRef CAS.
- E. Kamali-Heidari, Z.-L. Xu, M. H. Sohi, A. Ataie and J.-K. Kim, Electrochim. Acta, 2018, 271, 507–518 CrossRef CAS.
- S. Lalwani, M. Munjal, G. Singh and R. K. Sharma, Appl. Surf. Sci., 2019, 476, 1025–1034 CrossRef CAS.
- Y. Li, J. Pan, J. Wu, T. Yi and Y. Xie, J. Energy Chem., 2019, 31, 167–177 CrossRef.
- Z. Liang, H. Liu, J. Zeng, J. Zhou, H. Li and H. Xia, Nanoscale Res. Lett., 2018, 13, 314 CrossRef PubMed.
- L. Miao, D. Zhu, M. Liu, H. Duan, Z. Wang, Y. Lv, W. Xiong, Q. Zhu, L. Li, X. Chai and L. Gan, Electrochim. Acta, 2018, 274, 378–388 CrossRef CAS.
- Y. Qiao, H. Wang, X. Zhang, P. Jia, T. Shen, X. Hao, Y. Tang, X. Wang, W. Gao and L. Kong, Mater. Lett., 2016, 184, 252–256 CrossRef CAS.
- J. Zhou, Z. Li, W. Xing, T. Zhu, H. Shen and S. Zhuo, Chem. Commun., 2015, 51, 4591–4594 RSC.
- Q. Wang, J. Yan, Y. Wang, T. Wei, M. Zhang, X. Jing and Z. Fan, Carbon, 2014, 67, 119–127 CrossRef CAS.
- S. S. Balaji, M. Karnan, J. Kamarsamam and M. Sathish, ChemElectroChem, 2019, 6, 1492–1499 CrossRef CAS.
- X. Shi, S. Zhang, X. Chen, T. Tang and E. Mijowska, ChemElectroChem, 2019, 6, 2302–2307 CrossRef CAS.
- Y. Zhang, S. Yang, S. Wang, X. Liu and L. Li, Energy Storage Mater., 2019, 18, 447–455 CrossRef.
- Y. Ouyang, R. Huang, X. Xia, H. Ye, X. Jiao, L. Wang, W. Lei and Q. Hao, Chem. Eng. J., 2019, 355, 416–427 CrossRef CAS.
- G.-H. An, S. Cha and H.-J. Ahn, Appl. Surf. Sci., 2019, 478, 435–440 CrossRef CAS.
- E. Cevik, S. T. Gunday, S. Akhtar and A. Bozkurt, Int. J. Hydrogen Energy, 2019, 44, 16099–16109 CrossRef CAS.
- P. Chang, H. Mei, Y. Zhao, W. Huang, S. Zhou and L. Cheng, Adv. Funct. Mater., 2019, 29, 1903588 CrossRef.
- J. Zhou, H. Shen, Z. Li, S. Zhang, Y. Zhao, X. Bi, Y. Wang, H. Cui and S. Zhuo, Electrochim. Acta, 2016, 209, 557–564 CrossRef CAS.
|
| This journal is © The Royal Society of Chemistry 2020 |
Click here to see how this site uses Cookies. View our privacy policy here. 
 Open Access Article
 This Open Access Article is licensed under a Creative Commons Attribution-Non Commercial 3.0 Unported Licence
 *a and
Ruoyu Wua
*a and
Ruoyu Wua