 Open Access Article
Creative Commons Attribution 3.0 Unported Licence
Deposition of an ultra-thin polyaniline coating on a TiO2 surface by vapor phase polymerization for electrochemical glucose sensing and photocatalytic degradation†
Sibani Majumdar and
Debajyoti Mahanta *
*
Department of Chemistry, Gauhati University, Assam, India 781014. E-mail: debam@gauhati.ac.in; debam2@gmail.com; Fax: +91-0361-2700311; Tel: +91-6000682511
First published on 5th May 2020
Abstract
Here, we have synthesized an ultra-thin coating of polyaniline on a TiO2 nanoparticle surface (PANI–TiO2) using a simple vapor phase polymerization method. By this method, an ultra-thin layer of PANI is obtained selectively on the TiO2 surface. This ultra-thin coating exhibits the properties of both the parent materials due to the composite surface causing an effective synergistic effect. SEM, TEM, and EDX studies and elemental mapping confirmed the formation of ultra-thin films on the TiO2 surface. TGA, UV/Vis and XRD studies were also done for further characterization. The composite has been used as a biosensor for glucose detection by immobilization of the enzyme glucose oxidase (GOx). Cyclic voltammetry, electrochemical impedance spectroscopy and amperometry studies were performed for glucose sensing. The linear range was observed from 20 to 140 μM glucose concentration from the amperometric analysis. The LOD of the biosensor was found to be 5.33 μM. The composite has also been used for photocatalytic degradation of the cationic dye Rhodamine B (RB). The order of degradation efficiency of RB is found to be PANI < TiO2 < PANI–TiO2. The synergetic effect of PANI and TiO2 is the reason for the enhanced degradation efficiency of the composite PANI–TiO2.
Introduction
Titanium dioxide (TiO2) has a wide range of applications such as in photovoltaic cells, drug delivery systems, and photocatalytic degradation of various pollutants and biosensors. Due to its promising structural, electrical and optical properties, it has received a lot of attention in recent years. Various advanced and hybrid materials of TiO2 have been designed to improve the properties of the parent material for superior applications. One of the uses of TiO2 is in biosensors for detection of glucose.1 There has been a rapid growth in the development of precise and convenient glucose monitoring systems in recent years. More than 85% of the biosensor market is occupied by glucose biosensors which indicate the demand of low-cost glucose sensors with high sensitivity and selectivity to deal with increasing blood sugar problem. Most of the biosensors available in market are electrochemical biosensor immobilized with a specific enzyme. Glucose oxidase (GOx) is the most popular and commercially used enzyme in enzyme-based glucose sensors. According to WHO, in 2012 around 1.5 million death is caused by diabetes.2 Diabetes also leads to kidney failures, vision loss and cardiovascular disease. In enzymatic biosensor, the enzyme glucose oxidase converts glucose into gluconolactone and generates hydrogen peroxide as a co-product.3 The first generation of glucose sensor involves measurement of the formed hydrogen peroxide. In the second generation sensors, a mediator is used for the transfer of electrons between the electrode and enzyme active site, while in third generation of glucose sensor, direct electron transfer takes place. In the third generation of glucose biosensors, the enzyme has been immobilized on different materials to facilitate the direct electron transfer.2 Semiconductors such as zinc oxide, zirconia and titanium dioxide are some of the choices of researchers as electrode materials for electrochemical biosensors.3–5 Various studies have been reported on TiO2 as glucose sensing material because of its high specific surface area, porous structure and a good biocompatibility.6,7 But poor electrical conductivity hinders its application in more precise and sensitive biosensor. Therefore, hybrid materials of TiO2 with other organic and inorganic materials have drawn the attention of the researchers for better results.8–10 Conducting polymers specially polyaniline (PANI) has been established as efficient electrode material in enzyme-based sensors due to its high electrical conductivity and high stability.11,12 But some limitations such as weak mechanical properties and poor biocompatibility affect the performance of the PANI based biosensors.13 However, composites of PANI with some of the materials can enhance its applicability as biosensor.14,15 Composites of two materials PANI and TiO2 have been considered as a promising class of materials to overcome the limitations of parent components.16,17Oxidation of pollutants is one of the wastewater treatment techniques that have been used for degradation of several organic contaminants. Photocatalytic degradation is also an oxidation technique, in which free radicals are generated by interaction of catalyst with photons of proper energy. TiO2 has been used as an efficient photocatalyst from many years for degradation of a wide range of pollutants under UV radiation.18 The photocatalytic activity of semiconductor like TiO2 was discovered by Frank and Bard where they have studied the degradation of cyanide.19 Later, Ollis et al. studied the potential application of photocatalysts for degradation of various organic compounds.20 When electromagnetic radiation of specific energy illuminated on the photocatalyst surface, excitation of valence band electrons to the conduction band takes place. This leads to the formation of positive hole and electrons in the valence band and conduction band respectively. The positive hole can directly oxidize the pollutants, or it may indirectly oxidize water to produce hydroxyl radicals that degrade the pollutants.21 The electron at the conduction band of the photocatalyst reduces the adsorbed oxygen. To keep the activity of the photocatalyst, simultaneous oxidation of the pollutants and reduction of the oxygen is necessary to avoid the recombination of the positive holes and electrons.21,22 To enhance the photocatalytic activity of the TiO2 based catalyst, researchers are working on modification of the catalysts using various strategies such as metallization, doping and sensitization etc.23 Conducting polymers acts as photosensitizer to improve the photocatalytic activity of TiO2 based catalysts.24–26 The various promising properties of PANI and its suitable band gap to sensitize TiO2, attracted the researchers to develop PANI–TiO2 composites for photocatalytic degradation of organic pollutants.
Here, we have prepared PANI–TiO2 composite by deposition of ultra-thin coating of PANI on TiO2 surface by vapor phase polymerization. PANI has been synthesized selectively on the surface of TiO2 particles by this easy and simple technique. The synthesized material has shown good photocatalytic activity towards the degradation of dye and glucose sensing. Rhodamine B (RB) a cationic dye has been effectively degraded by this composite. The composite shows enhanced degradation in comparison to bare TiO2. The synergetic effect of PANI and TiO2 is the reason for enhanced activity of this composite for glucose sensing as well as photocatalytic degradation of organic pollutant.
Results and discussions
Characterizations
Fig. 1(a) and (b) show the SEM images of TiO2 and PANI–TiO2, respectively. It is observed from the micrographs that PANI is coated on the surface of the TiO2 nanoparticles uniformly. It is observed from the SEM that the average size of both TiO2 and PANI–TiO2 particles are 80–100 nm. As there is no noticeable change in the shape and size of TiO2 particles after deposition of PANI, it confirms the advantage of vapor phase polymerization technique for ultra-thin and uniform coating of PANI on TiO2 surface. The enlarged SEM images of selected portions were compared and uniform layer of granular shaped PANI is observed in the case of PANI–TiO2 which is absent in TiO2 (Fig. S1†). The ultra-thin layer coating of PANI on the TiO2 particles are further confirmed from the TEM analysis of the composite given in Fig. 1(c) and (d). Fig. 1(e) and (f) shows the EDX pattern and the corresponding element weight% of bare TiO2 and the composite. From the EDX analysis it is observed that TiO2 consist 65.41% of Ti and 34.59% of O. While in the EDX of PANI–TiO2 composite has Ti (54.23%), O (35.25%), C (9.94%), N (0.02%), S (0.37%) and Cl (0.19%). It confirms the presence of PANI on the PANI–TiO2 composite. The S content is due to APS used as oxidant for synthesis of PANI. Generally, the weight% of N is high in PANI, but here in the PANI–TiO2 composite the weight% found for N is quite low. The peak for N is observed near 0.4 keV and the Ti peak is also appeared in the same range. So, it may overlap the peak corresponding to N.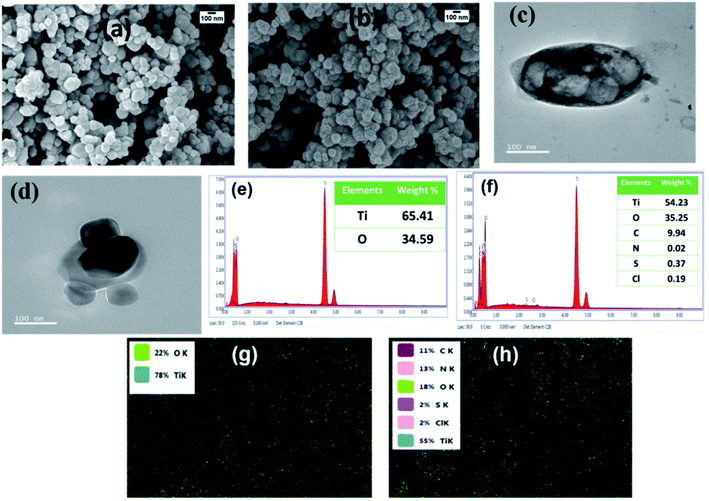 | ||
| Fig. 1 SEM images of (a) TiO2 and (b) PANI–TiO2, TEM images of PANI–TiO2 (c and d), EDX pattern of (e) TiO2 and (f) PANI–TiO2 and electron-dot mapping of (g) TiO2 and (h) PANI–TiO2. | ||
Therefore, we have also performed the electron-dot mapping analysis of TiO2 and the composite for confirmation of PANI coating. It is observed from elemental mapping shown in Fig. 1(g) and (h) that TiO2 has only Ti and O whereas PANI–TiO2 possesses all the elements of PANI (C, N, Cl and S) along with Ti and O. Thus, uniform and thin coating of PANI on the surface of TiO2 is confirmed from the SEM, TEM, EDX and elemental mapping study.
Fig. 2(a) shows the thermograms of TiO2 and PANI–TiO2 in the temperature range of 25–700 °C and the inset shows the TG of bulk PANI synthesized by conventional chemical oxidative polymerization (SI-1). It is observed that TiO2 possesses a high thermal stability and only 2% weight loss is there up to 700 °C while the degradation of PANI is more and about 72% weight loss up to 700 °C [inset Fig. 2(a)]. Similar results were also found in some other studies.27,28 The degradation pattern of PANI–TiO2 is also similar to that of TiO2 but the degradation is slightly more than that of TiO2 which started around 200 °C. This increase in degradation of the composite is due to the degradation of the PANI. It is interesting to note that only 1% more degradation is observed in PANI–TiO2 which indicates the presence of very low amount PANI in PANI–TiO2 composites.
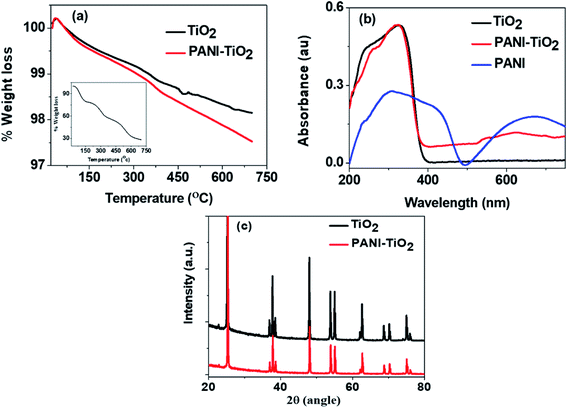 | ||
| Fig. 2 (a) Thermogravimetric analysis (inset shows the TG of PANI) (b) diffuse-reflectance UV-Visible spectra and (c) XRD pattern of TiO2 and PANI–TiO2 composite. | ||
The UV-Visible diffuse reflectance spectra of TiO2, PANI–TiO2 and PANI (synthesized by chemical polymerization, SI-1) are shown in Fig. 2(b). The characteristics bands of PANI are observed near 300 and 650 nm. TiO2 absorbs light only below 400 nm with the absorption sharp edge near 385 nm. The PANI–TiO2 composite also shows a similar band below 400 nm with absorption sharp edge near 380 nm. The peak observed at 650 nm in PANI is almost disappeared in the spectrum of PANI–TiO2 composite, rather a broad absorption band appeared near 600 nm which is absent in the absorption spectrum of bare TiO2. This broad band appears due to the charge carrier delocalization of PANI. Thus, the composite is expected to generate more electron–hole pairs than that of both PANI and TiO2, which will increase its photocatalytic activity.29,30
The highly crystalline structure of TiO2 is observed in the XRD pattern as shown in Fig. 2(c). The Bragg diffraction peaks indexed as (101), (112), (200), (105), (211), (204), (116), (220) and (215) indicates the anatase phase of TiO2 having tetragonal arrangement.31 The diffraction pattern of the synthesized PANI–TiO2 composite is also similar to that of TiO2 and does not show any characteristic pattern of PANI. The highly crystalline nature of TiO2 may overshadow the characteristic low intensity peaks of PANI. Moreover, the amount of PANI present in the composite is extremely small (around 1%) as compared to TiO2. However, it is noticed that the surface modification by PANI does not affect the structure of TiO2.
Electrochemical analysis for glucose detection
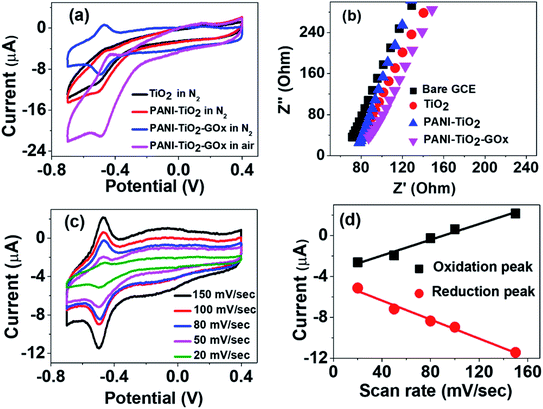
Fig. 3(a) shows the CVs of TiO2, PANI–TiO2 and PANI–TiO2–GOx at a scan rate of 100 mV s−1 in 0.1 M N2 saturated PBS. It is observed that the redox peak current of the PANI–TiO2 coated electrode is more than that of the TiO2 electrode. It is obvious because PANI enhances the conductivity in PANI–TiO2 composite in comparison to bare TiO2 electrode. Again, after loading the enzyme on PANI–TiO2 composite, the redox peaks become more distinct but the current decreases as GOx is a biomacromolecule introducing more electrical resistance.17 This result is also supported by electrochemical impedance studies as shown in Fig. 3(b). Due to the higher conductivity of the bare GCE, the charge transfer resistance (RST) of TiO2 coated electrode is more than that of the bare GCE. Then, the charge transfer resistance decreases on the PANI–TiO2 coated electrode due to the incorporation of conducting polymer PANI. Thus, PANI helps in enhancing the charge transfer in PANI–TiO2 composite electrode. The charge transfer resistance again increases in the PANI–TiO2–GOx coated electrode due to GOx which is an electrical insulator.Due to the introduction of GOx as described above, it is observed from Fig. 3(a) that, two almost symmetrical redox peaks appeared at around −0.49 V (reduction peak) and −0.46 V (oxidation peak) on the CV of PANI–TiO2–GOx electrode. This indicates the direct electron transfer of the enzyme with the electrode surface. Thus, the GOx is adsorbed on the composite surface and involves in reversible electrochemical process as shown in eqn (1).32
 | (1) |
We have also compared the electrochemical activity of the PANI–TiO2–GOx composite with air saturated 0.1 M PBS. The peaks appeared are not symmetrical when the PBS is not saturated with N2. In presence of oxygen, the chemical reaction given in eqn (2) takes place at the electrode surface. Thus, the dissolved O2 again oxidizes the reduced enzyme and increases the reduction peak current.32,33
| GOx(FADH2) + O2 → GOx(FAD) + H2O2 | (2) |
To study the effect of scan rate on the electrochemical behavior of the composite, we have carried out the CV experiments in N2 saturated PBS by varying the scan rate from 20 to 150 mV s−1 as shown in Fig. 3(c). It is observed that the redox peak current value changes linearly with the scan rates. The linear relationship of the scan rate with redox peak current value is shown in Fig. 3(d). This linear relationship indicates that the whole process is limited by the adsorption of the composite on the electrode surface and not because of diffusion.17
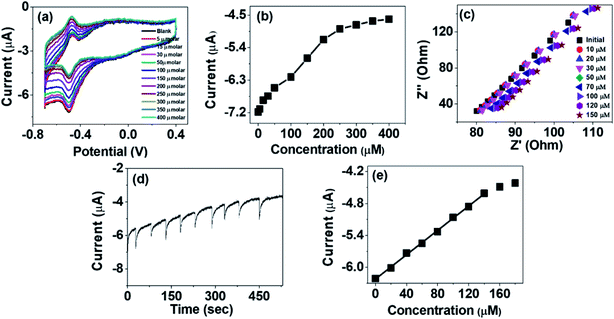
The activity of PANI–TiO2–GOx electrode for glucose sensing was studied by investigating the CVs of the electrode in N2 saturated PBS at a constant scan rate of 50 mV s−1 at different concentrations of glucose solution (5 to 400 μM). It has been observed that addition of glucose greatly affects the reduction peak current which is observed at around −0.49 V. On addition of glucose the reduction peak current decreases as shown in Fig. 4(a). It has been observed that the decrease of the peak current is linear up to a concentration of 200 μM. Beyond that concentration, the change is not linear as the active centers may get started to saturate as observed in Fig. 4(b). The decrease of the reduction peak current on addition of glucose can be explained by eqn (3)13,14,32
| GOD(FAD) + Glucose → GOD(FADH2) + Gluconolactone | (3) |
With increase in the glucose concentration, the conversion of GOD(FAD) to GOD(FADH2) increases resulting in decreasing concentration of GOD(FAD) and consequently the reduction peak current decreases. The decrease of the current can also be explained by the impedance spectra of PANI–TiO2–GOx (Fig. 4(c)) as the charge transfer resistance (RST) of the composite electrode increases on addition of glucose.
The amperometric measurement was done at a constant potential of −0.5 V by adding successive 20 μM increase in glucose concentration as shown in Fig. 4(d) and the calibration plot obtained is given in Fig. 4(e). The linear range was observed from 20 to 140 μM with a linear equation of I = 0.01142x − 6.22. The sensitivity of the biosensor was calculated to be 163.14 μA mM−1 cm−2 from the slope of the calibration plot and area of the electrode surface.13 The limit of detection (LOD) has been calculated using the eqn (4)14
 | (4) |
| Material | Preparation method | LOD | Sensitivity | Ref. |
|---|---|---|---|---|
| Carbon nanotubes modified titania nanotube arrays, fabricated with platinum nanoparticles | Vapor-growing in the inner of titania NTs | 5.7 μM | 0.24 μA mM−1 cm−2 | 9 |
| Hierarchical one-dimensional TiO2 | Solvothermal method using MWCNTs as template | 1.29 μM | 9.90 μA mM−1 cm−2 | 10 |
| Polyaniline–TiO2 nanotube | Hydrothermal and oxidative polymerization | 0.5 μM | 177.16 μA mM−1 cm−2 | 13 |
| Polyaniline/active carbon and nanometer-sized TiO2 composite | Oxidation and sol–gel method | 18 μM | 6.31 μA mM−1 cm−2 | 17 |
| GOD–PPy/TiO2 nanotube | Anodic oxidation and normal pulse voltammetry process | 1.5 μM | 187.28 μA mM−1 cm−2 | 34 |
| GOD–nanoporous TiO2 film–carbon nanotube composite | Sol–gel method followed by vapor chemical deposition of CNT | 30 μM | 8.08 μA mM−1 cm−2 | 35 |
| PANI–TiO2 composite | Vapor phase polymerization | 5.33 μM | 163.14 μA mM−1 cm−2 | Present study |
Photodegradation studies
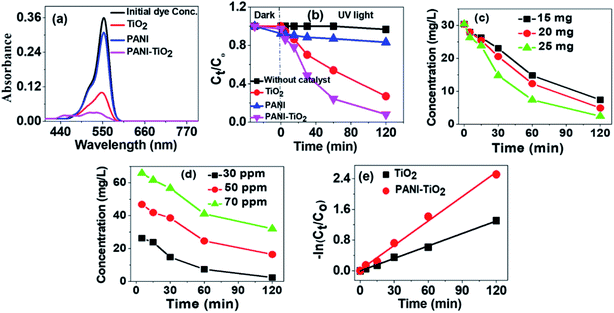
To find out the efficiency of PANI–TiO2 as photocatalyst and to compare its efficiency with polyaniline emeraldine salt (PANI) and TiO2 for degradation of RB, we have performed the degradation experiment. Fig. 5(a) shows the absorption spectra of RB before and after 2 h of degradation using TiO2, PANI and the PANI–TiO2 composite. It is observed that PANI degrades a very small amount of RB, as it is reported that due to electrostatic interaction PANI is a good adsorbent for anionic molecules only. As RB is a cationic dye, the probability of the reduction of the intensity of dye peak in UV/Vis spectra due to adsorption is negligible. TiO2 shows degradation of RB and on using PANI–TiO2 the degradation increases significantly. Thus, a small amount of PANI can effectively increase the photocatalytic ability of TiO2. The concentrations of RB at different time interval in presence of various photocatalysts were determined. In each experiment, the photocatalyst was mixed to the solution and was stirred in dark for 30 min. Then the solution was irradiated with UV light and collected samples at regular time interval. After diluting the solution, the catalyst was separated by centrifugation. The concentrations of the solutions were determined by UV/Vis spectroscopy using Beer's Lambert law. Fig. 5(b) shows the concentration profile of RB at different time intervals. The dye solutions were stirred in dark after adding the catalysts before exposing it to the light to obtain a state of equilibrium adsorption and also to see the effect of adsorption. The concentration was measured after 30 min adsorption in dark and a very small extent of adsorption has been found for TiO2 and PANI–TiO2. Thus, the decrease in concentration of RB by PANI–TiO2 is primarily due to photocatalytic degradation and not for adsorption. The degradation of dye solution without using any catalyst was also checked as control experiment.The degradation efficiency is determined by using eqn (5)36
 | (5) |
To quantify the degradation, kinetic study is important. We have fitted the experimental data of 30 ppm RB degradation by TiO2 and PANI–TiO2 in the Langmuir–Hinshelwood (L–H) kinetics model as shown in Fig. 5(e). The linear form of the L–H kinetic model is given in eqn (6).37
 | (6) |
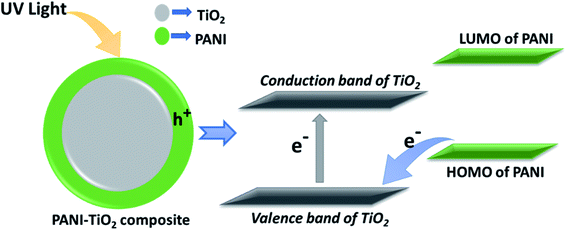
There may be several approaches to enhance the photocatalytic activity of semiconductors like TiO2. Some of such approaches are reduction of electron hole recombination, enhancement of efficiency of charge separation, reduction of particle size etc. In our study the, enhancement of photocatalytic activity of PANI–TiO2 under UV radiation is supposed to be due to the enhanced charge separation because of the synergistic effect of the composites.38 The HOMO level energy of PANI is less than the conduction band but more than the valence band energy levels of TiO2. On irradiation of UV light, electron is transferred from the valence band to the conduction band of TiO2 creating a hole in the conduction band. Electron can directly transfer from the higher energy HOMO of PANI to neutralize the conduction band hole of TiO2. This process creates a new hole in HOMO of PANI. As PANI is a good hole transporting material, the hole can easily transport to the catalyst surface to oxidize directly the adsorbed pollutant molecule. The schematic diagram of the possible mechanism is shown in Fig. 6.
Conclusion
A simple solvent free method for ultra-thin deposition of PANI on TiO2 surface by vapour phase polymerization has been demonstrated. It was observed that only around 1% PANI on TiO2 surface has significantly enhanced the property of the composites for use in glucose sensor electrodes and photocatalysis. The glucose sensor constructed by the PANI–TiO2 composite shows a linear range of glucose sensing from 20 to 140 μM. The LOD value of the PANI–TiO2 composite has been calculated to be 5.33 μM. Furthermore, the composite shows enhanced photocatalytic activity under UV light for degradation of cationic dye rhodamine B. The efficiency for the dye degradation with PANI, TiO2 and PANI–TiO2 are 16.7%, 72.9% and 91.8% respectively for a definite volume and constant initial dye concentration. This result shows the superior activity of the composite in comparison to both the parent materials. This is due to the synergistic effect of the composite materials. Thus, this article reveals the possibility of preparing polymer nanocomposites of superior surface properties by vapour phase polymerization.Experimental section
Chemicals
Titanium dioxide (TiO2), ammonium persulphate (APS), hydrochloric acid (HCl), phosphate buffer solution of pH 7.4 (PBS), glucose, glucose oxidase (GOx) and rhodamine B were bought from Merck, India and used as received. Aniline was also purchased from Merck, India and distilled before use. In all the experiments double distilled water was used.Preparation of PANI–TiO2 composite
We have used the vapor phase polymerization technique for the preparation of the PANI–TiO2 nanocomposites. At first, an APS solution was prepared by adding 2.45 g of APS in 20 mL 1 M HCl solution. Then, 100 mg TiO2 was added to the prepared APS solution and stirred for 1 h for adsorption of the oxidizing agent on the TiO2 surface. After that the APS treated TiO2 was dried in room temperature for 1 h, covered with a dry filter paper and placed in a chamber to get exposed by the aniline vapor. A low-pressure environment was maintained inside the chamber throughout the experiment by using vacuum pump. The polymerization takes place on the surface of the TiO2 and exposure of aniline vapor was continued for 24 h for complete polymerization. The resultant material was washed with distilled water and kept in desiccator for drying at room temperature.Characterization techniques
The powder X-ray diffraction (PXRD) was carried out using a Rigaku Ultima IV powder diffractometer using Cu-Kα X-radiation (λ = 1.5406 Å). The scanning electron microscopy (SEM), energy dispersive X-ray (EDX) and the elemental mapping of the materials was carried out with a Zeiss Ultra 55 model. A Mettler Toledo thermogravimetric analyser has been used to carry out the thermogravimetric analysis (TGA). UV-4100 Hitachi spectrophotometer has been used to study the diffuse-reflectance UV/Visible spectra. The transmission electron microscopy (TEM) of the composite was carried out using a field emission transmission electron microscope (FETEM) (JEOL, model: 2100F).Fabrication of glucose biosensor
For fabrication of the biosensor, at first 2 mg PANI–TiO2 composite was dispersed in 1 mL 0.5% chitosan solution prepared in 1% acetic acid and sonicated for 30 minutes. 1 mg of GOx was added to 250 μL of PBS and sonicated for well dispersion. After that 50 μL of the GOx solution was added to 50 μL of the previously prepared PANI–TiO2 dispersed solution and the mixture was sonicated for 30 min. Then, 5 μL of the resultant mixture was added on the dried surface of glassy carbon electrode (GCE) and after drying at room temperature, stored in refrigerator at 4 °C. 0.1% Nafion solution was used as binder for preparation of electrodes. All the electroanalytical experiments were carried out in a three-electrode system using N2 saturated PBS of pH 7.4 as electrolyte, Ag/AgCl electrode as reference electrode, surface modified GCE as working electrode and Pt foil as counter electrode. Cyclic voltammetry (CV) was carried out in a potential range from −0.7 V to +0.4 V taking 20 mL 0.1 M PBS solution in N2 atmosphere as electrolyte. For detection of glucose, a stock solution of 0.05 M glucose solution was prepared in a 0.1 M PBS solution of pH 7.4. Different volumes of the stock solution were added to the electrolyte to obtain the required concentration. The amperometric measurements were performed at a potential of −0.5 V.Experimental setup and photodegradation procedure
To carry out the photo-catalytic degradation study, we have used a photochemical reactor of jacketed quartz tube of length 21 cm. The inner diameter of the tube is 3.4 cm and the outer diameter is 4 cm. Mercury vapor lamp of 125 W purchased from Philips India has been used as the light source that predominantly radiated at 365 nm. After removing the outer shell of the bulb, it was placed carefully inside the quartz tube. To study the photocatalytic activity of the composite we have chosen rhodamine B (RB) as the model dye. As PANI-ES adsorbs anionic pollutants, we chose a cationic dye as a model pollutant to study the photocatalytic degradation. We have carried out the experiments using 25 mL of the dye solution using different initial concentrations (30 to 70 ppm) and photocatalyst dosages (15 to 25 mg). The solution was then stirred for 30 minutes in dark for adsorption and then irradiated with UV light for 2 h. Concentration of the RB solution was determined before and after the irradiation with UV light at different time interval by using UV/Visible spectrophotometer (UV-1800 Shimadzu model). It should be noted that each solution was 16 times diluted before recording the UV/Vis spectra.Conflicts of interest
The authors declare no competing interests.Acknowledgements
Sibani Majumdar thanks Council of Scientific and Industrial Research (CSIR), Government of India, for financial support in the form of Senior Research Fellowship (SRF). Moreover, we thank DST-SERB for financial support through EMR project (EMR/2016/005747).References
- Y. Lixia, L. Shenglian, C. Qingyun and Y. Shouzhuo, A review on TiO2 nanotube arrays: fabrication, properties, and sensing applications, Chin. Sci. Bull., 2010, 55, 331–338 CrossRef.
- E. W. Nery, M. Kundys, P. S. Jelen and M. J. Niedziolka, Electrochemical Glucose Sensing: Is There Still Room for Improvement?, Anal. Chem., 2016, 88, 11271–11282 CrossRef PubMed.
- M. Ahmad, C. Pan, Z. Luo and J. Zhu, A Single ZnO Nanofiber-Based Highly Sensitive Amperometric Glucose Biosensor, J. Phys. Chem. C, 2010, 114, 9308–9313 CrossRef CAS.
- M. A. Islam, M. A. Atia, M. Macka, B. Paull and P. Mahbub, Electrochemical Characterisation of Nanoparticulate Zirconium Dioxide-on-Gold Electrode for Electrochemical Detection in Flow-Based Analytical Systems, Electrochim. Acta, 2019, 318, 61–68 CrossRef CAS.
- D. H. Yang, N. Takahara, S. W. Lee and T. Kunitake, Fabrication of glucose sensitive TiO2 ultrathin films by molecular imprinting and selective detection of monosaccharides, Sens. Actuators, B, 2008, 130, 379–385 CrossRef CAS.
- R. Atchudan, N. Muthuchamy, T. N. J. I. Edison, S. Perumal, R. Vinodh, K. H. Park and Y. R. Lee, An Ultrasensitive Photoelectrochemical Biosensor for Glucose Based on Bio-Derived Nitrogen-Doped Carbon Sheets Wrapped Titanium Dioxide Nanoparticles, Biosens. Bioelectron., 2019, 126, 160–169 CrossRef CAS PubMed.
- S. Cosnier, A. Senillou, M. Grätzel, P. Comte, N. Vlachopoulos, N. Jaffrezic Renault and C. Martelet, A Glucose Biosensor Based on Enzyme Entrapment within Polypyrrole Films Electrodeposited on Mesoporous Titanium Dioxide, J. Electroanal. Chem., 1999, 469, 176–181 CrossRef CAS.
- J. Bai and B. Zhou, Titanium Dioxide Nanomaterials for Sensor Applications, Chem. Rev., 2014, 114, 10131–10176 CrossRef CAS PubMed.
- X. Pang, D. He, S. Luo and Q. Cai, An amperometric glucose biosensor fabricated with Pt nanoparticle-decorated carbon nanotubes/TiO2 nanotube arrays composite, Sens. Actuators, B, 2009, 137, 134–138 CrossRef.
- P. Si, S. Ding, J. Yuan, X. W. Lou and D. H. Kim, Hierarchically Structured One-Dimensional TiO2 for Protein Immobilization, Direct Electrochemistry, and Mediator-Free Glucose Sensing, ACS Nano, 2011, 5, 7617–7626 CrossRef CAS PubMed.
- Z. Wang, S. Liu, P. Wu and C. Cai, Detection of Glucose Based on Direct Electron Transfer Reaction of Glucose Oxidase Immobilized on Highly Ordered Polyaniline Nanotubes, Anal. Chem., 2009, 81, 1638–1645 CrossRef CAS PubMed.
- J. Lai, Y. Yi, P. Zhu, J. Shen, K. Wu, L. Zhang and J. Liu, Polyaniline-Based Glucose Biosensor: A Review, J. Electroanal. Chem., 2016, 782, 138–153 CrossRef CAS.
- J. Zhu, X. Liu, X. Wang, X. Huo and R. Yan, Preparation of Polyaniline–TiO2 Nanotube Composite for the Development of Electrochemical Biosensors, Sens. Actuators, B, 2015, 221, 450–457 CrossRef CAS.
- K. P. Lee, S. Komathi, N. J. Nam and A. I. Gopalan, Sulfonated Polyaniline Network Grafted Multi-Wall Carbon Nanotubes for Enzyme Immobilization, Direct Electrochemistry and Biosensing of Glucose, Microchem. J., 2010, 95, 74–79 CrossRef CAS.
- S. Shrivastava, N. Jadon and R. Jain, Next-generation Polymer Nanocomposite-Based Electrochemical Sensors and Biosensors: A Review, Trends Anal. Chem., 2016, 82, 55–67 CrossRef CAS.
- J. Zhu, X. Huo, X. Liu and H. Ju, Gold Nanoparticles Deposited Polyaniline–TiO2 Nanotube for Surface Plasmon Resonance Enhanced Photoelectrochemical Biosensing, ACS Appl. Mater. Interfaces, 2016, 8, 341–349 CrossRef CAS PubMed.
- W. Tang, L. Li and X. Zeng, A Glucose Biosensor Based on the Synergistic Action of Nanometer-Sized TiO2 and Polyaniline, Talanta, 2015, 131, 417–423 CrossRef CAS PubMed.
- R. Daghrir, P. Drogui and D. Robert, Modified TiO2 For Environmental Photocatalytic Applications: A Review, Ind. Eng. Chem. Res., 2013, 52, 3581–3599 CrossRef CAS.
- S. N. Frank and A. J. Bard, Heterogeneous Photocatalytic Oxidation of Cyanide and Sulfite in Aqueous Solutions at Semiconductor Powders, J. Phys. Chem., 1977, 81, 1484–1488 CrossRef CAS.
- A. L. Pruden and D. F. Ollis, Photoassisted Heterogeneous Catalysis: The Degradation of Trichloroethylene in Water, J. Catal., 1983, 82, 404–417 CrossRef CAS.
- R. Thiruvenkatachari, S. Vigneswaran and S. Moon, A Review on UV/TiO2 Photocatalytic Oxidation Process, Korean J. Chem. Eng., 2008, 25, 64–72 CrossRef CAS.
- U. G. Akpan and B. H. Hameed, Parameters Affecting the Photocatalytic Degradation of Dyes using TiO2-Based Photocatalysts: a review, J. Hazard. Mater., 2009, 170, 520–529 CrossRef CAS PubMed.
- J. Wei, Q. Zhang, Y. Liu, R. Xiong, C. Pan and J. Shi, Synthesis and Photocatalytic Activity of Polyaniline-TiO2 Composites with Bionic Nanopapilla Structure, J. Nanopart. Res., 2011, 13, 3157–3165 CrossRef CAS.
- K. R. Reddy, K. V. Karthik, S. B. B. Prasad, S. K. Soni, H. M. Jeong and A. V. Raghu, Enhanced Photocatalytic Activity of Nanostructured Titanium Dioxide/Polyaniline Hybrid Photocatalysts, Polyhedron, 2016, 120, 169–174 CrossRef CAS.
- V. Gilja, K. Novakovic, J. Travas-Sejdic, Z. Hrnjak-Murgic, M. Kraljic Rokovic and M. Zic, Stability and Synergistic Effect of Polyaniline/TiO2 Photocatalysts in Degradation of Azo Dye in Wastewater, Nanomaterials, 2017, 7, 412 CrossRef PubMed.
- Y. Cheng, L. An, Z. Zhao and G. Wang, Preparation of Polyaniline/TiO2 Composite Nanotubes for Photodegradation of Azo Dyes, J. Wuhan Univ. Technol., Mater. Sci. Ed., 2014, 29, 468–472 CrossRef CAS.
- K. M. Emran, S. M. Ali and A. L. Al-Oufi, The Electrocatalytic Activity of Polyaniline/TiO2 Nanocomposite for Congo Red Degradation in Aqueous Solutions, Int. J. Electrochem. Sci., 2018, 13, 5085–5095 CrossRef CAS.
- M. Srivastava, S. K. Srivastava, N. R. Niralac and R. Prakash, A Chitosan-Based Polyaniline–Au Nanocomposite Biosensor for Determination of Cholesterol, Anal. Methods, 2014, 6, 817–824 RSC.
- K. Li, H. Wang, C. Pan, J. Wei, R. Xiong and J. Shi, Enhanced Photoactivity of Fe + N Codoped Anatase-Rutile TiO2 Nanowire Film under Visible Light Irradiation, Int. J. Photoenergy, 2012, 2012, 1–8 Search PubMed.
- Y. Guo, D. He, S. Xia, X. Xie, X. Gao and Q. Zhang, Preparation of a Novel Nanocomposite of Polyaniline Core Decorated with Anatase-TiO2 Nanoparticles in Ionic Liquid/Water Microemulsion, J. Nanomater., 2012, 2012, 8 Search PubMed.
- P. Srinivasu, S. P. Singh, A. Islam and L. Han, Novel Approach for the Synthesis of Nanocrystalline Anatase Titania and Their Photovoltaic Application, Adv. OptoElectron., 2011, 2011, 1–5 CrossRef.
- Q. Xua, S. X. Gu, L. Jin, Y. Zhou, Z. Yang, W. Wang and X. Hu, Graphene/Polyaniline/Gold Nanoparticles Nanocomposite for the Direct Electron Transfer of Glucose Oxidase and Glucose Biosensing, Sens. Actuators, B, 2014, 190, 562–569 CrossRef.
- S. J. Bao, C. M. Li, J. F. Zang, X. Q. Cui, Y. Qiao and J. Guo, New Nanostructured TiO2 for Direct Electrochemistry and Glucose Sensor Applications, Adv. Funct. Mater., 2008, 18, 591–599 CrossRef CAS.
- Y. Xie and Y. Zhao, Electrochemical Biosensing Based on Polypyrrole/Titania Nanotube Hybrid, Mater. Sci. Eng., C, 2013, 33, 5028–5035 CrossRef CAS PubMed.
- H.-F. Cui, K. Zhang, Y.-F. Zhang, Y.-L. Sun, J. Wang, W.-D. Zhang and J. H. T. Luong, Immobilization of Glucose Oxidase into a Nanoporous TiO2 Film Layered on Metallophthalocyanine Modified Vertically-Aligned Carbon Nanotubes for Efficient Direct Electron Transfer, Biosens. Bioelectron., 2013, 46, 113–118 CrossRef CAS PubMed.
- D. Mahanta, U. Manna, G. Madras and S. Patil, Multilayer Self-Assembly of TiO2 Nanoparticles and Polyaniline-Grafted-Chitosan Copolymer (Cpani) for Photocatalysis, ACS Appl. Mater. Interfaces, 2010, 3, 84–92 CrossRef PubMed.
- R. Ahmad and P. K. Mondal, Adsorption and Photodegradation of Methylene Blue by Using Pani/TiO2 Nanocomposite, J. Dispersion Sci. Technol., 2012, 33, 380–386 CrossRef CAS.
- H. Zhang, R. Zong, J. Zhao and Y. Zhu, Dramatic Visible Photocatalytic Degradation Performances Due to Synergetic Effect of TiO2 with PANI, Environ. Sci. Technol., 2008, 42, 3803–3807 CrossRef CAS PubMed.
Footnote |
| † Electronic supplementary information (ESI) available. See DOI: 10.1039/d0ra01571g |
| This journal is © The Royal Society of Chemistry 2020 |

