
 Open Access Article
 This Open Access Article is licensed under a Creative Commons Attribution-Non Commercial 3.0 Unported Licence
Aerosol synthesis of TiO2:Er3+/Yb3+ submicron-sized spherical particles and upconversion optimization for application as anti-counterfeiting materials
Kyeong Youl Jung
Department of Chemical Engineering, Kongju National University, 1224-24 Cheonan-Daero, Seobuk-gu, Cheonan, Chungnam 31080, Republic of Korea. E-mail: kyjung@kongju.ac.kr
First published on 24th April 2020
Abstract
Er3+/Yb3+-doped TiO2 up-conversion (UC) phosphors were prepared by spray pyrolysis, and the UC luminescence properties were optimized by changing the calcination temperature and the concentration of Er3+ and Yb3+ dopants. TiO2:Er3+/Yb3+ showed green and red emissions due to the 2H11/2/4S3/2 → 4I15/2 transition and the 4F9/2 → 4I15/2 transition of Er3+ ions, respectively. The R/G ratio between red (R) and green (G) emissions does not change significantly with Er concentration but increases linearly with increasing Yb3+ concentration. The dependence of UC luminescence intensity on 980 nm IR pumping power showed that both the red and green UC luminescence of TiO2:Er3+/Yb3+ occurred through a typical two-photon process. In terms of achieving the highest red UC emission intensity, the optimal Er3+ and Yb3+ contents are 0.3% and 7.0%, respectively. The UC intensity of TiO2:Er3+/Yb3+ particles increases until they are calcined at temperatures up to 600 °C and then decreases rapidly above 800 °C. This is because when the calcination temperature is 800 °C and higher, not only does the phase transition of TiO2:Er3+/Yb3+ occur from anatase to rutile, but also the Yb2Ti2O7 impurity phase is formed. According to SEM and TEM/EDX analysis, the prepared TiO2:Er3+/Yb3+ UC powders have an average particle size of 680 nm, a spherical shape with a dense structure, and Er and Yb are uniformly dispersed throughout the particles without local separation. A mark prepared using TiO2:Er3+/Yb3+ powder was found to have a UC emission high enough to be visually observed when irradiated with a portable 980 nm IR lamp.
Introduction
The growth of the global economy and globalization of the market are accelerating the emergence of various functional products and devices. At the same time, the number of counterfeit products is increasing, and global companies are making great efforts to develop various anti-counterfeiting technologies.1–3 The number of counterfeit banknotes, documents and gift certificates is steadily increasing and is a national issue beyond corporate and personal infringement. In particular, the forgery of unique marks or patterns that symbolize products is becoming increasingly sophisticated to the extent that it is difficult for the naked eye to distinguish it from the original. Therefore, the development of advanced anti-counterfeiting technology, which makes it difficult to duplicate and easy to distinguish genuine products from counterfeits, is becoming more important. Security technology utilizing optical materials has the advantage of being able to quickly and visually identify replicas.4–7 Banknotes that emit certain patterns when illuminated with ultraviolet (UV) light are examples of typical luminescence-based security technology applications.8,9 Luminescence includes down-conversion (DC), which converts high energy, such as ultraviolet light, into low-energy visible light, and up-conversion (UC), which absorbs low energy, such as near infrared (NIR), to emit visible light. Therefore, the security technology using the light emitting material has the advantage that it is easy to check the security information by using a variety of excitation energy sources to visually check the various emission colors.10–12 In particular, the security technology using UC properties of rare earth doped materials can be distinguished from the existing anti-counterfeiting technology using UV-based DC materials and can be used as a new security technology.13–15Red, green and blue up-conversion can be achieved in a variety of matrixes using Er3+, Ho3+ and Tm3+ as activators and Yb3+ as deactivators.16–18 The most commonly used host material is a fluorine compound such as NaYF4.19–21 In terms of chemical stability and simplicity of synthetic conditions, an oxide matrix is preferred to a fluorine matrix. Y2O3, Gd2O3, GdVO4, CeO2, ZrO2, TiO2, etc. have been studied as oxide matrix for UC phosphors.22–27 Among them, TiO2 has many advantages; it is relatively inexpensive due to abundant reserves, semi-conductive with having excellent photochemical stability, and low toxicity to human body. As a result, TiO2 is used in various fields such as pearl pigments, sunscreen cosmetics, paints, catalysts, and solar cells.28–35 TiO2 is suitable as a UC phosphor matrix because of its low phonon energy (<700 cm−1).36 Thus, TiO2 doped with Er3+ or Er3+/Yb3+ is prepared as nanoparticles or thin films and used in solar cells and photocatalysts.37,38 Despite the many advantages of TiO2:Er/Yb with UC properties, studies on optical property optimization and application as security materials have not been carried out systematically.
Er3+/Yb3+ doped TiO2 emits green and red light. Its emission intensity and main emission color can be adjusted by controlling the Er3+/Yb3+ molar ratio. Therefore, it is necessary to optimize the dopant concentration in order to make the luminescence intensity the highest with the color suitable for the purpose. TiO2:Er3+/Yb3+ luminescence properties are affected by the synthesis method. This is because the size, shape, crystal phase, crystallinity (crystal size), distribution of dopants in the particle, etc. of the phosphor particles vary depending on the synthesis method. In order for the phosphor powder to have excellent luminescence properties, the dopant of an appropriate concentration needs to be uniformly distributed throughout the host particle, and the crystallinity of the host matrix should be high without forming an impurity phase. Therefore, it is important to develop a suitable synthesis technology for the production of TiO2-based phosphor having excellent light emission characteristics. Until recently, much of Er3+/Yb3+ doped TiO2 synthesis studies focused on the preparation of thin films or nanoparticles using the sol–gel method.39–41 Spray pyrolysis is one of the representative aerosol vapour-phase synthesis methods. In the spray pyrolysis method, since the particles can be continuously synthesized from one droplet through drying/pyrolysis, the particles produced have a spherical shape with a fine and narrow particle size distribution. When the multicomponent compound is prepared by the spray pyrolysis process, high purity single crystallinity can be obtained without separating the phases of each component. As mentioned above, the dopant components in the phosphor should be well substituted into the parent crystal lattice. Thus, spray pyrolysis has been applied to the synthesis of various phosphors with multicomponent compositions because dopants can be mixed with the parent at the molecular level.42,43 Nevertheless, to the best of our knowledge, there are no studies on the production and emission characteristics of TiO2 doped with Er3+/Yb3+ using spray pyrolysis. In this study, TiO2:Er3+/Yb3+ microspheres were prepared by spray pyrolysis. The effect of Er3+ and Yb3+ concentration on the luminescence properties was investigated and the most appropriate composition was determined in terms of luminance intensity. The effect of post-heat treatment temperature on the crystal phase and optical properties of TiO2:Er3+/Yb3+ was investigated. Finally, by evaluating the logo fabricated using powders with optimized UC luminescence, the applicability of TiO2:Er3+/Yb3+ prepared by spray pyrolysis was evaluated.
Experimental
TiO2 doped with Er3+/Yb3+ was prepared using a spray pyrolysis process. Titanium(IV) isopropoxide (TTIP, Aldrich 97%), erbium oxide (Er2O3, Aldrich 99.9%), and ytterbium nitrate (Yb (NO3)3, Alfa Aesar 99.99%) were used as Ti, Er and Yb precursors, respectively. The spray pyrolysis apparatus consisted of an ultrasonic droplet generator with 17 ultrasonic oscillators of 1.7 MHz, a quartz tube with a diameter of 1200 mm and a diameter of 55 mm, and a Teflon bag filter. Er and Yb precursors were previously dissolved with nitric acid and distilled water and used as necessary. Spray solution for preparing (Ti1−x−y, Erx, Yby)O2 powder was prepared by the following procedure. First, the necessary amounts of Er (x) and Yb (y) were taken from the previously prepared active solution and placed in a 1000 mL beaker, and distilled water was added so that the total solution volume was 500 mL. 20 mL of nitric acid was added to the solution, and TTIP was slowly added thereto and mixed quickly using a magnetic stirrer until a clear solution was obtained. Finally, distilled water was added to make the total aqueous solution 1000 mL. Total precursor concentration was fixed at 0.1 M. The prepared spray solution was converted into droplets through an ultrasonic droplet generator. The resulting droplets were injected with 30 L min−1 of air into a quartz reaction tube maintained at 900 °C. The precursor solid particles produced while passing through the reaction tube were collected using a Teflon filter mounted at the exit of the quartz tube and calcined at 500 to 1000 °C for 3 hours within a box-type electric furnace.The crystal phase change of the prepared TiO2:Er/Yb powder was observed through a diffraction pattern which was obtained using a X-ray diffractometer (XRD, Rigaku, Miniflex 600) at 2θ = 20–70° at a scan rate of 4° min−1. UC emission spectra of the samples were measured using a 980 nm IR Laser (Optoenergy, PL980P330J) as excitation source using a fluorescence spectrometer (PerkinElmer, LS 55). The output current of the IR laser was varied from 150 to 500 mA, and the resulting emission spectrum was measured at a wavelength in the range of 400 to 800 nm. The diffused reflectance spectrum was measured using UV-vis spectrophotometer (Shimadzu UV-2450). Analysis of particle shape, microstructure and composition was carried out through scanning electron microscopy (SEM) and transmission electron microscopy (TEM) analysis, supported by the Korea Basic Science Institute (KBSI).
Results and discussion
Fig. 1 shows the UC emission spectrum of TiO2:Er3+ (0.5%) and TiO2:Er3+/Yb3+ (0.5%/1%) powder. The luminescence peaks observed are due to the 2H11/2 → 4I15/2 (535 nm), 4S3/2 → 4I15/2 (555 nm), and 4F9/2 → 4I15/2 (665 nm) transitions of Er3+ active ions. When Yb3+ is co-doped compared with the case where only Er3+ is doped, UC emission intensity is significantly improved. Yb3+ has a much larger light absorption cross-section area than Er3+. Therefore, Yb3+ can more effectively absorb the incident IR light. The UC enhancement due to the co-doping means that the light energy absorbed by Yb3+ ions was effectively transferred to Er3+. Er3+/Yb3+-doped TiO2 has high emission intensity in both green and red. The red/green emission intensity depends on how energy transfer occurs from Yb3+ to Er3+, which can vary greatly depending on the concentration of Er3+ and Yb3+. Thus, TiO2:Er3+/Yb3+ UC phosphors were prepared with varying concentrations of Er3+ and Yb3+, and their UC properties were investigated. | ||
| Fig. 1 UC emission spectra of TiO2:Er3+ and TiO2:Er3+/Yb3+ particles prepared by spray pyrolysis. | ||
Fig. 2 shows UC luminescence properties of samples prepared by varying Er3+ and Yb3+ concentrations. Fig. 2(a) is UC spectra observed with increasing Er3+ content from 0.01% to 1.25% at a fixed Yb3+ (1%). Both green and red UC emissions are highest at the Er3+ concentration of 0.3% and then gradually decrease above 0.5%. The relative peak intensity between green and red emission did not change significantly by the change in Er3+ concentration. TiO2:Er3+/Yb3+ samples were prepared with increasing concentrations of Yb3+ from 1% to 8% at an Er3+ concentration of 0.3%, and their UC spectra are shown in Fig. 2(b). The red UC intensity increases greatly and steadily with increasing Yb3+ concentration up to 7%. In contrast, when the Yb3+ concentration changes, the green UC intensity does not change significantly compared to the red UC emission, and the maximum is when the Yb3+ concentration is 3%. The ratios of red to green emission intensity (R/G) are shown as a function of Er3+ concentration in Fig. 2(c) and as a function of Yb3+ concentration in Fig. 2(d). The change in the R/G ratio with the Er3+ concentration is limited between 1.0 and 1.4, while the change in the R/G ratio with the Yb3+ concentration changes linearly. These results indicate that the 4F9/2 → 4I15/2 transition of Er3+ is more accelerated in the TiO2 matrix than the 2H11/2/4S3/2 → 4I15/2 transition as the Yb3+ concentration increases. From the above results, it was concluded that the main UC emission color of TiO2:Er3+/Yb3+ phosphors was controlled by Yb3+ concentration rather than Er3+ concentration, and that the most appropriate Er3+ and Yb3+ concentrations in terms of red UC emission intensity were 0.3% and 7.0%, respectively.
 | ||
| Fig. 2 UC spectra of TiO2:Er3+/Yb3+ samples prepared at different concentrations of Er3+ (a) and Yb3+ (b). R/G ratio as a function of the content of Er3+ (c) and Yb3+ (d). | ||
Fig. 3 is a schematic diagram showing each energy level of Er3+ and Yb3+ and the UC luminescence mechanism. When only Er3+ is doped, the electrons in the ground state are excited from 4I15/2 to 4I11/2 energy levels through ground state absorption (GSA). Photo-excited electrons at the 4I11/2 energy level are consumed through two different ways. First they are directly excited to the 4F7/2 level by excited state absorption (ESA) and followed by the non-radiative decay to the 2H11/2 and 4S3/2 energy levels by multi-phonon relaxation (MPR). Thereafter, they return to the ground state 4I15/2, emitting green light. The second is that some of the photo-excited electrons at the 4I11/2 level are transferred to the 4I13/2 energy level by the MPR process, excited again to the 4F9/2 level by the ESA process, and return to the ground state with red light emission. When the activator Er3+ coexists with Yb3+, the UC luminescence mechanism depends on how energy transfer between Yb3+ and Er3+ occurs. The IR absorption capability of Yb3+ is much greater than Er3+. Also, since the Yb3+ concentration is much larger than the Er3+ concentration, most of the incident photons are absorbed by the Yb3+, resulting in a 4F7/2 → 4F5/2 transition. Photoexcited electrons at 4F5/2 of Yb3+ can transfer energy to Er3+ when returning to the ground state (4F7/2). Energy transfer from Yb3+ to Er3+ is possible in three ways, as indicated by ET1, ET2 and ET3 in Fig. 3. As shown in the experimental results (Fig. 2), the red emission intensity of TiO2:Er3+/Yb3+ increases with increasing Yb3+ concentration. This means that as the concentration of Yb3+ increases, photoelectrons are more filled in 4F9/2 of Er3+, which is an energy level capable of emitting red light. The increase of the photon concentration in the 4F9/2 energy level of Er3+ can be achieved by the energy transfer paths including (1) ET2, (2) ET3 + MPR (4F7/2 → 4F9/2), and (3) cross relaxation (CR) between two adjacent activators, 4F7/2 (Er3+) + 4I11/2 (Er3+) → 24F9/2 (Er3+).
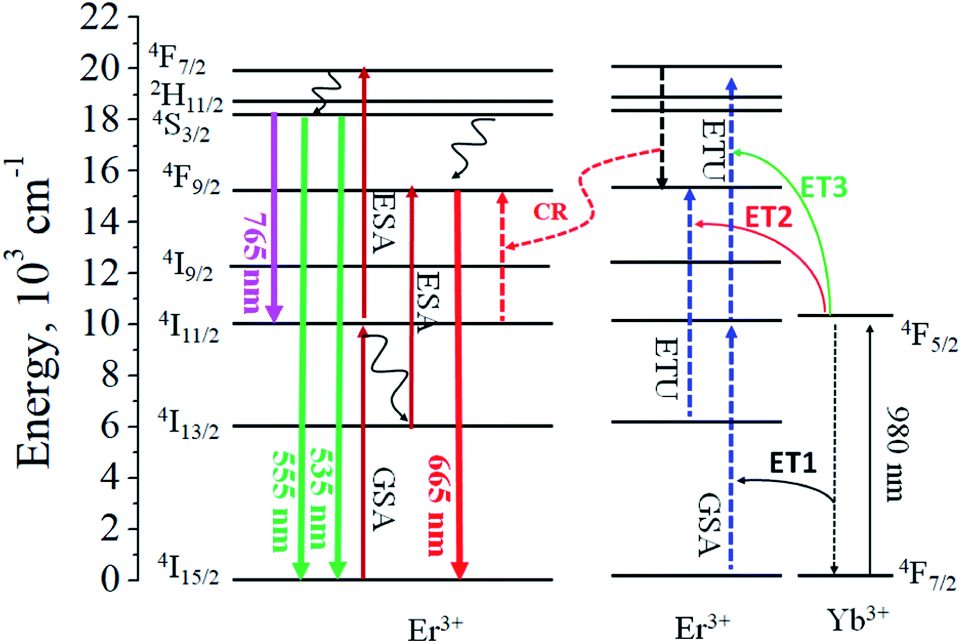 | ||
| Fig. 3 Schematic diagram showing the energy level of each Er3+ and Yb3+ ion in TiO2. | ||
The dependence of the UC emission spectrum on IR light power was evaluated to determine the number of photons involved in green or red light emission. To use UC phosphors as a security material, the higher the emission intensity, the better. Also, the R/G ratio was largely changed by the Yb3+ content. Thus, two TiO2:Er/Yb samples showing the maximum UC intensity in green (small R/G ratio) or red emission (large R/G ratio) were selected to investigate the IR power dependence. Fig. 4 shows the emission spectra observed with varying 980 nm IR power for samples with Yb3+ concentrations of 1% and 7% at the Er3+ concentrations of 0.3%. The relationship between the UC emission intensity (I) and the IR pumping power (P) is expressed by I ∝ Pn, where n is the total number of photons participating in luminescence. When ln(I) is expressed as a function of ln(P), the value of n can be found from the slope. The relationship between ln(I) and ln(P) based on the intensity of each green and red UC emission peak in the measured emission spectrum is shown in the inset of Fig. 4. For red UC emission, the n values of samples with Yb3+ concentrations of 1% and 7% are 2.10 and 2.13, respectively. For green emission, the value of n is 2.10 for 1% Yb3+ and 1.61 for 7.0%. Table 1 shows the R/G ratios and n values of TiO2:Er3+/Yb3+ phosphors with different Er3+ and Yb3+ concentrations. The n value for red light emission has a value of about 2 and there is no big change as the Yb3+ concentration increases. This result means that all red light emission is caused by two photon process regardless of Yb3+ concentration. The n value for green light emission gradually decreases from 2.10 (1%) to 1.61 (7%) with increasing Yb3+ concentration. At a fixed Yb3+ concentration (1%), the n values are close to 2.0 for both green and red UC emissions, indicating that there is no big change in the UC pathway by changing the Er3+ concentration. Referring to the previous reports on TiO2:Er3+/Yb3+ summarized in Table 1,27,44–46 the higher the Yb3+/Er3+ ratio, the higher the R/G ratio. This tendency is in good agreement with the results obtained in this work.
 | ||
| Fig. 4 Dependence of UC emission on IR pumping power for TiO2:Er3+/Yb3+ samples with different Yb3+ content, (a) 1.0% and (b) 7.0% under a fixed Er3+ content of 0.3%. | ||
| Er% | Yb% | Yb/Er ratio | R/G ratio | n value | Ref. | |
|---|---|---|---|---|---|---|
| Green | Red | |||||
| 0.05 | 1 | 20.0 | 1.3 | 1.97 | 1.92 | This work |
| 0.2 | 1 | 5.00 | 1.4 | 2.06 | 2.05 | This work |
| 0.3 | 1 | 3.33 | 1.4 | 2.13 | 2.13 | This work |
| 0.5 | 1 | 2.00 | 1.3 | 1.95 | 2.01 | This work |
| 0.3 | 3 | 10.00 | 4.3 | 1.88 | 2.17 | This work |
| 0.3 | 5 | 16.67 | 7.5 | 1.78 | 2.15 | This work |
| 0.3 | 7 | 23.33 | 12.0 | 1.61 | 2.12 | This work |
| 2 | 0 | 0 | — | 1.83 | 1.68 | 27 |
| 0.75 | 0 | 0 | 0.77 | 2.00 | 1.96 | 44 |
| 0.75 | 0.25 | 0.33 | 1.0 | 1.96 | 1.81 | 44 |
| 10 | 10 | 1.00 | 3–4 | 1.95 | 1.52 | 45 |
| 1 | 5 | 5.00 | 13 | 1.56 | 1.66 | 46 |
The minimum number of photons needed to generate visible light through absorption of 980 nm IR light is usually 2 in high efficiency UC phosphors. As shown in Table 1, the n value can be smaller than 2.0. According to Lei et al.,47 whether n = 1 or 2 is determined by the depletion mechanism of photo-excited electrons at the intermediate energy level of UC emission. If photons at the intermediate energy level are dominantly depleted due to an upconversion process, n = 1, and n = 2 if they are dominantly depleted due to a linear decay. The n value can be between 1 and 2 if upconversion and linear decay occur competitively. The intermediate energy level of green UC emission is 4I11/2. Experimental results show that when the Yb3+ concentration is low, the n values for green and red UC luminescence are close to 2 regardless of the Er3+ concentration change. This means that depletion of photons at intermediate energy levels for each emission is caused by linear decay. On the other hand, as the concentration of Yb3+ increases, energy transfer from Yb3+ to Er3+ can increase through the ET3 process (4I11/2 → 4F7/2 transition) and the cross relaxation process (4I11/2 → 4F9/2 transition). As a result, the main depletion of photons at the 4I11/2 energy level can be upconversion and n should be close to 1. However, even when the Yb3+ concentration is 7%, n = 1.61 for green emission, indicating upconversion and linear decay are competitively involved in the depletion of photons at the 4I11/2 level.
TiO2 has a phase transition from anatase to rutile as the heat treatment temperature increases. The as-prepared TiO2:Er3+/Yb3+ powder was calcined with increasing post-heat treatment temperature from 500 °C to 1000 °C, and UC luminescence properties were investigated. Fig. 5(a) shows the UC spectrum at different calcination temperatures and Fig. 5(b) shows the green and red UC intensity as a function of temperature. The red and green luminescence peaks were highest at 600 °C and sharply decreased above 800 °C. From this, the most suitable calcination temperature was determined to be 600 °C in terms of UC emission intensity. The inset of Fig. 5(b) shows the change in the R/G ratio with the change in the calcination temperature. Below 700 °C there is no significant change in R/G values. Above 800 °C, however, the R/G ratio decreased significantly. This means that the reduction in red UC emission intensity is more severe than green UC intensity at 800 °C or more.
 | ||
| Fig. 5 (a) UC emission spectra and (b) the UC intensity of green and red for TiO2:Er3+/Yb3+ particles with different calcination temperature. | ||
Fig. 6 is the XRD pattern of TiO2:Er3+/Yb3+ (0.3%/7.0%) UC powder prepared by different post-heat treatments. In order to more accurately observe the degree of anatase/rutile phase formation, the main peak of each phase of the XRD spectrum is enlarged and shown in Fig. 6(b). At the post-treatment temperature from 500 °C to 700 °C, the anatase phase was formed. At 800 °C, the peaks for rutile phase and Yb2Ti2O7 phase as well as the anatase phase were observed. When the calcination temperature was 900 °C and 1000 °C, the anatase phase disappeared completely and instead the rutile and Yb2Ti2O7 (or Er2Ti2O7) crystal phase was observed. Fig. 6(c) shows an enlarged X-ray diffraction pattern between 2θ = 20° to 35° for the sample heat-treated at 700 °C. The observed peak consists of a strong diffraction peak corresponding to the anatase phase and a weak diffraction peak corresponding to the rutile phase. This result indicates that the rutile phase is formed even when the heat treatment at 700 °C. Accordingly, the reason why the UC luminescence intensity of the sample heat-treated at 700 °C is slightly lower compared to the sample heat-treated at 600 °C is that rutile phase is formed. When the heat treatment temperature increased above 800 °C, Yb3+ was no longer substituted well in the host crystal lattice and involved in the formation of Yb2Ti2O7 crystals. This means that Yb3+ no longer serves as a sensitizer in TiO2:Er3+/Yb3+. Therefore, when the heat treatment temperature is 800 °C or more, the significant decrease in UC emission intensity is due to the formation of the Yb2Ti2O7 phase together with the rutile phase formation.
 | ||
| Fig. 6 (a) XRD pattern of TiO2:Er3+/Yb3+ UC powder prepared by different post-heat treatments. (b) Enlarged XRD patterns around the main peaks of anatase and rutile. (c) Peak deconvolution of XRD pattern for the sample calcined at 700 °C. | ||
Fig. 7(a) shows UV/visible reflectance for commercial TiO2 (anatase and rutile) and TiO2:Er3+/Yb3+ powders prepared by spray pyrolysis. The Er3+/Yb3+-doped TiO2 sample calcined at 600 °C have pure anatase as shown in Fig. 6. So, the overall reflectance spectrum of the Er3+/Yb3+-doped TiO2 sample is similar with anatase TiO2 with no dopants. Instead, unlike pure anatase TiO2, the absorption edge of the Er3+/Yb3+-doped TiO2 sample is located closer to the rutile TiO2. For the TiO2:Er3+/Yb3+ sample, three absorption peaks are observed at 489 nm, 523 nm and 654 nm. This is the result of excitation of Er3+ ions substituted into the TiO2 lattice from 4I15/2 to 4F2 (489 nm), 2H11/2 (523 nm) and 4F9/2 (654 nm) energy levels through light absorption. To determine the band gap of TiO2 and Er3+/Yb3+-doped TiO2, the diffuse reflectance (R) was treated by the modified Kubelka–Munk function, F(R) = (1 − R)2/2R. The resulting F(R) is proportional to absorption coefficient (α) and the band gap (Eg) can be estimated by the Tauc plot, [F(R)hν]n versus hν, where n = 2 for direct allowed transitions ad n = 1/2 for indirect allowed transition. TiO2 is a semiconductor with an indirect band gap. Thus, the Tauc plot of [F(R)hν]1/2 versus hν was used to determine the band gap of TiO2 or Er3+/Yb3+-doped TiO2. As shown in Fig. 7(b), the band gaps of TiO2 are 3.2 eV and 3.0 eV for anatase and rutile, respectively. TiO2:Er3+/Yb3+ with anatase phase has the band gap of about 3.15 eV. Fig. 7(c) shows the UV/visible reflectance for TiO2:Er/Yb samples calcined at different temperatures, and the band gap was calculated through the Tauc plots shown in Fig. 7(d). The band gap of TiO2:Er3+/Yb3+ is progressively reduced from 3.2 eV to 2.96 eV when the calcination temperature increases from 500 °C to 1000 °C. At 800 °C, TiO2:Er3+/Yb3+ shows two band gaps of 3.12 eV and 2.96 eV due to the coexistence of anatase and rutile. In Fig. 7(c), the absorption peak at 523 nm due to the 4I15/2 → 2H11/2 transition of Er3+ is gradually reduced as the calcination temperature increases above 800 °C. This is because Er3+ or Yb3+ ions participate in the formation of Er2Ti2O7 or Yb2Ti2O7 crystals rather than being substituted into the TiO2 lattice when the calcination temperature is over 800 °C.
 | ||
| Fig. 7 UV/Vis reflectance spectra (a and c) and Tauc plots (b and d) for TiO2:Er3+/Yb3+ (0.3%/7.0%) particles prepared by spray pyrolysis and calcined at different temperatures. | ||
Fig. 8 shows SEM/TEM images, SAED (Selected Area Electron Diffraction) pattern and element mapping results of TiO2:Er3+/Yb3+ UC powders prepared by spray pyrolysis and heat-treated at 600 °C. The prepared powder has a spherical shape. The inset of Fig. 8(a) shows the particle size distribution. The TiO2:Er3+/Yb3+ UC powders prepared have an average size of 680 nm and a narrow particle size distribution. As shown in Fig. 7(c), the TEM result that the TiO2:Er3+/Yb3+ particles prepared have a spherical shape with a dense structure. Fig. 8(d) is a SAED pattern for TiO2:Er3+/Yb3+ (0.3%/7.0%) prepared by spray pyrolysis and calcined at 600 °C. The rings observed are in good agreement with TiO2 structure. The diffraction plane of each ring is shown in the image. The strongest diffraction ring is corresponding to the (101) plane of anatase TiO2. Thus, the observed SAED pattern indicates that the TiO2:Er3+/Yb3+ particles prepared are typical nanocrystalline anatase polycrystals, which is in good agreement with the XRD results. Dopants should be well substituted in the host crystal lattice to obtain good UC luminescence. In order to confirm the distribution of the dopant in the TiO2 matrix, element mapping for Ti, Er and Yb components was performed and the results are shown in Fig. 8(e). Er and Yb ions are uniformly distributed throughout the TiO2 particle without local separation. Thus, the TiO2:Er3+/Yb3+ UC powder prepared by spray pyrolysis was found to have a dense, spherical shape, and dopants were well distributed throughout the host matrix. To see the applicability of TiO2:Er3+/Yb3+ as an emissive security material, the logo mark was prepared and the result is shown in Fig. 9. In natural light, the logo is white, a typical TiO2 color. When illuminated with 980 nm IR light, this white logo emits strong UC light that is easily visible to the naked eye. Therefore, TiO2:Er3+/Yb3+ UC powder prepared by spray pyrolysis can be successfully used as a security material.
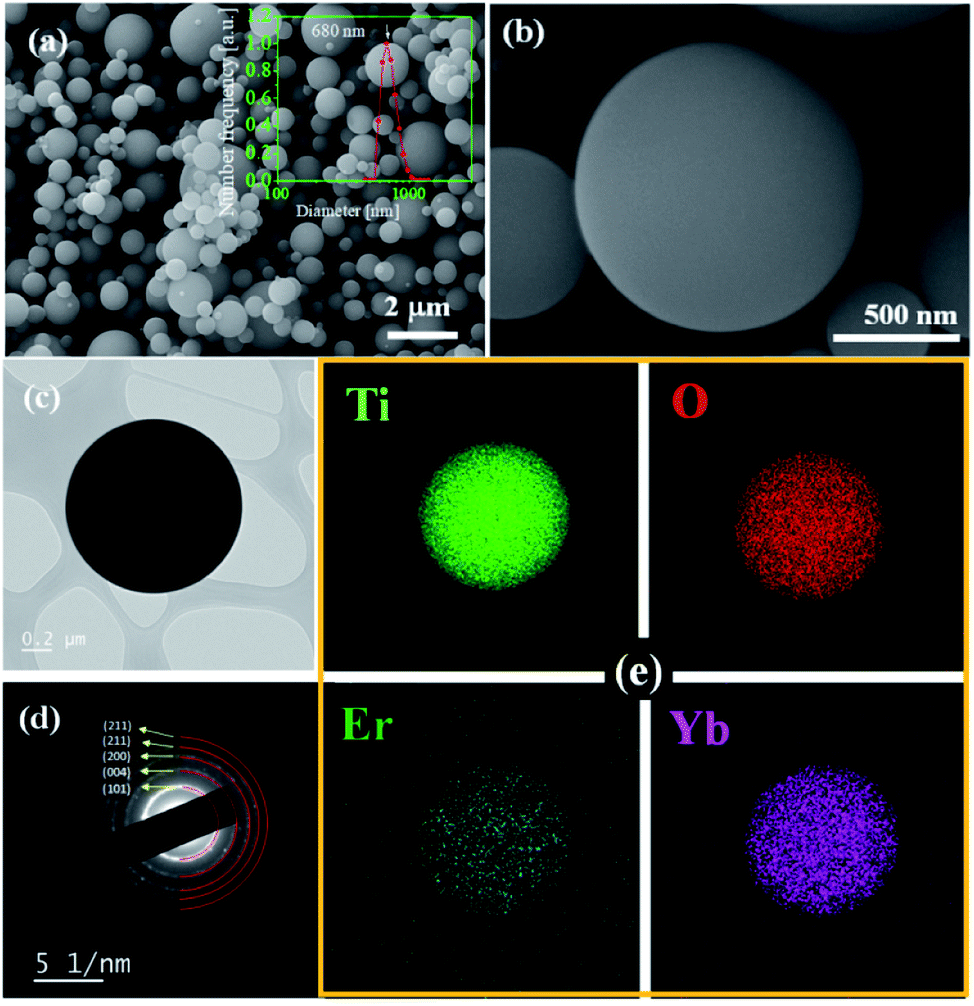 | ||
| Fig. 8 SEM images (a and b), TEM (c), SAED pattern (d), and element mapping (e) for TiO2:Er3+/Yb3+ particles prepared by spray pyrolysis. | ||
 | ||
| Fig. 9 KNU Log mark prepared using the optimized TiO2:Er3+/Yb3+ spherical particles under natural light (left) and when irradiating with a portable 980 nm IR lamp (right). | ||
Conclusions
Submicron sized TiO2:Er3+/Yb3+ spherical particles were prepared by spray pyrolysis. The upconversion (UC) characteristics of the prepared TiO2:Er3+/Yb3+ were investigated with varying calcination temperature and Er and Yb contents. The prepared TiO2:Er3+/Yb3+ showed strong green and red UC emission at low Yb3+ concentrations. However, as the Yb3+ concentration increased, red emission improved much more than green emission. As a result, the ratio of red to green emission increased linearly with increasing Yb3+ content. According to the dependence of the UC emission on the IR pumping power, the UC emission of TiO2:Er3+/Yb3+ was found to be achieved by a typical two-photon process. When TiO2:Er3+/Yb3+ particles were synthesized by spray pyrolysis, in terms of obtaining the highest red emission, the optimum Er3+ and Yb3+ contents were found to be 0.3% and 7.0%, respectively. Also, the optimum calcination temperature for obtaining the highest UC emission intensity was 600 °C. Above 700 °C, a large decrease in UC strength was observed due to the formation of the rutile phase as well as the formation of the Yb2Ti2O7 crystal phase. The prepared TiO2:Er3+/Yb3+ was a spherical particle with a dense structure and an average particle size of 680 nm. Finally, it was confirmed that submicron-sized TiO2:Er3+/Yb3+ particles with optimized UC luminescence properties by spray pyrolysis can successfully act as security materials.Conflicts of interest
There are no conflicts to declare.Acknowledgements
This research was supported by Basic Science Research Program through the National Research Foundation of Korea (NRF) funded by the Ministry of Education (grant number: 2018R1D1A3B07049692). Kyeong Youl Jung would like to give special thanks to Professor Moo-Yeal Lee of the Department of Chemical and Biomolecular Engineering at Cleveland State University for his help in conducting this research.Notes and references
- K. Jiang, L. Zhang, J. Lu, C. Xu, C. Cai and H. Lin, Angew. Chem., Int. Ed., 2016, 55, 7231–7235 CrossRef CAS PubMed.
- Y. Cui, I. Y. Phang, Y. H. Lee, M. R. Lee, Q. Zhang and X. Y. Ling, Chem. Commun., 2015, 51, 5363–5366 RSC.
- M. You, M. Lin, S. Wang, X. Wang, G. Zhang, Y. Hong, Y. Dong, G. Jin and F. Xu, Nanoscale, 2016, 8, 10096–10104 RSC.
- S. Berthier, J. Boulenguez and Z. Bálint, Appl. Phys. A, 2007, 86, 123–130 CrossRef CAS.
- I.-H. Lee, G. Li, B.-Y. Lee, S.-U. Kim, B. Lee, S.-H. Oh and S.-D. Lee, Opt. Express, 2019, 27, 24512–24523 CrossRef CAS PubMed.
- Y. Cui, R. S. Hegde, I. Y. Phang, H. K. Lee and X. Y. Ling, Nanoscale, 2014, 6, 282–288 RSC.
- P. Kumar, S. Singh and B. K. Gupta, Nanoscale, 2016, 8, 14297–14340 RSC.
- Q. Wang, J. Cai, K. Chen, X. Liu and L. Zhang, Macromol. Mater. Eng., 2016, 301, 337–382 CrossRef.
- B. Song, H. Wang, Y. Zhong, B. Chu, Y. Su and Y. He, Nanoscale, 2018, 10, 1617–1621 RSC.
- S. Xie, G. Gong, Y. Song, H. Tan, C. Zhang, N. Li, Y. Zhang, L. Xu, J. Xu and J. Zheng, Dalton Trans., 2019, 48, 6971–6983 RSC.
- X. Liu, Y. Wang, X. Li, Z. Yu, R. Deng, L. Liang, X. Xie, D. T. B. Loong, S. Song, D. Fan, A. H. All, H. Zhang, L. Huang and X. Liu, Nat. Commum., 2017, 8, 899 CrossRef PubMed.
- W. Yao, Q. Tian, J. Liu, Q. Xue, M. Li, L. Liu, Q. Lu and W. Wu, Nanoscale, 2017, 9, 15982–15989 RSC.
- H. Tan, G. Gong, S. Xie, Y. Song, C. Zhang, N. Li, D. Zhang, L. Xu, J. Xu and J. Zheng, Langmuir, 2019, 35, 11503–11511 CrossRef CAS PubMed.
- J. Xu, B. Zhang, L. Jia, Y. Fan, R. Chen, T. Zhu and B. Liu, ACS Appl. Mater. Interfaces, 2019, 11, 38 Search PubMed.
- M. Rao, J. Fu, X. Wen, B. Sun, J. Wu, X. Liu and X. Dong, New J. Chem., 2018, 42, 12353–12356 RSC.
- A. S. Gouveia-Neto, L. A. Bueno, R. F. do Nascimento, E. A. da Silva Jr and E. B. da Costa, Appl. Phys. Lett., 2007, 91, 091114 CrossRef.
- J. Yang, C. Zhang, C. Peng, C. Li, L. Wang, R. Chai and J. Lin, Chem.–Eur. J., 2009, 15, 4649–4655 CrossRef CAS PubMed.
- J. M. Meruga, A. Baride, W. Cross, J. J. Kellar and P. S. May, J. Mater. Chem. C, 2014, 2, 2221–2227 RSC.
- J.-C. Boyer, L. A. Cuccia and J. A. Capobianco, Nano Lett., 2007, 7, 847–852 CrossRef CAS PubMed.
- C. F. Gainer, G. S. Joshua, C. R. De Silva and M. Romanowski, J. Mater. Chem., 2011, 21, 18530–18533 RSC.
- E. He, J. Yu, C. Wang, Y. Jiang, X. Zuo, B. Xu, J. Wen, Y. Qin and Z. Wang, Mater. Res. Bull., 2020, 121, 110613 CrossRef CAS.
- X. Yang, M. Liu, J. Liu, Y. Xia, W. Ji, Z. Li, J. Chen, L. Liu, L. Hao, B. Dong, S. Agathopoulos and X. Xu, Phys. Chem. Chem. Phys., 2020, 22, 2819–2826 RSC.
- A. Kumar, S. P. Tiwari, K. Kumar and V. K. Rai, Spectrochim. Acta, Part A, 2016, 167, 134–141 CrossRef CAS PubMed.
- K. Y. Jung, B. Ho. Min, D. S. Kim and B.-K. Choi, Curr. Opt. Photonics, 2019, 3, 248–255 Search PubMed.
- B. H. Min and K. Y. Jung, RSC Adv., 2019, 9, 20002–20008 RSC.
- L. Liu, Y. Wang, X. Zhang, K. Yang, Y. Bai, C. Huang and Y. Song, Opt. Commun., 2011, 284, 1876–1879 CrossRef CAS.
- J. Zhang, X. Wang, W.-T. Zheng, X.-G. Kong, Y.-J. Sun and X. Wang, Mater. Lett., 2007, 61, 1658–1661 CrossRef CAS.
- Q. Gao, X. Wu, Y. Fan and X. Zhou, Dyes Pigm., 2012, 95, 534–539 CrossRef CAS.
- M. Morsella, N. d'Alessandro, A. E. Lanterna and J. C. Scaiano, ACS Omega, 2016, 1, 464–469 CrossRef CAS PubMed.
- A. Al-Kattan, A. Wichser, S. Zuin, Y. Arroyo, L. Golanski, A. Ulrich and B. Nowark, Environ. Sci. Technol., 2014, 48, 6710–6718 CrossRef CAS PubMed.
- S. P. Hong, S. Kim, N. Kim, J. Yoon and C. Kim, Korean J. Chem. Eng., 2019, 36, 1753–1766 CrossRef CAS.
- K. Y. Jung, S. B. Park and S.-K. Ihm, Appl. Catal., B, 2004, 51, 239–245 CrossRef CAS.
- J. M. Won, M. S. Kim and S. C. Hong, Korean J. Chem. Eng., 2018, 35, 2365–2378 CrossRef CAS.
- J. Choi, K. S. Yoo and J. Kim, Korean J. Chem. Eng., 2018, 35, 2481–2486 Search PubMed.
- J. Y. Oh, S. A. Song, K. Y. Jung, Y.-W. Chang, K. Kim, S. N. Lim and Y.-C. Jeong, Electrochim. Acta, 2017, 253, 390–395 CrossRef CAS.
- A. Bahtat, M. Bouazaoui, M. Bahtat and J. Mugnier, Opt. Commun., 1994, 111, 55–60 CrossRef CAS.
- X. Wang, Z. Zhang, J. Qin, W. Shi, Y. Liu, H. Gao and Y. Mao, Electrochim. Acta, 2017, 245, 839–845 CrossRef CAS.
- J. Reszczyńska, T. Grzyb, J. W. Sobczak, W. Lisowski, M. Gazda, B. Ohtani and Z. Zaleska, Appl. Catal., B, 2015, 163, 40–49 CrossRef.
- M. Jiang, C. Zhu, J. Zhou, J. Chen, Y. Gao, X. Ma and D. Yang, J. Appl. Phys., 2016, 120, 163104 CrossRef.
- B. S. Cao, Y. Y. He, Z. Q. Feng, M. Song and B. Dong, Opt. Commun., 2011, 284, 3311–3314 CrossRef CAS.
- Y. Wu, S. Lin, J. Liu, Y. Ji, J. Xu, L. Xu and K. Chen, Opt. Express, 2017, 25, 22648–22657 CrossRef CAS PubMed.
- B. H. Min and K. Y. Jung, RSC Adv., 2017, 7, 44759–44765 RSC.
- K. Y. Jung, J. C. Lee, D. S. Kim, B.-K. Choi and W.-J. Kang, J. Lumin., 2017, 192, 1313–1321 CrossRef CAS.
- W. Luo, C. Fu, R. Li, Y. Liu, H. Zhu and X. Chen, Small, 2011, 7, 3046–3056 CrossRef CAS PubMed.
- Q. Shang, H. Yu, X. Kong, H. Wang, X. Wang, Y. Sun, Y. Zhang and Q. Zeng, J. Lumin., 2008, 128, 1211–1216 CrossRef CAS.
- Z. Zhang, J. Zhang, W. Zhou, M. Song, W. Li, Q. Hu and X. Zhao, Adv. Mater. Res., 2009, 66, 1662–8985 Search PubMed.
- Y. Lei, H. Song, L. Yang, L. Yu, Z. Liu, G. Pan, X. Bai and L. Fan, J. Chem. Phys., 2005, 123, 174710 CrossRef PubMed.
| This journal is © The Royal Society of Chemistry 2020 |