 Open Access Article
Structure of bismuth tellurite and bismuth niobium tellurite glasses and Bi2Te4O11 anti-glass by high energy X-ray diffraction
Nupur Gupta a,
Atul Khanna
 *a,
Hirdesha,
Ann-Christin Dippel
 b and
Olof Gutowskib
aDepartment of Physics, Guru Nanak Dev University, Amritsar-143005, Punjab, India. E-mail: atul.phy@gndu.ac.in; Fax: +91-183-2258820; Tel: +91-183-2258802 ext. 3568
bDeutsches Elektronen-Synchrotron DESY, Notkestrasse 85, 22607 Hamburg, Germany
First published on 2nd April 2020
Abstract
Glass and anti-glass samples of bismuth tellurite (xBi2O3–(100 − x)TeO2) and bismuth niobium tellurite (xBi2O3–xNb2O5–(100 − 2x)TeO2) systems were prepared by melt-quenching. The bismuth tellurite system forms glasses at low Bi2O3 concentration of 3 to 7 mol%. At 20 mol% Bi2O3, the glass forming ability of the Bi2O3–TeO2 system decreases drastically and the anti-glass phase of monoclinic Bi2Te4O11 is produced. Structures of glass and the anti-glass Bi2Te4O11 samples were studied by high-energy X-ray diffraction, reverse Monte Carlo simulations and Rietveld Fullprof refinement. All glasses have short short-range disorder due to the existence of at least three types of Te–O bonds of lengths: 1.90, 2.25 and 2.59 Å, besides a variety of Bi–O and Nb–O bond-lengths. The medium-range order in glasses is also disturbed due to the distribution of Te–Te pair distances. The average Te–O co-ordination (NTe–O) in the glass network decreases with an increase in Bi2O3 and Nb2O5 mol% and is in the range: 4.17 to 3.56. The anti-glass Bi2Te4O11 has a long-range order of cations but it has vibrational disorder and it exhibits sharp X-ray reflections but broad vibrational bands similar to that in glasses. Anti-glass Bi2Te4O11 has an NTe–O of 2.96 and is significantly lower than in glass samples.
1. Introduction
Tellurite glasses are of great significance in the field of optics owing to their distinctive properties which marks them as outstanding materials for applications in third order harmonic generation, optical waveguides, and Raman amplifiers.1–5 TeO2 forms glass only at a high melt cooling rate (∼105 K s−1) by roller quenching6 or by intermittent cooling techniques,7 however, its glass forming ability (GFA) enhances considerably upon the addition of modifier oxides such as alkali, alkaline-earth and heavy metal oxides.6–9 The basic structural units of the tellurite glasses are trigonal bipyramidal (TeO4) and trigonal pyramidal (TeO3) units. When a modifier oxide is added into the TeO2 glass, it breaks the Te–O–Te linkages and forms trigonal (TeO3) units.The incorporation of Bi2O3 into the Te–O network enhances the non-linear optical properties of the tellurite glasses.10–13 However, bismuth tellurite system forms glass only at a low concentration of Bi2O3 (up to 7 mol%), while at higher concentration of 20 mol% Bi2O3, it forms a purely anti-glass monoclinic Bi2Te4O11 on melt quenching.14 An anti-glass is an intermediate, transient phase which has features of both the glassy and crystalline solids, in which the cations (Bi3+,Te4+, Nb5+ etc.) possess long-range order but the anions (oxygens) are highly disordered and the anion sites are partially vacant.15–17 The cationic order is responsible for producing sharp peak reflections in the X-ray and neutron diffraction patterns, while the anionic defects do not allow the phonons to propagate through them for long distances, thus resulting in the broad vibrational (phonon) bands in the Raman and infrared spectra.18,19
Bismuth tellurite glasses have been studied for their optical and structural properties13,20 but the information about the short-range and medium-range order of bismuth tellurite glass system is not available. The addition of Nb2O5 in xBi2O3–(100 − x)TeO2 system enhances its GFA and produces glass–ceramic samples that contain coexisting glass and anti-glass phases on slow melt-cooling. The database of glass short-range structural properties such as cation–oxygen bond lengths, co-ordination numbers and bond angle distributions is required for the fundamental understanding of glassy materials, making structure–property correlations, for the mathematical modeling of glass density, elastic moduli, linear and non-linear refractive indices, stress–optical properties and for machine learning.21–24
Wilding et al.25 studied the structure of binary and ternary tellurite glasses within the system: Bi2O3–Nb2O5–TeO2 by high energy X-ray diffraction. These studies revealed a glassy network consisting of interconnected TeO4 and TeO3 units correlated to the crystalline TeO2 materials but possessing larger Te⋯Te separations due to the presence of TeO3 groups and non-bridging oxygens (NBOs) that are linked to modifier (Bi3+, and Nb5+) cations. It was found that the mean Te–O coordination number for TeO2-rich compositions to be ∼3.7 (98% Bi2O3) and ∼3.8 (98% Nb2O5) signifying the presence of TeO3 and TeO4 polyhedra (dominated by TeO4) that are both corner- and edge-shared.
In the present work, the high energy X-ray diffraction (HEXRD) studies were carried out on glass, and anti-glass samples of xBi2O3–(100 − x)TeO2 and xBi2O3–xNb2O5–(100 − 2x)TeO2 systems. The diffraction data of glasses was analyzed by Reverse Monte Carlo (RMC) simulations, the latter is a powerful tool to study the short-range structural properties such as bond-lengths, bond-angles and the average coordination numbers in disordered materials.26 The use of high energy X-rays and large area detectors provides access to high values of momentum transfer function, Q with the additional advantage of smaller polarization corrections due to smaller diffraction angles (maximum used 2θ ∼40°).27
The diffraction data of the anti-glass sample: 20Bi2O3–80TeO2 (Bi2Te4O11) was analyzed by Rietveld refinement in order to obtain the detailed crystal structure information including the Te and Bi co-ordination numbers, the cation–oxygen bond lengths and the unit cell parameters.28 Short-range structures of glass and anti-glass phases of the bismuth tellurite system were also characterized by Raman spectroscopy.
2. Experimental details
2.1. Sample preparation
The samples of the following compositions were prepared:(i) xBi2O3–(100 − x)TeO2; x = 3, 5, 7 and 20 mol%.
(ii) xBi2O3–xNb2O5–(100 − 2x)TeO2; x = 5, 7.5, 10 and 12.5 mol%.
The appropriate amounts of raw materials of analytical reagent grade chemicals (Sigma Aldrich, India with purity of 99.9%) were weighed. The batch mixture was melted in a platinum crucible at a temperature of ∼850 °C. The binary bismuth tellurite samples were fabricated by the ice quenching method where the bottom of the Pt crucible containing the melt was dipped into the ice water bath immediately after taking it out of the furnace and small flakes of the glass samples were obtained. The binary bismuth tellurite system forms glass only at low Bi2O3 concentration (up to 7 mol%) however, the sample with 20 mol% Bi2O3 formed a sample consisting entirely of monoclinic Bi2Te4O11 anti-glass phase on splat-quenching of the melt.
The melt from the ternary xBi2O3–xNb2O5–(100 − 2x) TeO2 system is reported to form co-existing glass and anti-glass phases by slow melt quench technique.18 Hence for HEXRD studies on glasses, the glass melt from this system was splat quenched between the two metal plates to obtain thin flakes of the samples, so that the formation of anti-glass phase was avoided and purely glassy phase samples were obtained. All the samples were clear, transparent and their amorphous nature was confirmed by the laboratory source X-ray diffraction measurements performed on Bruker D8 Focus X-ray diffractometer using Cu Kα1,2 radiation.
Raman spectroscopy studies were performed on Renishaw inVia Reflex micro-Raman spectrometer using 514.5 nm argon ion laser.
2.2. Density measurements
The density, ρ of the bismuth tellurite glass samples could not be measured experimentally due to their very small sizes and it was therefore calculated with the following empirical relationships given by Inaba et. al. for oxide glasses:24
 | (1) |
 | (2) |
NA is the Avogadro number, rM and rO are the ionic radii of cations and the oxygens in the oxide, AXOY.
Density of bismuth niobium tellurite samples were measured experimentally by Archimedes' principle using di-butyl phthalate as the immersion fluid.29 The density measurements were performed three times on each sample and the maximum uncertainty in its value was ±0.002 g cm−3. The sample codes, their composition, density and the atomic number density values for all the samples have are given in Table 1.
| Sample code | Composition (mol%) | Density (g cm−3) (±0.001) | Number density (Å−3) | ||
|---|---|---|---|---|---|
| Bi2O3 | Nb2O5 | TeO2 | |||
| 3BiTe | 3 | — | 97 | 6.001 | 0.0655 |
| 5BiTe | 5 | — | 95 | 6.122 | 0.0653 |
| 7BiTe | 7 | — | 93 | 6.191 | 0.0646 |
| 20BiTe | 20 | — | 80 | 6.894 | 0.0639 |
| 5Bi5NbTe | 5 | 5 | 90 | 5.807 | 0.0640 |
| 7.5Bi7.5NbTe | 7.5 | 7.5 | 85 | 5.921 | 0.0645 |
| 10Bi10NbTe | 10 | 10 | 80 | 5.995 | 0.0646 |
| 12.5Bi12.5NbTe | 12.5 | 12.5 | 75 | 6.083 | 0.0650 |
2.3. High energy X-ray diffraction
The high-energy X-ray diffraction studies were performed on bismuth tellurite glasses, bismuth niobium tellurite glasses and one bismuth tellurite anti-glass sample at High Energy Material Science beamline (P07) at PETRA III DESY photon science facility in Hamburg, Germany30 using the wavelength of 0.126321 Å.A double crystal monochromator consisting of two Si (111) Laue crystals was used to monochromatize the radiations obtained from the X-ray source (undulator). The scattered X-ray intensities were measured by a 2D PerkinElmer detector (model XRD1621) where the sample to detector distance was 388.2 mm. The raw intensity data were corrected for background, Compton scattering and polarization using PDFGetX2 package31 and the structure factor, S(Q) was obtained up to the ‘Q’ value of ∼20 Å−1, where ‘Q’ refers to the momentum transfer given by Q = 4π![[thin space (1/6-em)]](https://www.rsc.org/images/entities/char_2009.gif) sin
sin![[thin space (1/6-em)]](https://www.rsc.org/images/entities/char_2009.gif) θ/λ, ‘θ’ being one half of the diffraction angle and ‘λ’ is the wavelength of X-rays. S(Q) is defined below as:32,33
θ/λ, ‘θ’ being one half of the diffraction angle and ‘λ’ is the wavelength of X-rays. S(Q) is defined below as:32,33
 | (3) |
 and WF(Q) is given as
  with cα representing the concentration of element, α, and fα is the atomic form factor of the element, α.34 The X-ray scattering form factors depend upon Q, and the weight factors of different atomic pairs values (Wij) were calculated using the formula:
 | (4) |
| Atomic pair | 3BiTe | 5BiTe | 7BiTe |
|---|---|---|---|
| Bi–Bi | 0.584 | 1.51 | 2.76 |
| Bi–Te | 11.75 | 17.87 | 22.83 |
| Bi–O | 2.351 | 3.69 | 4.86 |
| Te–Te | 59.22 | 52.85 | 47.26 |
| Te–O | 23.72 | 21.82 | 20.13 |
| O–O | 2.37 | 2.52 | 2.14 |
| Atomic pair | 5Bi5NbTe | 7.5Bi7.5NbTe | 10Bi10NbTe | 12.5Bi12.5NbTe |
|---|---|---|---|---|
| Bi–Bi | 1.42 | 2.86 | 4.56 | 6.45 |
| Bi–Nb | 1.35 | 2.72 | 4.35 | 6.14 |
| Bi–Te | 15.90 | 20.14 | 22.72 | 24.05 |
| Bi–O | 3.71 | 5.21 | 6.51 | 7.67 |
| Nb–Nb | 0.32 | 0.64 | 1.04 | 1.46 |
| Nb–Te | 7.58 | 9.60 | 10.83 | 11.47 |
| Nb–O | 1.77 | 2.48 | 3.11 | 3.66 |
| Te–Te | 44.61 | 35.53 | 28.29 | 22.47 |
| Te–O | 20.87 | 18.40 | 16.24 | 14.34 |
| O–O | 2.44 | 2.38 | 2.33 | 2.29 |
In this whole process, the background data was subtracted from the raw data and other corrections were applied to obtain the coherent scattering intensity (Ic), since, the latter contains the information about the atomic structure of the sample. The Fourier-transformation was applied to the S(Q) data to obtain the reduced pair distribution function, G(r), given by:35
 | (5) |
2.4. Reverse Monte Carlo (RMC) simulations
RMC simulation is a useful technique to produce the structural models of disordered materials such as glasses using the diffraction data. In the present work, the experimentally measured X-ray structure factors (S(Q)) for bismuth tellurite and niobium bismuth tellurite glasses were simulated using the RMC++ software and partial atomic pair correlation functions, co-ordination numbers, and distribution of bond-lengths and bond angles were determined.26,36–39 RMC uses a three-dimensional atomic configuration to fit the experimental S(Q) data with the calculated S(Q) and tends to minimize the squared difference between the two S(Q) by the random movement of the atoms in the simulation box.32,40As a starting model for each RMC simulation, a random atomic configuration with a simulation box containing a total of 10![[thin space (1/6-em)]](https://www.rsc.org/images/entities/char_2009.gif) 000 atoms of Bi, Te, and O for bismuth tellurite system, and 10
000 atoms of Bi, Te, and O for bismuth tellurite system, and 10![[thin space (1/6-em)]](https://www.rsc.org/images/entities/char_2009.gif) 000 atoms of Bi, Nb, Te, and O for niobium bismuth tellurite glass system was built using the density data given in Table 1. The half-box length values calculated using the number density values in the RMC++ program for all the samples are also given in Table 4.
000 atoms of Bi, Nb, Te, and O for niobium bismuth tellurite glass system was built using the density data given in Table 1. The half-box length values calculated using the number density values in the RMC++ program for all the samples are also given in Table 4.
| Sample code | Number density (Å−3) | Half-box length Å |
|---|---|---|
| 3BiTe | 0.0655 | 26.72 |
| 5BiTe | 0.0653 | 26.74 |
| 7BiTe | 0.0646 | 26.83 |
| 5Bi5NbTe | 0.0640 | 26.92 |
| 7.5Bi7.5NbTe | 0.0645 | 26.85 |
| 10Bi10NbTe | 0.0646 | 26.83 |
| 12.5Bi12.5NbTe | 0.0650 | 26.78 |
As a part of the simulation, the inter-atomic distances for each atomic pair correlation was used as a constraint to fit the model with the experimental X-ray structure factor, S(Q). For the three-component bismuth tellurite system, the six atomic pair correlations are Bi–Bi, Bi–Te, Bi–O, Te–Te, Te–O, and O–O, while the bismuth niobium tellurite samples contains a total of ten atomic pair correlation functions (gij(r)) that includes the above mentioned six and additional four correlations i.e. Bi–Nb, Nb–Nb, Nb–Te, and Nb–O.
The built configuration was modified by randomly moving the atoms and varying the interatomic distances slightly, until the calculated and the experimental S(Q) coincided with each other perfectly and a consistent result for each partial pair correlation function gij(r) and Te–O coordination number (NTe–O) was obtained. The simulation results were stable and reproducible, and the broad bands in the diffraction patterns represent the short and medium-range structural features in the glasses. The cut-off distances of various correlations used in the final RMC runs for bismuth tellurite and bismuth niobium tellurite glasses are given in Tables 5 and 6
| Atomic pair | Sample code | ||
|---|---|---|---|
| 3BiTe (Å) | 5BiTe (Å) | 7BiTe (Å) | |
| Bi–Bi | 3.65 | 3.65 | 3.65 |
| Bi–Te | 3.00 | 3.00 | 3.00 |
| Bi–O | 1.82 | 1.84 | 1.84 |
| Te–Te | 2.80 | 2.88 | 2.95 |
| Te–O | 1.67 | 1.67 | 1.67 |
| O–O | 2.32 | 2.32 | 2.32 |
| Atomic pair | Sample code | |||
|---|---|---|---|---|
| 5Bi5NbTe (Å) | 7.5Bi7.5NbTe (Å) | 10Bi10NbTe (Å) | 12.5Bi12.5NbTe (Å) | |
| Bi–Bi | 3.45 | 3.45 | 3.45 | 3.45 |
| Bi–Nb | 3.30 | 3.30 | 3.30 | 3.30 |
| Bi–Te | 3.00 | 3.00 | 3.00 | 3.00 |
| Bi–O | 1.82 | 1.79 | 1.82 | 1.82 |
| Nb–Nb | 3.60 | 3.60 | 3.40 | 3.40 |
| Nb–Te | 3.00 | 3.20 | 2.90 | 2.90 |
| Nb–O | 1.69 | 1.69 | 1.72 | 1.72 |
| Te–Te | 2.80 | 2.75 | 2.80 | 2.75 |
| Te–O | 1.67 | 1.67 | 1.69 | 1.69 |
| O–O | 2.32 | 2.32 | 2.32 | 2.32 |
2.5. Rietveld refinement
Rietveld data analysis was performed on the HEXRD data of Bi2Te4O11 anti-glass by using the Fullprof program package using the pseudo-Voigt function to model the peak profile shape. The background contribution was determined using a linear interpolation between selected data points. The initial approximation for the lattice parameters as well as structural coordinates for defining the peak shape in the powder diffraction experiment were taken from the literature.41 The scale factor, profile shape parameters, lattice parameters, fractional coordinates of atoms, site occupations, and their displacement parameters were varied during the fitting. Once a perfect fit is obtained, and the least square value (χ2) is minimized, the values of bond lengths, bond angles, and the coordination number of cations with oxygen were calculated using Visualization for Electronic Structural Analysis (VESTA) software.423. Results and discussion
3.1. Density
The density of bismuth tellurite glasses increases from 6.001 to 6.894 g cm−3 with increase in Bi2O3 concentration from 3 to 7 mol%. The increase in the density can be attributed to the higher molecular weight of Bi2O3 molecules (465.96 u) as compared to the molecular weight of TeO2 (159.60 u) which is being replaced. The incorporation of Nb2O5 (265.81 u) also enhances the glass density from 5.807 to 6.083 g cm−3 (sample code 5Bi5NbTe) due to significantly higher molecular weight of Bi2O3 and Nb2O5, both of which replace the lighter TeO2 molecules.3.2. RMC analysis of HEXRD data
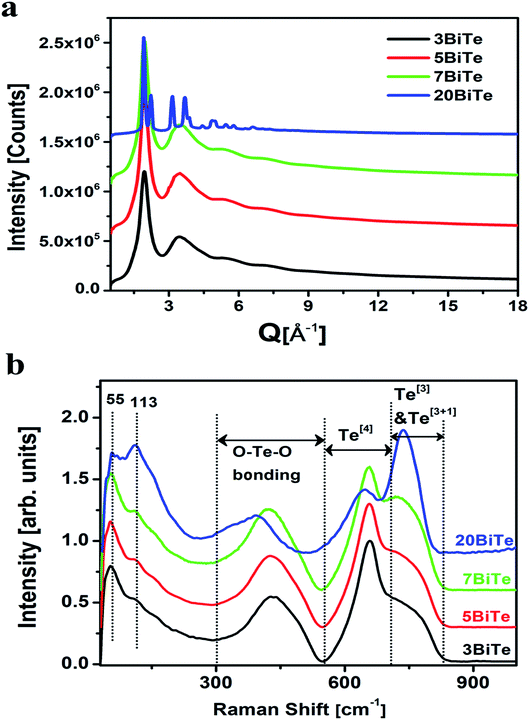
The XRD patterns of all the bismuth tellurite and bismuth niobium tellurite glass samples show broad humps due to their amorphous nature. However, the XRD pattern of one bismuth tellurite sample containing 20 mol% Bi2O3 (sample code: 20BiTe) shows sharp reflections corresponding to the monoclinic Bi2Te4O11 anti-glass phase (Fig. 1a). On the other hand, despite the sharp X-ray diffraction peaks, the Raman spectra (Fig. 1b) shows broad bands for the bismuth tellurite sample containing 20 mol% Bi2O3. The striking difference in the Raman and X-ray diffraction patterns confirms the anti-glass nature of the bismuth tellurite sample containing 20 mol% Bi2O3 (Fig. 1a). The scattered X-ray intensity, I vs. Q data for bismuth tellurite and bismuth niobium tellurite glass and anti-glass samples is shown in Fig. 1a and 2.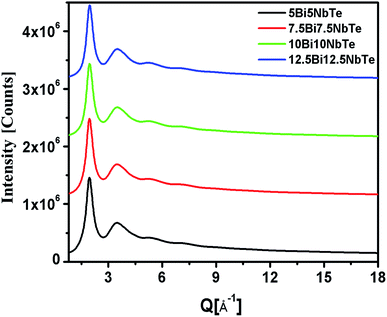 | ||
| Fig. 2 High-energy X-ray diffraction patterns for bismuth niobium tellurite glasses. The curves are shifted by 1 × 10⁶ units for clarity. | ||
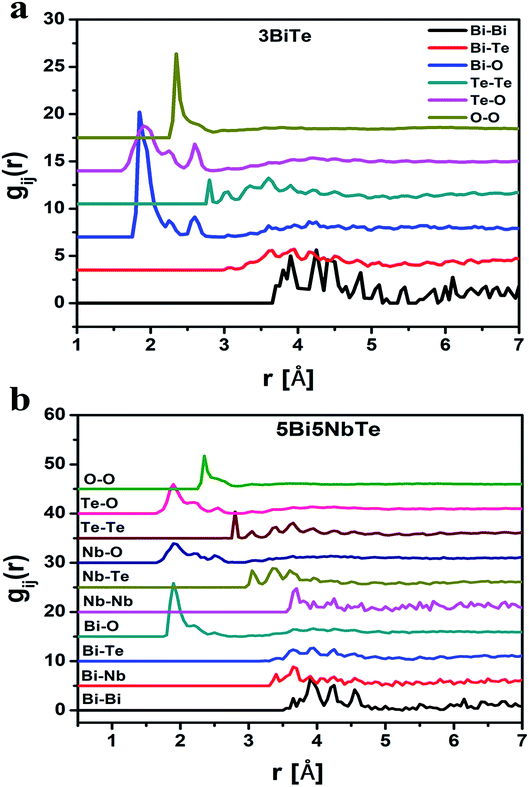
The RMC calculated structure factors S(Q), matched well with the experimental ones for all the glass samples and the fitted curves are shown in Fig. 3a and b for bismuth tellurite and bismuth niobium tellurite glasses respectively. The reduced pair correlation functions, G(r) were calculated by the Fourier transformation of S(Q) data. G(r) distributions for the bismuth tellurite and bismuth niobium tellurite samples are shown in Fig. 4a and b respectively. The intensity of the first peak at 1.90 Å decreases steadily with an increase in modifier oxide concentration (Bi2O3 and Nb2O5 mol%), this is because the first peak at 1.90 A is mainly due to Te–O equatorial bonds and the weight factors of these correlations decrease with an increase in Bi2O3 and Nb2O5 concentration in both the glass series. According to the earlier reports, the peaks due to Bi–O and Bi–Bi correlations lie at: 2–3 Å and ∼4 Å respectively. Since G(r) gives the weighted sum of all the atomic pair correlations, it is difficult to de-convolute the multiple overlapping peaks and get accurate information about bond-lengths and co-ordination numbers, therefore, the partial atomic pair correlation functions were determined by the RMC technique.
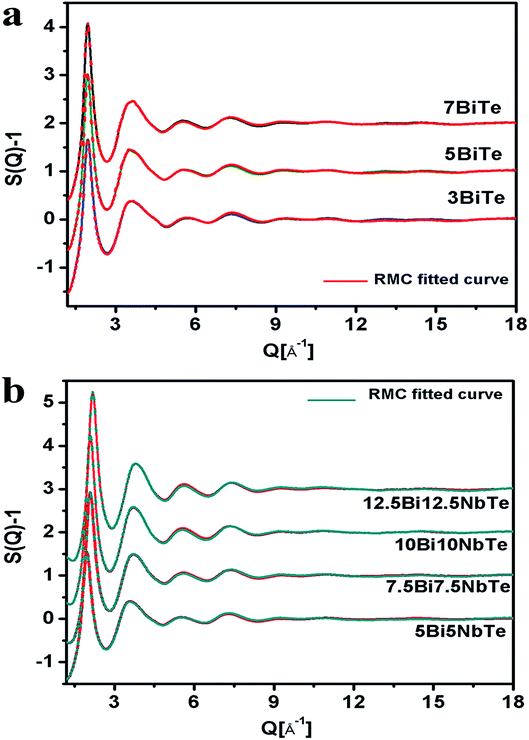 | ||
| Fig. 3 Experimental and RMC fitted X-ray structure factors for (a) bismuth tellurite (b) bismuth niobium tellurite glasses (successive curves have been shifted by 1 unit for clarity). | ||
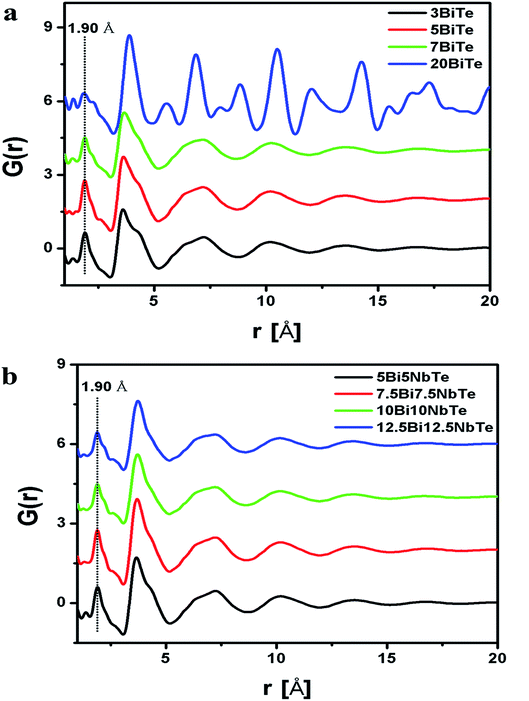 | ||
| Fig. 4 Reduced pair correlation function, G(r) for (a) bismuth tellurite (b) bismuth niobium tellurite samples. | ||
The RMC method generates the partial atomic pair correlation functions, gij(r) which provide structural information such as the nearest neighbor distances, bond angles and the co-ordination numbers. Fig. 5a and b give the partial pair distribution functions for various correlations in bismuth tellurite sample containing 3 mol% of Bi2O3 and bismuth niobium tellurite sample containing 5 mol% Nb2O5 and 5 mol% of Bi2O3. The partial atomic pair distribution functions for Te–O correlations (gTe–O(r)) in bismuth tellurite glasses and bismuth niobium tellurite glasses are shown separately in Fig. 6a and b. It is found that Te–O linkages have a distribution of bond lengths and there exist at least three types of Te–O bonds of lengths of 1.90, 2.25 and 2.55 Å in glasses. The findings from the structural study of TeO2 glass by Barney et al.6 matches well with our results. Further the high-Q neutron and X-ray diffraction study by Hoppe et al.43 on short-range order in ZnO–TeO2 and Nb2O5–TeO2 glasses reported the Te–O bond length to be 1.90 Å, these earlier authors did not calculate the partial atomic pair correlation functions and were unable to resolve the axial and equatorial Te–O bonds in the glass network, which has been accomplished in the present study.
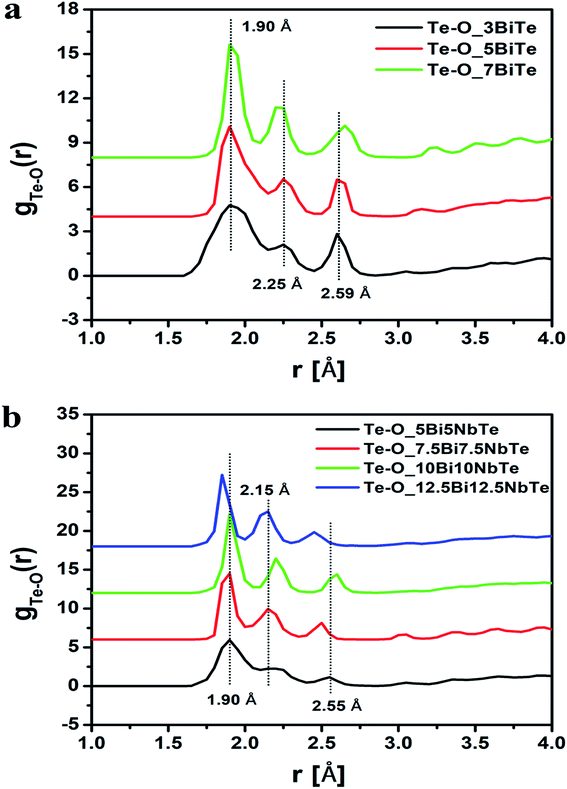 | ||
| Fig. 6 (a) Te–O pair correlation functions in bismuth tellurite glasses and (b) in bismuth niobium tellurite glasses. The successive curves have been displaced by 3 units for clarity. | ||
Theoretical predictions44 of the short-range structural properties of tellurite glasses have revealed the existence of the wide distribution of Te–O bond lengths: two longer axial bonds in the range: 2.05 to 2.25 Å, and the two shorter equatorial Te–O bonds lengths at 1.85–1.95 Å. Therefore the second peak in the Te–O partial pair correlation function (gTe–O(r)) is due to the longer Te–O axial bonds (Fig. 6a and b). The structural study of alkali tellurite glasses by X-ray diffraction brings forth the existence of highly asymmetrical Te–O pair distribution function.6,8,45,46 Another peak in Te–O correlations has been observed in the range 2.5–2.6 Å, which reveals the presence of longer but more weakly bonded Te–O linkages, similar to the ones in crystalline γ-TeO.47
The structural interpretation of bismuth borate glasses had earlier suggested that most of the bismuth-containing compositions contain two types of Bi–O bonds at ∼1.9 Å and 2.5 Å.48 However, Stone et al.49 reported the existence of Bi–O bonds at 1.95 Å and 2.37 Å. The pair correlation function for Bi–O shows the existence of three peaks centered at 1.90 Å, 2.20 Å, and 2.59 Å. According to Dimitriev et al.,50 the first maxima for Bi–O correlation in the bismuthate glasses appears around ∼2.2–2.4 Å. Watanabe et al.51 also reported the Bi–O bond length to be in the range: 2 to 3 Å. The findings of the present study are therefore in agreement with the earlier studies.
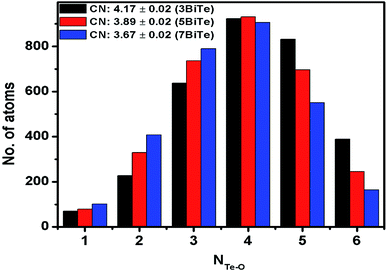
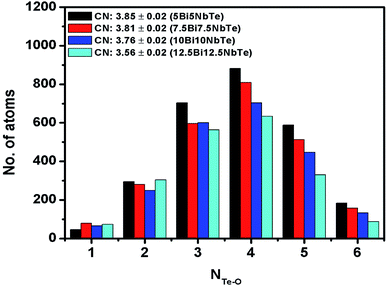
The rmin and rmax values from the gTe–O(r) plots were used to calculate the co-ordination number of tellurium with oxygens (NTe–O) in glass samples. The rmin and rmax values for Te–O bonds and the calculated coordination number are given in Table 7. The average value of NTe–O in bismuth tellurite glass series decreases from 4.17 to 3.67 upon increasing the Bi2O3 concentration from 3 to 7 mol%. In bismuth niobium tellurite glasses, the NTe–O decreases from 3.85 to 3.56 upon increasing the Bi2O3 and Nb2O5 content from 5 to 12.5 mol%. It may be noted that the area under the third peak is not taken into account while calculating the NTe–O values, therefore the rmax is taken only up to the point where the second Te–O peak tails off, since it is reported that rmax for the first Te–O co-ordination shell ends at 2.36 Å.45,52
| Sample code | Te–O | NTe–O | |
|---|---|---|---|
| rmin (Å) | rmax (Å) | ||
| 3BiTe | 1.60 | 2.45 | 4.17 |
| 5BiTe | 1.65 | 2.46 | 3.89 |
| 7BiTe | 1.66 | 2.40 | 3.67 |
| 5Bi5NbTe | 1.60 | 2.40 | 3.85 |
| 7.5Bi7.5NbTe | 1.67 | 2.35 | 3.81 |
| 10Bi10NbTe | 1.65 | 2.39 | 3.76 |
| 12.5Bi12.5NbTe | 1.65 | 2.30 | 3.56 |
Raman studies on various tellurite glasses show that, the NTe–O decreases with an increase in the concentration of modifier oxides due to the transformation of trigonal bipyramidal units (TeO4) into trigonal pyramidal (TeO3) units.6,14,53–56 The structural interpretation of alkali-tellurite glasses by neutron diffraction, X-ray diffraction, and RMC simulations found the transformation of TeO4 into TeO3 units takes place via the formation of TeO3+1 polyhedra as the intermediate structural unit: TeO4 → TeO3+1 → TeO4.57 The distribution of Te–O co-ordinations in bismuth tellurite glasses and bismuth niobium tellurite glasses as found by RMC simulations is presented in Fig. 7 and 8 respectively. The bar graphs represent the variation of the average coordination number for tellurium with oxygens and reveal an increase in trigonal tellurite units accompanied by a decrease in tetrahedral tellurite units. The bar graphs also suggests the presence of small amounts of penta and hexa-tellurite units which decrease with increase in the modifier oxide concentration in both, bismuth tellurite and bismuth niobium tellurite glasses. An estimate of Bi–O speciation shows a decrease in the Bi–O coordination number from 5.64 to 4.62 with increase in Bi2O3 content.
The bond angles O–Te–O, O–O–O and Te–O–Te were calculated from the RMC results using the rmax value of partial pair correlation functions. The bond angle distribution for Te–O–Te, O–Te–O and O–O–O linkages for bismuth tellurite glasses are presented in Fig. 9(a–c), while the plots for bond angle distributions in bismuth niobium tellurite glasses are shown in Fig. 10(a–c). The bond angle distribution for O–Te–O linkages in tellurite glasses generally show two peaks, one in the range 150–170° due to Oax–Te–Oax axial linkages, while the other one in the range: 70–105° is due to the Oeq–Te–Oeq and Oeq–Te–Oax linkages.44 In bismuth tellurite and bismuth niobium tellurite glasses, the O–Te–O maxima occurs at the lower angle of ∼72–74° which reveals that the major part of the glass network consists of Oeq–Te–Oeq and Oeq–Te–Oax bonds in TeO3 and TeO4 structural units containing bridging, non-bridging and terminal oxygens. The absence of the peaks in the higher angle ranges confirms the presence of a very small concentration of axial (Oax–Te–Oax) linkages.
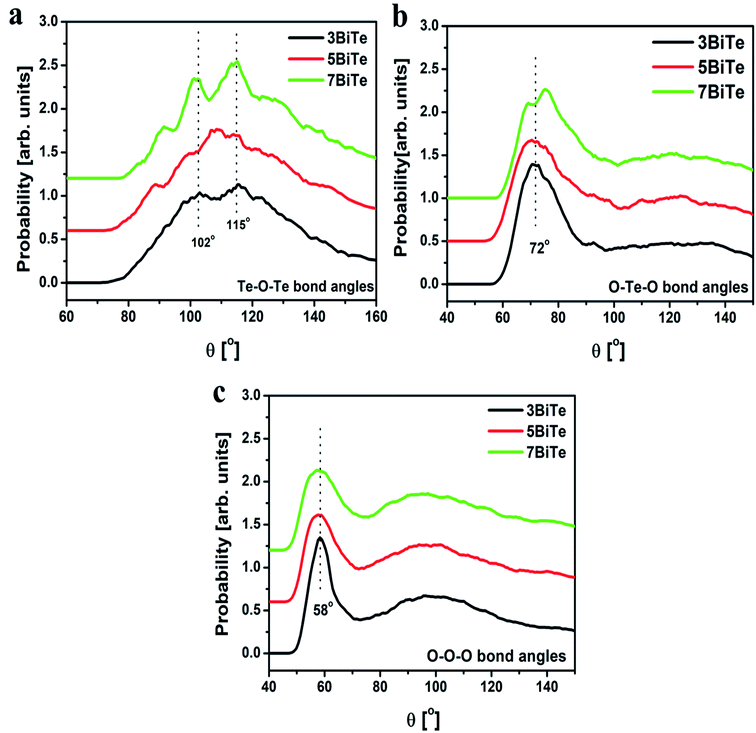 | ||
| Fig. 9 Bond angle distributions for (a) Te–O–Te, (b) O–Te–O and (c) O–O–O linkages in three bismuth tellurite glasses. Successive curves have been shifted by 0.6 units for clarity. | ||
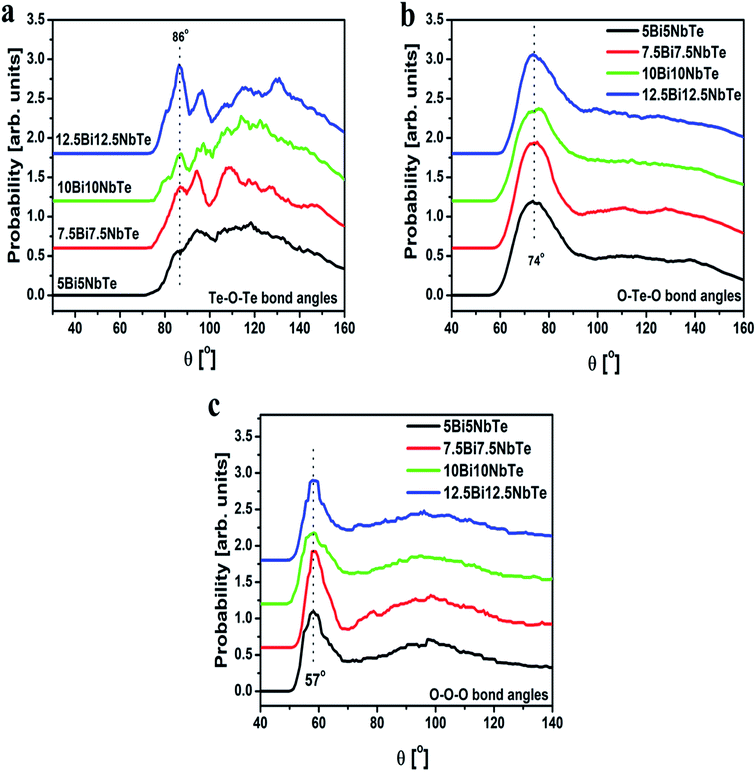 | ||
| Fig. 10 Bond angle distributions for (a) Te–O–Te, (b) O–Te–O and (c) O–O–O linkages in four bismuth niobium tellurite glasses. Successive curves have been shifted by 0.6 units for clarity. | ||
Te–O–Te bond angle distribution represents the connectivity between the TeO3 and TeO4 units and the intermediate range order in glass. The Te–O–Te bond angles in the bismuth tellurite glasses consists of peaks at 102° and 115° while a new peak at 88° emerges with an increase in the modifier oxide concentration. On the other hand, a wider distribution of Te–O–Te bond angles is observed in bismuth niobium tellurite glasses in the range: 86–130°.
3.3. Rietveld refinement results on anti-glass Bi2Te4O11
The HEXRD pattern for bismuth tellurite sample containing 20 mol% Bi2O3 (sample 20BiTe) show sharp peaks characteristic of crystalline material, however its vibrational spectra (Raman patterns) reveal the presence of broad phonon bands that are the characteristic feature of disordered/amorphous materials. Trömel et al.17 referred these materials as the ‘anti-glass’ where order and disorder co-exists. Masson et al.41 suggest these materials as an intermediate state between a glass and crystalline phase containing disturbed short-range order while the arrangement of cations is ordered and indicate the process of crystallization. It is reported that the structure of disordered anti-glass Bi2Te4O11 is comprised of a sequence of two layers of cations. Layer one contains only the tellurite units with TeO3 and TeO4 units forming long sinusoidal chains, similar to the ones present in paratellurite α-TeO2.58 The second layer is a composite layer containing both the bismuth and the tellurium atoms in equal number.The XRD pattern recorded for 20BiTe is shown in Fig. 1a. All the peaks can be indexed to P121/n1 space group of monoclinic symmetry. The diffraction pattern exhibits significant extra broadening on top of the instrumental resolution which indicates that the long-range order in this sample is also not well defined. This suggests that the sample is not crystalline but an ‘anti-glass’ of monoclinic Bi2Te4O11 (powder diffraction file #81-1330).18
The HEXRD data of 20Bi2O3–80TeO2 anti-glass sample was refined by Rietveld method using FULLPROF program. The refined XRD pattern of 20BiTe sample is shown in Fig. 11 and the position co-ordinates of constituents atoms namely Bi, Te, and O are given in Table 8. The values of cell parameters obtained after refinement were a = 6.89 Å, b = 7.97 Å, and c = 19.65 Å, and α = γ = 90° with β = 91.26°.
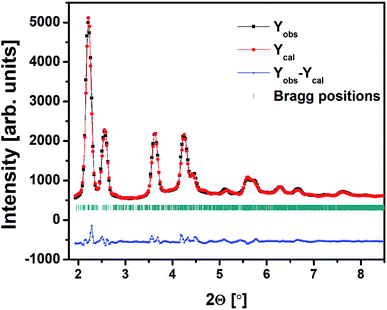 | ||
| Fig. 11 Rietveld fit of the high-energy XRD data for bismuth tellurite sample containing 20 mol% Bi2O3. | ||
| Atom | x | y | z |
|---|---|---|---|
| Bi1 | 0.587 ± 0.023 | 0.120 ± 0.003 | 0.420 ± 0.012 |
| Bi2 | 0.570 ± 0.006 | 0.111 ± 0.002 | 0.913 ± 0.006 |
| Te1 | 0.277 ± 0.010 | 0.160 ± 0.018 | 0.241 ± 0.005 |
| Te2 | 0.914 ± 0.009 | 0.119 ± 0.006 | 0.574 ± 0.005 |
| Te3 | 0.242 ± 0.008 | 0.090 ± 0.002 | 0.755 ± 0.004 |
| Te4 | 0.893 ± 0.008 | 0.139 ± 0.011 | 0.071 ± 0.002 |
| O1 | 0.941 ± 0.004 | 0.170 ± 0.021 | 0.478 ± 0.010 |
| O2 | 0.921 ± 0.139 | 0.172 ± 0.002 | 0.971 ± 0.029 |
| O3 | 0.270 ± 0.044 | 0.159 ± 0.013 | 0.585 ± 0.013 |
| O4 | 0.275 ± 0.033 | 0.145 ± 0.031 | 0.345 ± 0.054 |
| O5 | 0.562 ± 0.051 | 0.025 ± 0.051 | 0.764 ± 0.002 |
| O6 | 0.954 ± 0.040 | 0.153 ± 0.011 | 0.751 ± 0.004 |
| O7 | 0.644 ± 0.049 | 0.071 ± 0.005 | 0.541 ± 0.015 |
| O8 | 0.348 ± 0.085 | 0.169 ± 0.031 | 0.107 ± 0.026 |
| O9 | 0.671 ± 0.023 | 0.020 ± 0.230 | 0.036 ± 0.005 |
| O10 | 0.802 ± 0.077 | 0.104 ± 0.005 | 0.190 ± 0.054 |
| O11 | 0.310 ± 0.014 | 0.223 ± 0.065 | 0.835 ± 0.023 |
The other structural parameters such as bond lengths, cation coordination number, and bond angles for 20BiTe anti-glass sample were calculated from the VESTA program.42 Fig. 12 shows Bi2Te4O11 unit cell obtained from the refinement of HEXRD data. As discussed by Masson et al.41 the unit cell clearly shows the structure comprised of two cation-oxygen layers, where one layer contains only tellurite units while the other contains both Te and Bi ions. Since the unit cell structure comprises two layers of Te–O units, the mean value of Te–O coordination, NTe–O in this sample was calculated from both the layers with VESTA program. The average NTe–O value in Bi2Te4O11 anti-glass sample is 2.96 and its value is significantly lower than the value of NTe–O in bismuth tellurite glasses, this result is also confirmed from Raman studies (Fig. 1b) in which the intensity of the Raman band at ∼660 cm−1 is significantly suppressed as compared to the intensity of Raman band at ∼770 cm−1 and is due to the structural transformation: TeO4 → TeO3 that takes place with increase in Bi2O3 concentration from 3 to 20 mol%. Since the sample 20BiTe has highest Bi2O3 concentration (20 mol%), it has the smallest NTe–O. A lower value of NTe–O in this sample also indicates the presence of oxygen vacancies; the latter is a characteristic feature of anti-glass materials. The Te–O bond length in the anti-glass 20BiTe sample is in the range: 1.939–2.046 Å, nBi–O bond lengths are in the range; 2.372–2.392 Å and the mean Bi–O coordination, NBi–O is 4.17.
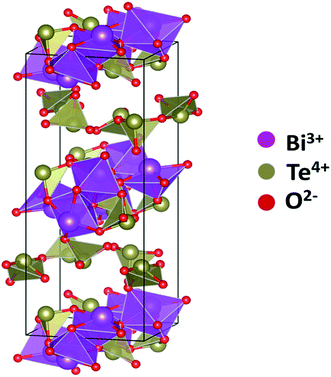 | ||
| Fig. 12 Unit cell of monoclinic anti-glass Bi2Te4O11 showing Bi (purple), tellurium (grey) and oxygen (red) ions. | ||
The angle distribution of O–Te–O bonds in the anti-glass sample depends upon the internal angles of inter and intra polyhedral TeO3 and TeO4 structural units. Among TeO3 units the angles lies in the range ∼90° to 103° while in the case of TeO4 units, the angle Oax–Te–Oax was estimated to be ∼178°, the latter O–Te–O bond angle linkages were absent in the bismuth tellurite glasses, while the Oeq–Te–Oax bond angle was found to be 92°. The Te–O–Te bond angle was found to be ∼144°, equivalent to the one found in α-TeO2.59 The bond lengths were found to be Te–Oeq as 1.85 Å while the Te–Oax is 2.03 Å. Moreover, no bond length greater than 2.4 Å was observed in this anti-glass sample unlike the bismuth tellurite glasses.
4. Conclusion
High-energy X-ray diffraction (HEXRD) studies on series of bismuth tellurite and bismuth niobium tellurite glasses and one anti-glass sample were carried out. Bismuth tellurite system forms glass only at a low concentration of Bi2O3 (up to 7 mol%), while at higher Bi2O3 (20 mol%) it forms purely anti-glass phase of the monoclinic Bi2Te4O11 by more rapid splat-quenching. Owing to the latter's anti-glass nature, the diffraction pattern show sharp Bragg peaks whereas glasses show broad humps that are typical of an amorphous material. The RMC analysis of HEXRD data confirms that the nearest neighbor distance of Te–O and Bi–O are in the range of 1.85–1.90 Å and Te–O bonds have a distribution of bond lengths.Te–O coordination number, NTe–O decreases from 4.17 ± 0.02 to 3.67 ± 0.02 on increasing Bi2O3 concentration from 3 to 7 mol% in xBi2O3–(100 − x)TeO2 system which further decreases to 3.56 ± 0.02 upon incorporating Nb2O5 in the bismuth tellurite system. The sample of composition, 20Bi2O3–80TeO2 forms an anti-glass phase of disordered monoclinic Bi2Te4O11 and shows sharp reflections in HEXRD. Structural refinement was carried out by FullProf Rietveld analysis and the unit cell parameters were determined. The mean value of Te–O coordination in 20BiTe anti-glass sample was calculated to be 2.96 ± 0.02 and is lower than that of glasses of xBi2O3–(100 − x)TeO2 system.
Conflicts of interest
There are no conflicts to declare.Acknowledgements
Portions of this research were carried at the light source PETRA III of DESY a member of Helmholtz Association (HGF). Financial support by Department of Science and Technology (Government of India) provided within the framework of the India @DESY collaboration is gratefully acknowledged. Atul Khanna thanks UGC-DAE-Consortium for Scientific Research, Mumbai and Department of Science and Technology, New Delhi, India for research grants.References
- S. Suehara, P. Thomas, A. Mirgorodsky, T. Merle-Méjean, J. Champarnaud-Mesjard, T. Aizawa, S. Hishita, S. Todoroki, T. Konishi and S. Inoue, Localized hyperpolarizability approach to the origin of nonlinear optical properties in TeO2-based materials, Phys. Rev. B: Condens. Matter Mater. Phys., 2004, 70, 205121 CrossRef.
- V. Rivera and D. Manzani, Technological Advances in Tellurite Glasses, Springer, 2017 Search PubMed.
- D. Zhou, R. Wang, Z. Yang, Z. Song, Z. Yin and J. Qiu, Spectroscopic properties of Tm3+-doped TeO2-R2O-La2O3 glasses for 1.47 μm optical amplifiers, J. Non-Cryst. Solids, 2011, 357, 2409–2412 CrossRef.
- S. Manning, in A study of tellurite glasses for electro-optic optical fibre devices, University of Adelaide, Adelaide, Australia, 2011 Search PubMed.
- I. Bányász, S. Berneschi, M. Bettinelli, M. Brenci, M. Fried, N. Khanh, T. Lohner, G. N. Conti, S. Pelli and P. Petrik, MeV Energy N+-Implanted Planar Optical Waveguides in Er-Doped Tungsten-Tellurite Glass Operating at 1.55 mm, IEEE Photonics J., 2012, 4, 721–727 Search PubMed.
- E. R. Barney, A. C. Hannon, D. Holland, N. Umesaki, M. Tatsumisago, R. G. Orman and S. Feller, Terminal oxygens in amorphous TeO2, J. Phys. Chem. Lett., 2013, 4, 2312–2316 CrossRef.
- N. Tagiara, D. Palles, E. Simandiras, V. Psycharis, A. Kyritsis and E. Kamitsos, Synthesis, thermal and structural properties of pure TeO2 glass and zinc-tellurite glasses, J. Non-Cryst. Solids, 2017, 457, 116–125 CrossRef.
- A. Gulenko, O. Masson, A. Berghout, D. Hamani and P. Thomas, Atomistic simulations of TeO2-based glasses: interatomic potentials and molecular dynamics, Phys. Chem. Chem. Phys., 2014, 16, 14150–14160 RSC.
- R. A. El-Mallawany, Tellurite glasses handbook: Physical Properties and Data, CRC press, Boca Raton, 2016 Search PubMed.
- T. Hasegawa, T. Nagashima and N. Sugimoto, Determination of nonlinear coefficient and group-velocity-dispersion of bismuth-based high nonlinear optical fiber by four-wave-mixing, Opt. Commun., 2008, 281, 782–787 CrossRef.
- H. Ebendorff-Heidepriem, P. Petropoulos, V. Finazzi, K. Frampton, R. Moore, D. Richardson and T. Monro, Highly nonlinear bismuth-oxide-based glass holey fiber, in Optical Fiber Communication Conference, Optical Society of America, 2004, pp. ThA4 Search PubMed.
- K. Kikuchi and K. Taira, Highly nonlinear bismuth oxide-based glass fibres for all-optical signal processing, Electron. Lett., 2002, 38, 166–167 CrossRef.
- J. He, H. Zhan and A. Lin, Solid-core bismuth–tellurite glass fiber with low propagation loss and high nonlinearity, Mater. Res. Bull., 2019, 110619 Search PubMed.
- A. Kaur, A. Khanna, H. Bhatt, M. Gónzález-Barriuso, F. González, B. Chen and M. Deo, B-O and Te-O speciation in bismuth tellurite and bismuth borotellurite glasses by FTIR, 11B MAS-NMR and Raman spectroscopy, J. Non-Cryst. Solids, 2017, 470, 19–26 CrossRef.
- M. Trömel, E. Münch, G. Blasse and G. Dirksen, Formation and luminescence of lower symmetrical tellurite anti-glass phases, J. Solid State Chem., 1988, 76, 345–354 CrossRef.
- A. Bertrand, J. Carreaud, G. l. Delaizir, M. Shimoda, J.-R. Duclére, M. Colas, M. Belleil, J. Cornette, T. Hayakawa and C. c. Genevois, New Transparent Glass-Ceramics Based on the Crystallization of “Anti-glass” Spherulites in the Bi2O3–Nb2O5–TeO2 System, Cryst. Growth Des., 2015, 15, 5086–5096 CrossRef.
- M. Trömel, W. Hützler and E. Münch, Anti-glass phases and other lanthanide tellurates with fluorite-related structures, J. Less Common Met., 1985, 110, 421–424 CrossRef.
- N. Gupta and A. Khanna, Glass and anti-glass phase co-existence and structural transitions in bismuth tellurite and bismuth niobium tellurite systems, J. Non-Cryst. Solids, 2018, 481, 594–603 CrossRef CAS.
- R. Kaur, A. Khanna, M. González-Barriuso, F. González and B. Chen, Structural, optical and thermal properties of glass and anti-glass phases in strontium tellurite and borotellurite systems doped with europium, Mater. Res. Bull., 2018, 106, 288–295 CrossRef CAS.
- S. Baki, L. Tan, C. Kan, M. K. Halimah and M. Mahdi, Structural and Optical Characteristics of Erbium Doped Ternary TeO2-TiO2-Bi2O3 Glasses, in Solid State Phenomena, Trans Tech Publ, 2017, pp. 148–154 Search PubMed.
- A. Kaur, A. Khanna and M. Fábián, Short-range structure of barium tellurite glasses and its correlation with stress-optic response, Mater. Res. Express, 2018, 5, 065203 CrossRef.
- J. D. Musgraves, J. Hu and L. Calvez, Springer Handbook of Glass, Springer, 2019 Search PubMed.
- R. Limbach, A. Winterstein-Beckmann, J. Dellith, D. Möncke and L. Wondraczek, Plasticity, crack initiation and defect resistance in alkali-borosilicate glasses: from normal to anomalous behavior, J. Non-Cryst. Solids, 2015, 417, 15–27 CrossRef.
- S. Inaba and S. Fujino, Empirical equation for calculating the density of oxide glasses, J. Am. Ceram. Soc., 2010, 93, 217–220 CrossRef CAS.
- M. C. Wilding, G. Delaizir, C. J. Benmore, Y. Gueguen, M. Dolhen, J.-R. Duclère, S. Chenu, S. Sukenaga and P. F. McMillan, Structural studies of Bi2O3-Nb2O5-TeO2 glasses, J. Non-Cryst. Solids, 2016, 451, 68–76 CrossRef CAS.
- M. Fábián and C. Araczki, Basic network structure of SiO2–B2O3–Na2O glasses from diffraction and reverse Monte Carlo simulation, Phys. Scr., 2016, 91, 054004 CrossRef.
- H. Poulsen, J. Neuefeind, H.-B. Neumann, J. Schneider and M. Zeidler, Amorphous silica studied by high energy X-ray diffraction, J. Non-Cryst. Solids, 1995, 188, 63–74 CrossRef CAS.
- N. Sahu and S. Panigrahi, Mathematical aspects of Rietveld refinement and crystal structure studies on PbTiO3 ceramics, Bull. Mater. Sci., 2011, 34, 1495–1500 CrossRef CAS.
- N. Gupta, A. Kaur, A. Khanna, F. Gonzàlez, C. Pesquera, R. Iordanova and B. Chen, Structure-property correlations in TiO2-Bi2O3-B2O3-TeO2 glasses, J. Non-Cryst. Solids, 2017, 470, 168–177 CrossRef CAS.
- N. Schell, A. King, F. Beckmann, T. Fischer, M. Müller and A. Schreyer, The high energy materials science beamline (HEMS) at PETRA III, in Materials Science Forum, Trans Tech Publ, 2014, pp. 57–61 Search PubMed.
- X. Qiu, J. W. Thompson and S. J. L. Billinge, PDFgetX2: a GUI-driven program to obtain the pair distribution function from X-ray powder diffraction data, J. Appl. Crystallogr., 2004, 37, 678 CrossRef CAS.
- H. E. Fischer, A. C. Barnes and P. S. Salmon, Neutron and x-ray diffraction studies of liquids and glasses, Rep. Prog. Phys., 2005, 69, 233 CrossRef.
- L. B. Skinner, C. J. Benmore and J. B. Parise, Area detector corrections for high quality synchrotron X-ray structure factor measurements, Nucl. Instrum. Methods Phys. Res., Sect. A, 2012, 662, 61–70 CrossRef.
- J. H. Hubbell and L. Overbro, Relativistic atomic form factors and photon coherent scattering cross sections, J. Phys. Chem. Ref. Data, 1979, 8, 69–106 CrossRef.
- B. Toby and T. Egami, Accuracy of pair distribution function analysis applied to crystalline and non-crystalline materials, Acta Crystallogr., Sect. A: Found. Crystallogr., 1992, 48, 336–346 CrossRef.
- R. L. McGreevy and L. Pusztai, Reverse Monte Carlo Simulation: A New Technique for the Determination of Disordered Structures, Mol. Simul., 1988, 1, 359–367 CrossRef.
- G. Evrard and L. Pusztai, Reverse Monte Carlo modelling of the structure of disordered materials with RMC++: a new implementation of the algorithm in C++, J. Phys.: Condens. Matter, 2005, 17, S1 CrossRef CAS.
- M. Fabian, E. Svab and K. Krezhov, Network structure with mixed bond-angle linkages in MoO3–ZnO–B2O3 glasses: neutron diffraction and reverse Monte Carlo modelling, J. Non-Cryst. Solids, 2016, 433, 6–13 CrossRef CAS.
- O. Gereben, P. Jóvári, L. Temleitner and L. Pusztai, A new version of the RMC++ Reverse Monte Carlo programme, aimed at investigating the structure of covalent glasses, J. Optoelectron. Adv. Mater., 2007, 9, 3021–3027 CAS.
- P. A. Egelstaff, 14 Classical Fluids, in Methods in Experimental Physics, Elsevier, 1987, pp. 405–470 Search PubMed.
- O. Masson, P. Thomas, O. Durand, T. Hansen, J. Champarnaud and D. Mercurio, On the structure of the disordered Bi2Te4O11 phase, J. Solid State Chem., 2004, 177, 2168–2176 CrossRef CAS.
- K. Momma and F. Izumi, VESTA 3 for three-dimensional visualization of crystal, volumetric and morphology data, J. Appl. Crystallogr., 2011, 44, 1272–1276 CrossRef CAS.
- U. Hoppe, E. Yousef, C. Rüssel, J. Neuefeind and A. Hannon, Structure of zinc and niobium tellurite glasses by neutron and x-ray diffraction, J. Phys.: Condens. Matter, 2004, 16, 1645 CrossRef CAS.
- F. Pietrucci, S. Caravati and M. Bernasconi, TeO2 glass properties from first principles, Phys. Rev. B: Condens. Matter Mater. Phys., 2008, 78, 064203 CrossRef.
- V. Kozhukharov, S. Neov, I. Gerasimova and P. Mikula, Neutron diffraction investigation of a tellurite-tungstate glass, J. Mater. Sci., 1986, 21, 1707–1714 CrossRef CAS.
- J. McLaughlin, S. Tagg, J. Zwanziger, D. Haeffner and S. Shastri, The structure of tellurite glass: a combined NMR, neutron diffraction, and X-ray diffraction study, J. Non-Cryst. Solids, 2000, 274, 1–8 CrossRef CAS.
- J. Champarnaud-Mesjard, S. Blanchandin, P. Thomas, A. Mirgorodsky, T. Merle-Mejean and B. Frit, Crystal structure, Raman spectrum and lattice dynamics of a new metastable form of tellurium dioxide: γ-TeO2, J. Phys. Chem. Solid., 2000, 61, 1499–1507 CrossRef CAS.
- A. C. Wright, S. A. Feller and A. C. Hannon, Borate glasses, crystals & melts, Society of Glass Technology, 1997 Search PubMed.
- C. Stone, A. Wright, R. Sinclair, S. Feller, M. Affatigato, D. Hogan, N. Nelson, C. Vira, Y. Dimitriev and E. Gattef, Structure of bismuth borate glasses, Phys. Chem. Glasses, 2000, 41, 409–412 Search PubMed.
- Y. Dimitriev, A. Wright, V. Mihailova, E. Gattef and C. Guy, An X-ray diffraction study of bismuthate glasses, J. Mater. Sci. Lett., 1995, 14, 347–350 CrossRef.
- T. Watanabe, T. Nanba and Y. Miura, X-ray and neutron scattering study of the structure of lithium bismuth oxide glass, J. Non-Cryst. Solids, 2002, 297, 73–83 CrossRef.
- A. Khanna, M. Fábián, P. Krishna, C. J. Benmore, A. Kaur, A. Kaur, A. Shinde, P. Rajput and S. Jha, Structural analysis of WO3-TeO2 glasses by neutron, high energy X-ray diffraction, reverse Monte Carlo simulations and XANES, J. Non-Cryst. Solids, 2018, 495, 27–34 CrossRef.
- A. G. Kalampounias, Low-frequency Raman scattering in alkali tellurite glasses, Bull. Mater. Sci., 2008, 31, 781–785 CrossRef.
- A. Kaur, A. Khanna, V. G. Sathe, F. Gonzalez and B. Ortiz, Optical, thermal, and structural properties of Nb2O5–TeO2 and WO3–TeO2 glasses, Phase Transitions, 2013, 86, 598–619 CrossRef.
- T. Sekiya, N. Mochida and A. Ohtsuka, Raman spectra of MO-TeO2 (M= Mg, Sr, Ba and Zn) glasses, J. Non-Cryst. Solids, 1994, 168, 106–114 CrossRef.
- M. R. Zaki, D. Hamani, M. Dutreilh-Colas, J.-R. Duclère, O. Masson and P. Thomas, Synthesis, thermal, structural and linear optical properties of new glasses within the TeO2-TiO2-WO3 system, J. Non-Cryst. Solids, 2018, 484, 139–148 CrossRef.
- H. Munemura, K. Mitome, M. Misawa and K. Maruyama, Network structure of M2O–TeO2 (M= Li, Na, Li0. 62Na0.38) glasses, J. Non-Cryst. Solids, 2001, 293, 700–704 CrossRef.
- P. Thomas, The crystal structure and absolute optical chirality of paratellurite, α-TeO2, J. Phys. C: Solid State Phys., 1988, 21, 4611 CrossRef.
- E. Barney, A. Hannon and D. Holland, Short-range order and dynamics in crystalline α-TeO2, J. Phys. Chem. C, 2012, 116, 3707–3718 CrossRef.
| This journal is © The Royal Society of Chemistry 2020 |

