 Open Access Article
Reasons for enhanced activity of doxorubicin on co-delivery with octa(3-aminopropyl)silsesquioxane†
Kinga Piorecka *,
Jan Kurjata,
Irena Bak-Sypien
 ,
Marek Cypryk
 ,
Urszula Steinke and
Wlodzimierz A. Stanczyk
Centre of Molecular and Macromolecular Studies, Polish Academy of Sciences, Sienkiewicza 112, 90-363 Lodz, Poland. E-mail: kgradzin@cbmm.lodz.pl; Tel: +48-42-6803-203
First published on 21st April 2020
Abstract
This paper presents results of spectroscopic (NMR, FTIR, fluorescence), Q-TOF mass spectrometry and Z-potential analyses of interactions between octa(3-aminopropyl)silsesquioxane hydrochloride (POSS-NH2·HCl) and anticancer drug – doxorubicin hydrochloride. These studies aimed at explanation of the enhanced activity of doxorubicin on co-delivery with POSS-NH2. The results point to the formation of active complexes via ionic interactions between the ammonium chloride groups of silsesquioxane and the drug, and not, as suggested earlier, via NH⋯N hydrogen bonding. It has also been shown that the main driving force for the formation of the complexes can be strengthened by π–π stacking and hydrogen bonds. The experimental results are supported by quantum mechanical calculations. This work has proven that co-delivery with POSS offers a potentially advantageous and simple approach for improved efficacy in chemotherapy, avoiding often complicated synthesis of conjugates, involving covalent bonding between drug, nanocarrier and targeting agents.
Introduction
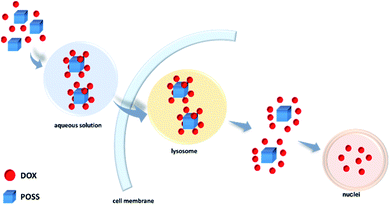
The anthracycline antibiotic doxorubicin (DOX) is an anti-cancer drug that is highly effective in the clinical treatment of a wide variety of tumours. Currently proposed mechanisms of its action include intercalation with the DNA helix, disrupting gene expression and leading to cancer cell death.1–3 However, administration of doxorubicin can be limited by the occurrence of undesirable side effects such as cardiotoxicity and inherent drug resistance. Drug delivery nano-systems offer important approach that can improve antitumour activity, decreasing at the same time toxicity of doxorubicin. Prodrugs, conjugated or complexed with nanocarriers (1–100 nm) can easily overcome the barriers constituted by biological membranes. Such the systems improve selective distribution of the active drug, increase time of its activity and thus, can lead to dose reduction.4 It is worth to underline that during the last 5–7 years almost 200 research papers have been published, devoted to studies of novel anthracycline (mainly doxorubicin) nanoconjugates5 and nanocomplexes.6 Many anthracycline nanocarriers such as graphene oxide, poly(lactide-co-glycolide), polyamidoamine dendrimers (PAMAM) and fatty acids have been described so far.7,8 For some time now we have been studying polyhedral oligosilsesquioxanes (POSS)9 as anthracycline nanocarriers that are often referred to as the next generation of materials for biomedical applications.10 Important features of POSS derivatives are their biocompatibility, biodegradability, nanometer size and lack of toxicity (the product of their metabolism is orthosilicic acid).11–15 In the course of our studies on synthesis of novel POSS–DOX covalent conjugates,16 we turned our attention to the observation that simple co-delivery of POSS and DOX led to unexpected increased efficacy of the drug towards HeLa and MCF-7 cell lines. The results pointed out that IC50 values for POSS:DOX complex towards MCF-7 and HeLa cell lines were respectively 2.69 ± 0.15, and 0.92 ± 0.09 μM L−1, compared to 17.44 ± 5.23 and 1.45 ± 0.15 μM L−1 for free doxorubicin. It clearly suggested highly increased transport effectiveness of DOX to the cells due to the use of octa(3-aminopropyl)silsesquioxane as the complexing nanocarrier.17 Similar phenomenon was also reported earlier by Ohta et al., for interaction of amino-modified silicon quantum dots and doxorubicin. They demonstrated that such species that were named as Si-QD aggregates, were internalized by HepG2 cells and could function as anticancer agents.18 In both these reports the authors proposed NH⋯N hydrogen bonding as a driving force for complex (aggregates) formation, but it was only an experimentally unsupported suggestion. Thus, the current paper focuses on analysing the mechanism of interaction between POSS and doxorubicin, and potential formation of active complexes involving POSS functional aminopropyl groups and the anthracycline functional groups. It appears generally important also for other anticancer drug complexing systems, once the presence of required functional groups for such the interactions with POSS are identified. We applied spectroscopic methods – NMR, FTIR, fluorescence, mass spectrometry, FTIR, Z-potential measurements and computational simulations. The 8![[thin space (1/6-em)]](https://www.rsc.org/images/entities/char_2009.gif) :
:![[thin space (1/6-em)]](https://www.rsc.org/images/entities/char_2009.gif) 1 molar complexes of DOX:POSS were analysed as it was found that they exhibited the highest cytotoxic activity when compared to co-delivery of 1
1 molar complexes of DOX:POSS were analysed as it was found that they exhibited the highest cytotoxic activity when compared to co-delivery of 1![[thin space (1/6-em)]](https://www.rsc.org/images/entities/char_2009.gif) :
:![[thin space (1/6-em)]](https://www.rsc.org/images/entities/char_2009.gif) 1, 2
1, 2![[thin space (1/6-em)]](https://www.rsc.org/images/entities/char_2009.gif) :
:![[thin space (1/6-em)]](https://www.rsc.org/images/entities/char_2009.gif) 1 and 4
1 and 4![[thin space (1/6-em)]](https://www.rsc.org/images/entities/char_2009.gif) :
:![[thin space (1/6-em)]](https://www.rsc.org/images/entities/char_2009.gif) 1 systems (Fig. 1).17
1 systems (Fig. 1).17
Materials and methods
Octa(3-aminopropyl)silsesquioxane (POSS-NH2) (1) was synthesized as described in the literature.19 Doxorubicin hydrochloride was obtained from Sigma Aldrich. Dimethyl-d6-sulfoxide (99.8 atom %D, ARMAR) and phosphate buffer saline PBS pH 7.4 were used as supplied by Merck. The parameters used to determine interaction between doxorubicin and POSS are shown in Table 1. Doxorubicin was dissolved in PBS (pH 7.4)/DMSO-d6 or H2O, then filtered and added to the POSS solution in the same solvent. The experiments were carried out in oven-dried, foil-wrapped glassware, under Ar, protected from the light. NMR spectra were recorded on 500 MHz Bruker AVANCE instrument at 300 K. Chemical shifts are reported in ppm downfield from TMS, using DMSO-d6 as a solvent. The FTIR spectra were obtained from 64 scans at a 2 cm−1 resolution with a Nicolet 6700 spectrometer equipped with a deuterated triglycine sulfate detector. Attenuated total reflectance (ATR) system was used in this method.| Technique | Concentration of DOX | Solvent | Reaction temperature | DOX![[thin space (1/6-em)]](https://www.rsc.org/images/entities/char_2009.gif) : :![[thin space (1/6-em)]](https://www.rsc.org/images/entities/char_2009.gif) POSS POSS |
|---|---|---|---|---|
| NOESY NMR | 8.621 × 10³ μM | DMSO-d6 | 25 °C | 8![[thin space (1/6-em)]](https://www.rsc.org/images/entities/char_2009.gif) : :![[thin space (1/6-em)]](https://www.rsc.org/images/entities/char_2009.gif) 1 1 |
| Mass spectroscopy | 50 μM | H2O | 37 °C | |
| Z-potential | PBS pH 7.4 | |||
| Fluorescence spectroscopy | ||||
| FTIR | 4.44 × 10⁻³ g mL−1 |
The fluorescence spectra were measured in quartz cuvettes using a HORIBA, Jobin Yvon spectrofluorometer at 37 °C. The widths of the excitation and emission slits were set to 3 nm. Zeta potential was determined using a Zetasizer-Nano-Z (Malvern Instrument, UK) equipped with a He–Ne laser (λ = 633 nm). Measurements for DOX–POSS system were performed at 10−3 M of phosphate buffer saline solution at 37 °C. The results are given as the average of 10 measurements from the intensity distribution curves. All MS analyses were carried out using an a hybrid Q-TOF-MS instrument (SYNAPT G2-Si HDMS Waters, Beverly, MA) equipped with an ESI interface. The instrument was operated in positive mode, using the following settings: capillary voltage 3.0 kV, sampling cone voltage and source offset established at 150 V for both, source temperature 100 °C, and desolvation gas temperature 250 °C. Nitrogen was used as both cone and de-solvation gas at flow rates of 20 and 450 L h−1, respectively. Nebulizer pressure was fixed at 6.5 bar. MS data were acquired in the range m/z 500–5000. The TOF analyser was operated in resolution mode. Sample solutions were introduced by direct infusion at a flow rate 15 μL min−1 via the electrospray interface of the mass spectrometer. To ensure accurate mass data the measurements were corrected during acquisition using sodium iodide solution as a calibrant and leucine enkephalin solution ([M + H] + 556.2771 Da) as look mass. The results of the measurements were processed using the MassLynx 4.2 software (Waters). ESI mass spectra were deconvoluted using Waters MassLynx MaxEnt 3 software. Quantum mechanical calculations were performed using the Gaussian 09 suite of programs.20 Geometries of the bases and base pair model systems were optimized using the hybrid B3LYP density functional21 corrected for dispersion interactions using Grimme GD3 empirical term22 and the 6-31+G(d) basis set in the gas phase. This level of theory was denoted as B3LYP-GD3/6-31+G(d). All stationary points were identified as stable minima by frequency calculations. The vibrational analysis provided thermal enthalpy and entropy corrections at 298 K within the rigid rotor/harmonic oscillator/ideal gas approximation.20 Thermochemical corrections were scaled by a factor of 0.98. Calculations in solution were performed within a continuum model using CPCM method.23 Larger species such as doxorubicin dimers and conjugates with POSS were modelled using the PM3 and PM7 semi-empirical methods using Mopac 2016 program24 since implementation of these methods in Gaussian 16 leads to numerical instabilities.
Results and discussion
NMR and FTIR studies
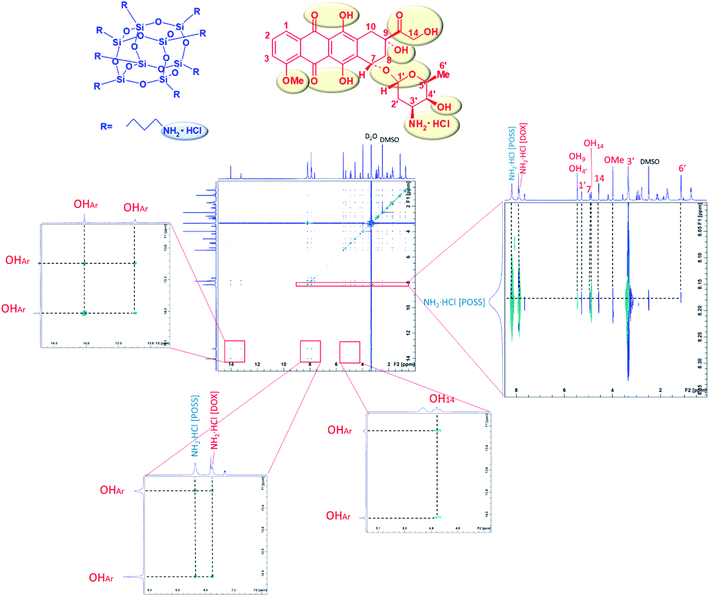
NOESY NMR measurements allow to determine, basing on cross peaks, which protons of DOX interact with aminopropyl groups of POSS, being spatially close. In order to see OH protons the measurements were performed in aprotic solvent – DMSO. NOESY spectrum of the DMSO-d6 solution of doxorubicin–POSS mixture at 8![[thin space (1/6-em)]](https://www.rsc.org/images/entities/char_2009.gif) :
:![[thin space (1/6-em)]](https://www.rsc.org/images/entities/char_2009.gif) 1 molar ratio, in DMSO, is shown in Fig. 2. Cross-correlation peaks for amine hydrochloride and hydroxy groups of doxorubicin (marked in red) and amine groups of POSS (marked in blue) were identified.
1 molar ratio, in DMSO, is shown in Fig. 2. Cross-correlation peaks for amine hydrochloride and hydroxy groups of doxorubicin (marked in red) and amine groups of POSS (marked in blue) were identified.
Protons of the POSS propylamino groups (∼8 ppm) correlate with such DOX groups as: NH2·HCl (∼8 ppm); OH9, OH4′ (∼5.5 ppm); H1′ (∼5.3 ppm); OH14, H7 (∼5 ppm); H14 (∼4.5 ppm); OMe (∼4 ppm); H3′ (∼3.4 ppm); H6′ (∼1 ppm) OHAr (∼13–14 ppm). The strongest interaction can be attributed to 3′ and NH2·HCl protons. The correlations between amine groups of POSS with the 1′, 3′, 6′, 7 and 14 protons can be explained by the close proximity of the electronegative ether moieties (1′, 6′, 7), amino group (3′) and carbonyl group (14). Additionally, NOESY spectrum shows the intermolecular interactions of doxorubicin OHAr groups originating from the π–π stacking of anthracycline rings. As discussed in our earlier report,17 the effect of hydrodynamic diameter increase on mixing both components can be explained by network-forming interactions involving doxorubicin aggregates25 as well as doxorubicin–POSS complexes. With an increase in the concentration of doxorubicin in the sample, the size of complexes decreased, thus confirming the results obtained by the MTT assay, wherein the cytotoxicity effect of the POSS:DOX complex at a molar ratio of 1![[thin space (1/6-em)]](https://www.rsc.org/images/entities/char_2009.gif) :
:![[thin space (1/6-em)]](https://www.rsc.org/images/entities/char_2009.gif) 8 was the highest.17 Intermolecular interactions can be also observed from cross peaks for OHAr and doxorubicin OH14 as well as NH2·HCl protons. In order to further characterize the DOX–POSS complex, FTIR spectroscopy was used for the solution of DOX with POSS in PBS (pH 7.3) after 24 h at 37 °C (Fig. 3). The doxorubicin to POSS molar ratio was 8
8 was the highest.17 Intermolecular interactions can be also observed from cross peaks for OHAr and doxorubicin OH14 as well as NH2·HCl protons. In order to further characterize the DOX–POSS complex, FTIR spectroscopy was used for the solution of DOX with POSS in PBS (pH 7.3) after 24 h at 37 °C (Fig. 3). The doxorubicin to POSS molar ratio was 8![[thin space (1/6-em)]](https://www.rsc.org/images/entities/char_2009.gif) :
:![[thin space (1/6-em)]](https://www.rsc.org/images/entities/char_2009.gif) 1 at concentration DOX in PBS of 4.44 × 10⁻³ g mL−1. Independently, at the same parameters a spectrum of doxorubicin in PBS was recorded to exclude its possible interactions with PBS. After incubation at relevant temperatures both samples were dried on a vacuum line and analyzed. The FTIR spectra of DOX and DOX–POSS complex are presented in Fig. 1, ESI.† The FTIR spectrum of DOX indicated characteristic maxima at 3368 cm−1 (νO–H, νN–H); 2940 cm−1 (νC–H); 1723 cm−1 (νC
1 at concentration DOX in PBS of 4.44 × 10⁻³ g mL−1. Independently, at the same parameters a spectrum of doxorubicin in PBS was recorded to exclude its possible interactions with PBS. After incubation at relevant temperatures both samples were dried on a vacuum line and analyzed. The FTIR spectra of DOX and DOX–POSS complex are presented in Fig. 1, ESI.† The FTIR spectrum of DOX indicated characteristic maxima at 3368 cm−1 (νO–H, νN–H); 2940 cm−1 (νC–H); 1723 cm−1 (νC![[double bond, length as m-dash]](https://www.rsc.org/images/entities/char_e001.gif) O ketone); 1615 cm−1 (νC
O ketone); 1615 cm−1 (νC![[double bond, length as m-dash]](https://www.rsc.org/images/entities/char_e001.gif) O aromatic); 1577 cm−1 (νC
O aromatic); 1577 cm−1 (νC![[double bond, length as m-dash]](https://www.rsc.org/images/entities/char_e001.gif) C aromatic). In contrast, the spectrum of complex DOX–POSS indicated that the absorbance intensity for ketone group (νC
C aromatic). In contrast, the spectrum of complex DOX–POSS indicated that the absorbance intensity for ketone group (νC![[double bond, length as m-dash]](https://www.rsc.org/images/entities/char_e001.gif) O ketone, 1723 cm−1) was reduced.25 It points to the interaction of propylamine hydrochloride group of POSS with the ketone group (C
O ketone, 1723 cm−1) was reduced.25 It points to the interaction of propylamine hydrochloride group of POSS with the ketone group (C![[double bond, length as m-dash]](https://www.rsc.org/images/entities/char_e001.gif) O in position 13) by reducing electron density on the oxygen atom. These results complement and confirm the above NOESY NMR studies.
O in position 13) by reducing electron density on the oxygen atom. These results complement and confirm the above NOESY NMR studies.
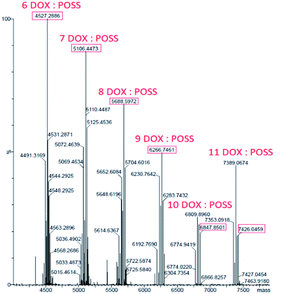 | ||
| Fig. 3 Deconvoluted electrospray ionization mass spectrometry spectrum of DOX-POSS complex after 24 h incubation (37 °C) in H2O. | ||
Mass spectrometric studies
The interactions between DOX and POSS were also studied by mass spectrometry. Under ESI conditions, octakis (3-ammonium propyl)–octasilsesquioxane hydrochloride generates a protonated molecule with eight propylamine substituents, [(POSS-(nPrNH2)8) + H]+, exactly mass measured at m/z 881.2848 (C24H65N8O12Si8). Additional signals with m/z 863.3, 845.3, 827.3 correspond to three subsequent stages of dehydration resulting from energy transferred to the precursor m/z 881 (Fig. 2, ESI†).The concentration of DOX in deionized water was 50 μM. Fig. 3, ESI,† presents the ESI MS spectrum of doxorubicin incubated in water for 24 h (37 °C). Two peaks were observed which correspond to the dimeric (1087.28 m/z) and trimeric (1630.34 m/z) form of doxorubicin molecules. It is known that doxorubicin itself can form intermolecular hydrogen-bonded complexes.25 Another possibility of intermolecular agglomeration is the π–π stacking of anthracene rings.26–28 ESI mass spectrum of the complex DOX:[POSS-(nPrNH2)8] shows a series of protonated multi-charged ions with states of charge distribution. ESI MS experimental spectrum of complex 6DOX:(POSS-(nPrNH2)8) and simulated isotopic patterns were presented on Fig. 4 (see ESI†).Products of dehydration of the POSS is observed but with no decomposition of the complex. Fig. 3 show deconvoluted spectra of DOX:(POSS-(nPrNH2)8) complex, in which the interaction of several (6–11) DOX molecules on one POSS-(nPrNH2)8 was identified (see ESI,† Table 1).
Structural features of doxorubicin
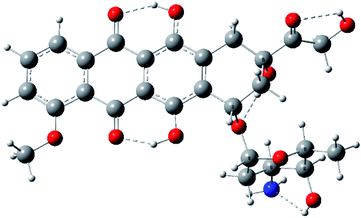
We have identified four conformers differing in the intramolecular hydrogen bond pattern. The intramolecular hydrogen bonds between OH groups in 6 and 11 positions of anthracene fragment with oxygen atoms in 5 and 12 positions occur in all conformers.29 The most stable conformer shown in Fig. 4, reveals also hydrogen bonds between OH(14) and O(13), OH(9) and O(7), OH(4′) and NH2 (structure 1, see ESI†).Model studies of intermolecular interactions involving
To study the intermolecular hydrogen bonding, in order to save computational time we constructed the simpler model which contained key functional groups of doxorubicin, namely, α-hydroxy ketone group α-hydroxy amine group, which are capable of strong hydrogen bond formation (Fig. 5).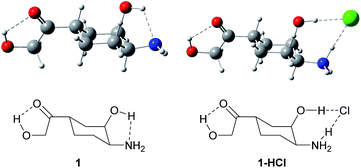 | ||
| Fig. 5 Structures of 1-((1S,3R,4S)-4-amino-3-hydroxycyclohexyl)-2-hydroxyethan-1-one (1) and 1-((1S,3R,4S)-4-amino-3-hydroxycyclohexyl)-2-hydroxyethan-1-one hydrochloride (1-HCl). | ||
It can easily be noticed that in DFT optimized structure of hydrochloride 1-HCl the proton from HCl is transferred to the amino group and the vicinal hydroxyl group is engaged in stabilization of the chloride anion. Free energy of complex formation, ΔG, is −2.8 kcal mol−1 in the gas phase, and −17.2 kcal mol−1 in water solution (ΔH = −11.9 and −26.4 kcal mol−1, respectively). The higher energy in water results from the fact that two neutral, less solvated molecules form an ionic pair solvated much more strongly, therefore an additional energy effect of about 15 kcal mol−1 results from the difference in solvation energy between the substrates and the ionic product.
There are three possibilities for binding two substrate molecules (Fig. 5, see ESI†) – the one involving both amine hydrochloride ion pairs (structure a); the one where amine hydrochloride group from one molecule is binding the hydroxy ketone group from the other (structure b); and that involving both hydroxyl ketone groups (structure c). Thus, the complex a is additionally stabilized by the hydrogen bonds from the vicinal OH groups. The enthalpies and free energies of dimerization are collected in Table 2. As one can see, the strongest interaction in this system is the interaction of NH3+Cl− ion pairs with each other (structure a). An equilibrium constant K ≈ 36 indicates that such dimers dominate in solution over the monomeric systems. Other types of complexes are more weakly bound and are present in much smaller concentration.
| ΔHgas | ΔGgas | ΔHwater | ΔGwater | Keq (H2O) | |
|---|---|---|---|---|---|
| (a) Dimer ∼ NH3Cl⋯ClNH3∼ | −34.0 | −21.9 | −13.7 | −2.1 | 36.5 |
| (b) Dimer ∼ NH3Cl⋯HOCOC∼ | −24.9 | −10.0 | −12.1 | −0.3 | 1.5 |
| (c) Dimer ∼ COCOH⋯HOCOC∼ | −16.5 | −2.3 | −11.3 | −0.03 | 1.1 |
Larger aggregates of via amine hydrochloride moieties, even tetramers are possible provided that steric congestion is not prohibitive. Below the structures of cage and ladder-like structures of simple hydroxy amine hydrochloride tetramers are presented (Fig. 6, see ESI†). Doxorubicin hydrochloride can also form ladder tetramer, according to semi-empirical PM3 calculations (Fig. 7, see ESI†).
The other possibility of intermolecular interaction is the π-stacking of anthracene rings. The stacking energy in neutral doxorubicin was calculated with DFT method with correction for dispersion forces (at the B3LYP-GD3/6-31+G(d) level). The geometries of the two dimeric forms in the gas phase were calculated to compare their relative stability. A parallel form (A) is more stable by ΔE = 7.6 kcal mol−1. The antiparallel structure (B) seems to be less stable since the formation of intermolecular hydrogen bonds in this complex is very limited. In both dimers the dispersion forces are essential (Fig. 8, see ESI†).
Doxorubicin easily gets protonated by HCl forming the ion pair. The most stable conformer found by means of conformational analysis in the gas phase is shown in Fig. 9(see ESI†) The complex formation enthalpy and free energy are ΔH = −10.9 kcal mol−1, ΔG = −1.3 kcal mol−1.
Further calculations were performed using the semi-empirical PM3 and PM7 methods to study dimers and higher assembled structures. The PM7 method apart from of hydrogen bonding can reproduce also π–π stacking. We tested this method together with B3LYP/6-31+G(d) for doxorubicin and doxorubicin hydrochloride dimers. For example, the PM7 geometry of parallel doxorubicin hydrochloride dimer shown in Fig. 6 is very close to that optimized at the DFT level. The PM7 dimerization enthalpy of −44.9 kcal mol−1 is in excellent agreement with the B3LYP electronic energy of dimerization of −43.7 kcal mol−1. Thus we believe that using PM7 modelling method we can obtain a reliable picture of bonding in the higher associates of doxorubicin with POSS. A number of conformations of the dimer linked through the NH3+Cl− bridge were found.
The example of an ‘open’ conformation is illustrated in Fig. 6. Conformation of the doxorubicin hydrochloride dimer linked through an NH3+Cl− bridge and additionally bound by intramolecular parallel π–π stacking illustrated in Fig. 10 (see ESI†). The alternative conformation involving only π–π stacking (antiparallel) is also possible (Fig. 11, see ESI†). The DFT electronic energy of bonding (dimerization) in these structures are 23.7, 43.7 and 8.8 kcal mol−1 respectively. Thus, the antiparallel dimer linked by π stacking forces only is the most weakly bound while the parallel one, where both ionic hydrogen bonding and π stacking operate, is the most strongly bound. It is very likely that doxorubicin hydrochloride exists in solution in larger associates in which the molecules are bound by hydrogen bonds and stacking forces, as for example in Fig. 12 (see ESI†).
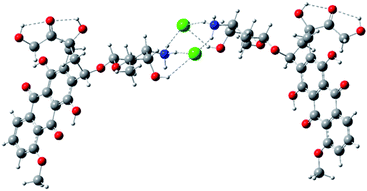 | ||
| Fig. 6 Example of conformation of the doxorubicin hydrochloride dimer linked through an NH3+Cl− bridge optimized with HF/3-21G* method. | ||
Model studies of intermolecular interactions between doxorubicin hydrochloride and POSS
Analogous interactions can occur when octa-(3)-aminopropylsilsesquioxane (T8) hydrochloride (Fig. 7) is present in solution. Interaction of the T8 cage and excess of doxorubicin hydrochloride leads to the complex linked by the NH3+Cl− bridges. There is a large number of conformations possible, one of which is presented in Fig. 7. Due to a large number of conformations of this aggregate, the precise calculation of energetics of the complex formation is very tedious and was not performed in detail. It can be seen in Fig. 8 that the doxorubicin arms are flexible enough to interact with each other via the π-stacking or by hydrogen bonds. It is also possible to form higher aggregates via intermolecular interactions, however such interactions are probably less probable than intramolecular ones due to steric and entropic reasons.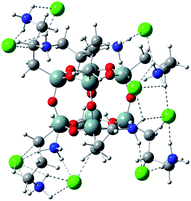 | ||
| Fig. 7 Octa-(3)-aminopropylsilsesquioxane (T8) hydrochloride optimized by PM7 method. Note that NH3+Cl− groups interact with each other forming intramolecular network of hydrogen bonds. | ||
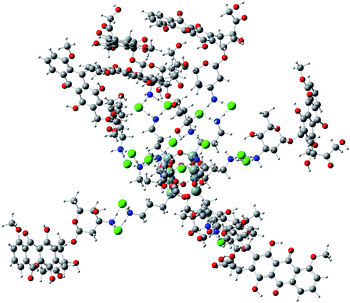 | ||
| Fig. 8 Example conformation of T8 cage linked with eight doxorubicine hydrochloride molecules optimized by PM7 method. | ||
Z potential and fluorescence analysis
The measurements of the Z-potential in PBS solution can provide information about POSS and complex POSS:DOX surface charges. Z-potential was measured for a DOX![[thin space (1/6-em)]](https://www.rsc.org/images/entities/char_2009.gif) :
:![[thin space (1/6-em)]](https://www.rsc.org/images/entities/char_2009.gif) POSS system in ratio 8
POSS system in ratio 8![[thin space (1/6-em)]](https://www.rsc.org/images/entities/char_2009.gif) :
:![[thin space (1/6-em)]](https://www.rsc.org/images/entities/char_2009.gif) 1 and for POSS itself to compare the results. The analysis was performed for 50 μM DOX concentration in PBS at 37 °C. The concentration of POSS was the same in two samples. The measurement was made 15 minutes and 24 h after mixing the substance (Fig.13, ESI†). The tested silsequioxane POSS were negatively charged (−25 mV [0 h] → −27 mV [24 h]), but DOX
1 and for POSS itself to compare the results. The analysis was performed for 50 μM DOX concentration in PBS at 37 °C. The concentration of POSS was the same in two samples. The measurement was made 15 minutes and 24 h after mixing the substance (Fig.13, ESI†). The tested silsequioxane POSS were negatively charged (−25 mV [0 h] → −27 mV [24 h]), but DOX![[thin space (1/6-em)]](https://www.rsc.org/images/entities/char_2009.gif) :
:![[thin space (1/6-em)]](https://www.rsc.org/images/entities/char_2009.gif) POSS (8
POSS (8![[thin space (1/6-em)]](https://www.rsc.org/images/entities/char_2009.gif) :
:![[thin space (1/6-em)]](https://www.rsc.org/images/entities/char_2009.gif) 1) complex was positive (9 mV [0 h] → 6 mV [24 h]). The interaction between POSS and DOX caused a significant change in Z-potential. After POSS was mixed with the DOX at 1
1) complex was positive (9 mV [0 h] → 6 mV [24 h]). The interaction between POSS and DOX caused a significant change in Z-potential. After POSS was mixed with the DOX at 1![[thin space (1/6-em)]](https://www.rsc.org/images/entities/char_2009.gif) :
:![[thin space (1/6-em)]](https://www.rsc.org/images/entities/char_2009.gif) 8 molar ratio, Z-potential turned to positive value and the mean hydrodynamic diameter increased up to ∼100 nm.17 The positive charge of DOX:POSS complex can increase interaction with negatively charged biological membranes and make drug delivery more efficient.27 Fluorescence spectrophotometry was performed to check the stability of the DOX
8 molar ratio, Z-potential turned to positive value and the mean hydrodynamic diameter increased up to ∼100 nm.17 The positive charge of DOX:POSS complex can increase interaction with negatively charged biological membranes and make drug delivery more efficient.27 Fluorescence spectrophotometry was performed to check the stability of the DOX![[thin space (1/6-em)]](https://www.rsc.org/images/entities/char_2009.gif) :
:![[thin space (1/6-em)]](https://www.rsc.org/images/entities/char_2009.gif) POSS complex (8
POSS complex (8![[thin space (1/6-em)]](https://www.rsc.org/images/entities/char_2009.gif) :
:![[thin space (1/6-em)]](https://www.rsc.org/images/entities/char_2009.gif) 1). This complex was prepared by incubation DOX with POSS at 37 °C as a final concentration DOX in PBS to 50 μM. The fluorescence intensity of DOX:POSS remained constant during 48 h (Fig 14, ESI†). This result indicates the stability of POSS:DOX complex and hindered aggregation of drug. Higher stability allows the DOX:POSS complex to circulate in the blood for longer time and increase its accumulation at the target site. The effects of the amount of drug (DOX
1). This complex was prepared by incubation DOX with POSS at 37 °C as a final concentration DOX in PBS to 50 μM. The fluorescence intensity of DOX:POSS remained constant during 48 h (Fig 14, ESI†). This result indicates the stability of POSS:DOX complex and hindered aggregation of drug. Higher stability allows the DOX:POSS complex to circulate in the blood for longer time and increase its accumulation at the target site. The effects of the amount of drug (DOX![[thin space (1/6-em)]](https://www.rsc.org/images/entities/char_2009.gif) :
:![[thin space (1/6-em)]](https://www.rsc.org/images/entities/char_2009.gif) POSS 8
POSS 8![[thin space (1/6-em)]](https://www.rsc.org/images/entities/char_2009.gif) :
:![[thin space (1/6-em)]](https://www.rsc.org/images/entities/char_2009.gif) 1), hydrodynamic diameter (∼100 nm), positive charge (∼27 mV) and stability at physiological conditions (PBS buffer) explains profound increase of cytotoxicity of the DOX:POSS complex compared to DOX.17
1), hydrodynamic diameter (∼100 nm), positive charge (∼27 mV) and stability at physiological conditions (PBS buffer) explains profound increase of cytotoxicity of the DOX:POSS complex compared to DOX.17
Conclusions
In this study, we have shown that octa(3-aminopropyl) silsesquioxane hydrochloride (POSS-NH2·HCl) can interact non-covalently with doxorubicin hydrochloride (DOX·HCl). The complexes were characterized by NMR, FTIR, fluorescence spectroscopy, mass spectrometry and Z-potential. Experimental results were supported by quantum mechanical calculations. The latter ones have led to the conclusion that the strongest interactions occur between amine hydrochloride groups of POSS and analogous moieties of doxorubicin, and not NH⋯N hydrogen bonding as suggested previously.17,18 They are additionally strengthened by intermolecular interactions of doxorubicin moieties themselves in 8 (DOX) to 1 (POSS) molar complex (π–π stacking and hydrogen bonds). There appear thus two reasons why co-delivery of POSS with DOX led to higher anticancer activity then for DOX itself.17 As discussed in the literature23–25 and shown in this research doxorubicin easily forms oligomeric complexes itself in solution. On co-delivery with POSS, individual doxorubicin molecules form complexes with the POSS carrier. The other factor is the well-known high ability of POSS to penetrate cell membranes.30 Both these properties of POSS-NH2·HCl–DOX system appear to interplay and lead to improved activity on co-delivery of POSS and DOX. These results can point to a useful and simple way of improving efficacy of chemotherapy also for other drug–POSS systems, provided they contain functional groups assuring such weak but efficient interactions.Conflicts of interest
There are no conflicts to declare.Acknowledgements
The financial support for this study was provided by the Centre of Molecular and Macromolecular Studies. K. Piorecka wishes to acknowledge the Preludium Grant UMO-2016/21/N/ST5/03360. DFT calculations were supported by the PL-Grid infrastructure.Notes and references
- N. Zhao, M. C. Woodle and A. J. Mixson, J. Nanomed. Nanotechnol., 2018, 9(5), 1000519 CrossRef PubMed.
- D. Agudelo, P. Bourassa, G. Bérubé and H.-A. Tajmir-Riahi, Int. J. Biol. Macromol., 2014, 66, 144–150 CrossRef CAS PubMed.
- S. Malla, N. P. Niraula, K. Liou and J. K. Sohng, Res. Microbiol., 2010, 161, 109–117 CrossRef CAS PubMed.
- A. Aluigia, M. Ballestria, A. Guerrinia, G. Sotgiua, C. Ferronia, F. Corticellib, M. B. Gariboldic, E. Montic and G. Varchia, Mater. Sci. Eng., C, 2018, 90, 476–484 CrossRef.
- K. Piorecka, D. Smith, J. Kurjata, M. Stanczyk and W. A. Stanczyk, Bioorg. Chem., 2020, 96, 103617 CrossRef CAS PubMed.
- K. Piorecka, J. Kurjata, M. Stanczyk and W. A. Stanczyk, Biomater. Sci., 2018, 6, 2552–2565 RSC.
- M. Marcinkowska, E. Sobierajska, M. Stanczyk, A. Janaszewska, A. Chworos and B. Klajnert-Maculewicz, Polymers, 2018, 10, 187 CrossRef PubMed.
- S. Chandra, S. Dietrich, H. Lang and D. Bahadur, J. Mater. Chem., 2011, 21, 5729–5737 RSC.
- A. Janaszewska, K. Gradzinska, M. Marcinkowska, B. Klajnert-Maculewicz and W. A. Stanczyk, Materials, 2015, 8, 6062–6070 CrossRef CAS PubMed.
- R. Y. Kannan, H. J. Salacinski, P. E. Butler and A. M. Seifalian, Acc. Chem. Res., 2005, 38, 879–884 CrossRef CAS PubMed.
- K. Gradzinska, K. Labecka, A. Kowalewska and W. A. Stanczyk, Polimery, 2016, 61(4), 232–238 CrossRef.
- W. Zhang and A. H. E. Müller, Prog. Polym. Sci., 2013, 38, 1121 CrossRef CAS.
- Z. Zhou and Z. R. Lu, Future Medicine, 2014, 9, 2387 CAS.
- S. Fabritz, S. Hörner, O. Avrutina and H. Kolmar, Org. Biomol. Chem., 2013, 11, 2224 RSC.
- K. Piorecka, J. Kurjata, M. Stanczyk and W. A. Stanczyk, Biomater. Sci., 2018, 6(10), 2552–2565 RSC.
- K. Piorecka, E. Radzikowska, J. Kurjata, K. Rozga-Wijas, W. A. Stanczyk and E. Wielgus, New J. Chem., 2016, 40, 5997–6000 RSC.
- E. Sobierajska, M. Konopka, A. Janaszewska, K. Piorecka, A. Blauz, B. Klajnert-Maculewicz, M. Stanczyk and W. A. Stanczyk, Materials, 2017, 10, 559 CrossRef PubMed.
- S. Ohta, K. Yamura, S. Inasawa and Y. Yamaguchi, Chem. Commun., 2015, 51, 6422–6425 RSC.
- M. C. Gravel, C. Zhang, M. Dinderman and R. M. Laine, Appl. Organomet. Chem., 1999, 13, 329–336 CrossRef CAS.
- Gaussian 16, Revision C.01, M. J. Frisch, G. W. Trucks, H. B. Schlegel, G. E. Scuseria, M. A. Robb, J. R. Cheeseman, G. Scalmani, V. Barone, G. A. Petersson, H. Nakatsuji, X. Li, M. Caricato, A. V. Marenich, J. Bloino, B. G. Janesko, R. Gomperts, B. ennucci, H. P. Hratchian, J. V. Ortiz, A. F. Izmaylov, J. L. Sonnenberg, D. Williams-Young, F. Ding, F. Lipparini, F. Egidi, J. Goings, B. Peng, A. Petrone, T. Henderson, D. Ranasinghe, V. G. Zakrzewski, J. Gao, N. Rega, G. Zheng, W. Liang, M. Hada, M. Ehara, K. Toyota, R. Fukuda, J. Hasegawa, M. Ishida, T. Nakajima, Y. Honda, O. Kitao, H. Nakai, T. Vreven, K. Throssell, J. A. Montgomery Jr, J. E. Peralta, F. Ogliaro, M. J. Bearpark, J. J. Heyd, E. N. Brothers, K. N. Kudin, V. N. Staroverov, T. A. Keith, R. Kobayashi, J. Normand, K. Raghavachari, A. P. Rendell, J. C. Burant, S. S. Iyengar, J. Tomasi, M. Cossi, J. M. Millam, M. Klene, C. Adamo, R. Cammi, J. W. Ochterski, R. L. Martin, K. Morokuma, O. Farkas, J. B. Foresman and D. J. Fox, Gaussian, Inc., Wallingford CT, 2016 Search PubMed.
- A. D. Becke, J. Chem. Phys., 1993, 98, 5648–5652 CrossRef CAS.
- S. Grimme, J. Antony, S. Ehrlich and H. Krieg, J. Chem. Phys., 2010, 132, 154104–154119 CrossRef PubMed.
- M. Cossi, N. Rega, G. Scalmani and V. Barone, J. Comput. Chem., 2003, 24, 669–681 CrossRef CAS PubMed.
- J. J. P. Stewart, J. Mol. Mod., 2013, 19, 1–32 CrossRef CAS PubMed.
- U. Kanwal, N. I. Bukhari, N. F. Rana, M. Rehman, K. Hussain, N. Abbas, A. Mehmood and A. Raza, Int. J. Nanomed., 2019, 14, 1–15 CrossRef CAS PubMed.
- Z. Fülöp, R. Gref and T. Loftsson, Int. J. Pharm., 2013, 454, 559–561 CrossRef PubMed.
- P. Agrawal, S. K. Barthwal and R. Barthwal, Eur. J. Med. Chem., 2009, 44, 1437–1451 CrossRef CAS PubMed.
- R. Anand, S. Ottani, F. Manoli, I. Manet and S. Monti, RSC Adv., 2012, 2, 2346–2357 RSC.
- N. Martinho, H. Florindo, L. Silva, S. Brocchini, M. Zloh and T. Barata, Molecules, 2014, 19, 20424–20467 CrossRef PubMed.
- S. Hörner, S. Knauer, C. Uth, M. Jöst, V. Schmidts, H. Frauendorf, C. Thiele, O. Avrutina and H. Kolmar, Angew. Chem., Int. Ed. Engl., 2016, 55, 14842–14846 CrossRef PubMed.
Footnote |
| † Electronic supplementary information (ESI) available: Computer simulation and analytical data. See DOI: 10.1039/d0ra01319f |
| This journal is © The Royal Society of Chemistry 2020 |

