DOI:
10.1039/D0RA01265C
(Paper)
RSC Adv., 2020,
10, 8989-8993
Ascorbic acid stabilised copper nanoclusters as fluorescent sensors for detection of quercetin
Received
10th February 2020
, Accepted 22nd February 2020
First published on 2nd March 2020
Abstract
In this report, green-emitting fluorescence copper nanoclusters (Cu NCs) were synthesized using ascorbic acid as reducing agent and protecting agent. The ascorbic acid capped Cu NCs (AA-Cu NCs) were characterized using fluorescence spectroscopy, UV-vis absorption spectroscopy, Fourier Transform Infrared Spectroscopy (FT-IR), Transmission Electron Microscopy (TEM) and X-ray photoelectron spectroscopy (XPS). The analysis data demonstrated that the AA-Cu NCs were highly dispersed with an average diameter of 2 nm. The as-prepared Cu NCs possessed good water solubility, excellent photostability and displayed excitation-dependent fluorescence characteristics. More importantly, the fluorescence intensity of AA-Cu NCs was linearly quenched in the presence of quercetin from 0.7 to 50 μM and the detection limit (LOD) was 0.19 μM. Finally, the fluorescence sensor was successfully employed to detect quercetin in bovine serum samples.
1 Introduction
Quercetin (Que) (Chart 1), a flavonoid with antioxidant properties, has widely attract a lot of attention for the treatment of expectorant, coughs, hyperlipidemia, hypertension, coronary heart disease, chronic bronchitis and cancer.1–3 In addition, quercetin-containing nutritional supplements are often used to treat eye diseases, atherosclerosis, which are caused by allergies, diabetes, cataracts or retinal problems. However, it can easily lead to adverse reactions in the case of excessive dosage. Therefore, exploring a facile, fast and effective detection method for the rapid and convenient determination of Que is a crucial topic in the medical field. So far, various analytical methods have been applied to determine Que including spectrophotometric methods,4 Raman scattering spectroscopy,5 high-performance liquid chromatography6 and electrochemical methods.7 Although these methods show the advantages of high sensitivity and reliability, they have some drawbacks, including long times, high cost and require a professional operator. Therefore, development of fast, convenient, low cost, highly selective and sensitive determination methods for Que measurement is very important.
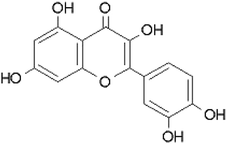 |
| | Chart 1 Chemical structure of quercetin. | |
Recently, fluorescence sensors have attracted more attention due to their fast synthesis, easy operation, high sensitivity and selective properties. To date, different types of fluorescent materials have been developed to determine Que such as quantum dots,8,9 carbon-based nanomaterials10 and metal nanomaterials.11 For example, Wu et al.8 prepared mercaptoacetic acid modified ZnS quantum dots (ZnS-QDs), which could be used to determine Que and the detection limit reached 0.571 μM. Gao et al.10 developed nickel-doped carbon nanoflowers (Ni-CNFWs) for ultrasensitive sensing of Que and the detection limit reached 0.137 μM. Unfortunately, the preparation conditions of these nanomaterials were harsh, which limited the rapid and convenient application of this method. Therefore, the selective and sensitive determination of Que with simple synthesis methods was a great challenge.
Metal nanoclusters (MNCs) as a novel fluorescent material have been applied to detect toxic substances owing to excellent optical properties, stability and biocompatibility.12–16 To date, a variety of metal nanoclusters have been successfully prepared through an etching synthesis method,17 phase transfer synthesis method,18 microwave-assisted synthesis method,19 sonochemical synthesis method20 and photoreduction synthesis method,21 using Au, Ag, Pt and Cu NCs.22–27 Compared to Ag and Au, Cu is an easily available and low-cost metal. In the meantime, Cu NCs have been employed to detect Hg2+,28 Pb2+,29 Fe3+,30 Cu2+,31 and H2O2.32,33 To our knowledge, Cu NCs are rarely utilized for detection of Que in real samples.
Herein, we prepared stable, water soluble copper nanoclusters (Cu NCs) by using ascorbic acid as the protective agent and reducing agent under 70 °C for 8 h (Scheme 1). The AA-Cu NCs were characterized by UV-vis absorbance spectroscopy, fluorescence spectroscopy, FT-IR, TEM and XPS. Besides, we investigated the factors for the fluorescence intensity of AA-Cu NCs including storage time, UV irradiation time, NaCl concentration and different metal ions. Moreover, the as-prepared Cu NCs show rapid response to Que, which indicates the feasibility as a sensitive probe to detect Que in real samples.
 |
| | Scheme 1 Schematic illustration of the AA-Cu NCs for quercetin sensing. | |
2 Materials and methods
2.1 Materials
Cupric chloride (CuCl2, 99%), ascorbic acid (AA, 99%) were obtained from Sinopharm Chemical Reagent Co., Ltd, China. Sodium chloride (NaCl, 99%), potassium chloride (KCl, 99%), magnesium chloride (MgCl2, 99%), calcium chloride (CaCl2, 99%), sodium nitrate (NaNO3, 99%), sodium carbonate decahydrate (Na2CO3·10H2O, 99.99%), dopamine (DA, 98%), gallic acid (GA, 98%), glutamic acid (Gla, 99%), proline (Pro, 99%), cysteine (Cys, 99%), glucose (Glu, 99.8%), bovine serum albumin (BSA, 99%) and quercetin (Que, 98%) were obtained from Aladdin Bio-Chem Technology Co. Ltd. (Shanghai, China). Ultra-pure water (18.25 M cm−1) was purified using a Millipore Milli-Q.
2.2 Instrumentation
The fluorescence analysis was performed through F-7000 fluorescence spectrophotometer (Hitachi, Tokyo Japan) with the Ex/Em slits of 5.0/5.0 nm and the scanning speed of 1200 nm min−1. The UV-vis measurements were recorded using a Shimadzu 2450 UV-visible spectrophotometer (Shimadzu, Japan). The Fourier transform infrared spectrums were acquired by a FTIR-8400S (Shimadzu Corporation, Kyoto, Japan). The transmission electron microscopy (TEM) image was obtained by using FEI Tecnai G2 F20 (United States). X-ray photoelectron spectroscopy (XPS) spectrum was gained using ESCALAB 250XI (United States). The pH values of solution was measured by pH meter (FE20, Shanghai Mettler Instrument Company, Ltd., China).
2.3 Synthesis of AA-Cu NCs
The ascorbic acid-templated Cu NCs were established through a facile, one-pot synthetic method.34 In a typical experiment, cupric chloride solution (3 mL, 0.1 M) was added into 14 mL water. Then, ascorbic acid solution (3 mL, 0.1 M) was gradually dropped into above solution and reacted under 70 °C for 8 h. The solutions gradually changed from colorless to light yellow, implying successful synthesis of Cu NCs. Finally, the AA-Cu NCs was stored under 4 °C for further use.
2.4 Application as quercetin fluorescent probe
Different concentration of quercetin solutions were dropped into the AA-Cu NCs solution (final concentrations of quercetin were 0, 0.2, 0.7, 1, 5, 10, 15, 20, 25, 30, 40, 50, 60, 70, 80 and 90 μM). Then the mixture were incubated at room temperature for 1 min. To explore the selectivity of quercetin, we studied the effect of other references (Na+, K+, Mg2+, Ca2+, Cu2+, NO3−, CO32−, dopamine, gallic acid, glutamic acid, proline, cysteine, glucose and bovine serum albumin) on the fluorescence intensity of AA-Cu NCs under the same conditions.
2.5 Application in bovine serum sample
To investigate the possibility of AA-Cu NCs as a fluorescent probe for detection of quercetin, different concentrations of quercetin were spiked into bovine serum sample. Then, the spiked samples with quercetin were detected through the above fluorescent method.
3 Results and discussion
3.1 Characterization of the AA-Cu NCs
The structure, composition and optical performance of AA-Cu NCs were explored by fluorescence spectroscopy, UV-vis absorption spectroscopy, FT-IR, TEM and XPS. As revealed in Fig. 1A, the fluorescence of AA-Cu NCs demonstrated excitation and emission wavelength around 390 and 455 nm, respectively. In addition, the Cu NCs solution was brown under visible light and showed green fluorescence under UV irradiation (365 nm), respectively (inset in Fig. 1A). Impressively, maximum emission of AA-Cu NCs showed not constant under the excitation peak change from 340 to 410 nm, implying that AA-Cu NCs displayed the excitation-dependent characteristics (Fig. 1B). Meanwhile, the fluorescence emission and UV-vis absorption spectra of AA-Cu NCs and AA were studied. In Fig. 2A, only AA-Cu NCs displayed strong spectrum peak, revealing that the fluorescence was derived from Cu NCs instead of AA. Additionally, UV-visible absorption spectrum of AA-Cu NCs had an obvious peak around 365 nm.
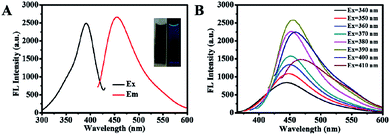 |
| | Fig. 1 (A) The fluorescence excitation and emission spectrum of AA-Cu NCs; (B) The fluorescence emission spectra of AA-Cu NCs under different excitation wavelength. | |
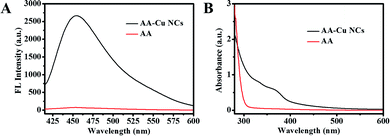 |
| | Fig. 2 The fluorescence emission (A) UV-vis absorption (B) spectra of AA-Cu NCs and AA. | |
As displayed in Fig. 3A, AA-Cu NCs were well dispersed and had spherical nanostructure with a size of 2 nm. The surface structure of AA-Cu NCs were also studied through FTIR spectroscopy. Some functional groups of AA were found on the surface of the Cu NCs (Fig. 3B). XPS spectra showed that the AA-Cu NCs had C, O, N and Cu elements (Fig. 3C). As illustrated in Fig. 3D, two binding energy peaks around 932.28 and 952.2 eV was corresponded with the Cu 2p3/2 and Cu 2p1/2 electrons of Cu atom from the XPS spectrum. Moreover, there was no binding energy peak observed at 942 eV, illustrating that Cu2+ was completely reduced. The above characterization results confirmed that the AA-Cu NCs were successfully synthesized through a simple strategy.
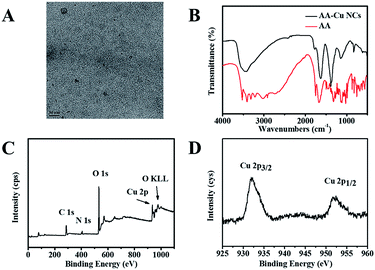 |
| | Fig. 3 TEM image of AA-Cu NCs (A); FT-IR spectrum of AA-Cu NCs and AA (B); XPS spectrum of AA-Cu NCs (C) and Cu 2p (D). | |
3.2 Stability of Cu NCs
As is known to all, the stability of Cu NCs is a vital factor in many practical applications. Thence, the effects of storage time, UV irradiation time, concentrations of sodium chloride and metal ions on the stability of AA-Cu NCs were studied in this paper. As shown in Fig. 4A, AA-Cu NCs were stable under 4 °C for 10 d. Meanwhile, the fluorescence intensity of AA-Cu NCs still maintained constant with UV light irradiation for 60 min at room temperature (Fig. 4B). The effect of concentrations of sodium chloride and different metal ions on fluorescence intensity were also discussed in subsequent trials. There was no obvious change under 0.25 M NaCl and different metal ions (Fig. 4C and D).
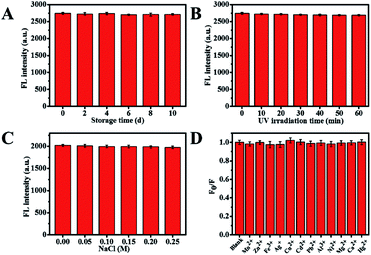 |
| | Fig. 4 Effect of storage time (A), UV irradiation time (B), different concentrations of NaCl (C) and different metal ions (D) on stability of AA-Cu NCs. | |
3.3 Determination of quercetin through the fluorescence of the AA-Cu NCs
To investigate possibility of the AA-Cu NCs for detection of quercetin, the fluorescence intensity of AA-Cu NCs with different concentrations of quercetin were recorded at excitation wavelength of 390 nm. The final amounts of quercetin were 0, 0.2, 0.7, 1, 5, 10, 15, 20, 25, 30, 40, 50, 60, 70, 80 and 90 μM, respectively. With the concentration of quercetin increased, the fluorescence intensity at 455 nm gradually decreased (Fig. 5A). The linear relationship of F0/F and quercetin amounts was studied (from 0 to 90 μM). The linear fitting equations were F0/F = 0.0122[Q] + 1.041 (R2 = 0.9917) from 0.7 to 50 μM (Fig. 4B) (Q represents the concentrations of quercetin). The corresponding detection limit (LOD) was 0.19 μM (S/N = 3). Compared with other sensing platforms for quercetin detection, as shown in Table 1, our probe obtained better linear ranges or LOD.
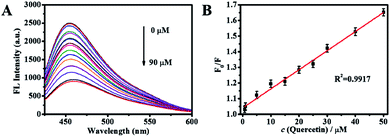 |
| | Fig. 5 (A) The fluorescence emission spectrum of AA-Cu NCs with the increasing concentration (0, 0.2, 0.7, 1, 5, 10, 15, 20, 25, 30, 40, 50, 60, 70, 80 and 90 μM) of quercetin at 390 nm excitation. (B) The calibration curve with quercetin concentration from 0.7 to 50 μM. | |
Table 1 A comparison of different methods for the detection of quercetin
| Method |
Probe |
Linear range (μM) |
LOD (μM) |
Ref. |
| HPLC |
— |
— |
0.67 |
6 |
| Spectrophotometric |
— |
— |
2.52 |
4 |
| Raman spectroscopy |
— |
— |
50 |
5 |
| Ratiometric electrochemical |
GCE |
0.1–15 |
0.0031 |
7 |
| Fluorescence |
ZnS-QDs |
2.65–7.50 |
0.571 |
8 |
| Fluorescence |
CNPs |
3.3–41.2 |
0.175 |
39 |
| Fluorescence |
Cu NCs |
0.7–50 |
0.19 |
This work |
3.4 Selectivity
To study the selectivity of AA-Cu NCs for quercetin detection, we evaluated the effect of other references including Na+, K+, Mg2+, Ca2+, Cu2+, NO3−, CO32−, DA, GA, Gla, Pro, Cys, Glu and BSA on AA-Cu NCs. As displayed in Fig. 6, no obvious fluorescence intensity changes were found in the presence of other references, while quercetin could obviously quench the fluorescence of AA-Cu NCs under the same conditions. It indicated that the fluorescent probe model were selective for the determination of quercetin over other references. Therefore, the AA-Cu NCs possessed excellent selectivity for detection of quercetin.
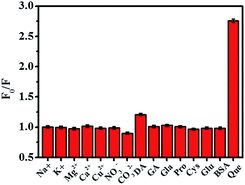 |
| | Fig. 6 Relative fluorescence intensities (F0/F) of AA-Cu NCs solution with addition of Na+, K+, Mg2+, Ca2+, Cu2+, NO3−, CO32−, DA, GA, Gla, Pro, Cys, Glu, BSA and Que (the concentration was 100 μM). | |
3.5 Determination mechanism
The possible mechanism of fluorescence quenching in the presence of quercetin was investigated. We first investigated the fluorescence spectrum of the AA-Cu NCs and the UV-visible spectrum of the quercetin. As displayed in Fig. 7A, a clear absorption peak was found at 355 nm, and the AA-Cu NCs demonstrated the maximum excitation and emission peaks at 390 and 455 nm, respectively. The above results indicated that the absorption peak of quercetin obviously overlapped with the fluorescence excitation peak of the AA-Cu NCs. This could provide some evidences for the occurrence of internal filter effects (IFE).35,36 In addition, to further verify the possibility of the IFE mechanism, the fluorescence lifetimes of AA-Cu NCs was analyzed in the absence and presence of quercetin, respectively. As Fig. 7B revealing, the fluorescence lifetimes of AA-Cu NCs and AA-Cu NCs-quercetin system were 2.43 ns and 2.39 ns, indicating no dramatically change. Thence, the possible quenching mechanism of AA-Cu NCs-quercetin system was static quenching. To further confirm the quenching mechanism, the fluorescence quenching experimental data were studied through Stern–Volmer equation.
| F0/F = 1 + KSV[Q] = 1 + Kqτ0[Q] |
where, F0 and F are the fluorescence intensity of AA-Cu NCs in the absence and presence of quercetin, respectively. KSV is the Stern–Volmer quenching constant. [Q] is the concentration of quercetin, τ0 is the lifetime of the AA-Cu NCs (2.43 ns). As we can see from Fig. 5B, KSV and Kq are equal to 1.22 × 10⁴ L mol−1 and 5.02 × 10¹² L mol−1 s−1, respectively. The Kq value was greater than the maximum scatter collision quenching constant (2 × 10¹⁰ L mol−1 s−1), implying that the quenching mechanism was static quenching.37,38 Therefore, after the addition of quercetin, the quenching mechanism of AA-Cu NCs was IFE and static quenching.
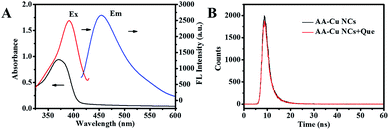 |
| | Fig. 7 (A) UV-vis absorption spectra of quercetin, the fluorescence excitation and emission spectrum of AA-Cu NCs; (B) The fluorescence lifetime of AA-Cu NCs and AA-Cu NCs-quercetin system. | |
3.6 Application of AA-Cu NCs in bovine serum sample
The promising approach for detection of quercetin by using AA-Cu NCs as fluorescent sensor was employed to the determination of quercetin in bovine serum sample. As illustrated in Table 2, the analysis results of quercetin detection were very close to the spiked concentrations. In addition, the recovery experiments were also conducted and satisfactory recoveries of quercetin for measuring bovine serum sample were obtain from 95.5% to 106%. These results demonstrated that this proposed fluorescence sensor had promising application for quercetin determination in bovine serum sample.
Table 2 Results of the quercetin recoveries in bovine serum sample
| Sample |
Quercetin spiked (μM) |
Found (μM) |
Recovery (%) |
| Bovine serum sample |
5 |
4.88 |
97.6 |
| 15 |
14.32 |
95.5 |
| 25 |
26.5 |
106.0 |
4 Conclusions
In conclusion, water soluble, green fluorescence AA-Cu NCs was synthesized by using chemical reduction method at 70 °C for 8 h. To be specific, the AA-Cu NCs showed better fluorescence intensity, high dispersion and excellent stability. Interestingly, we made use of AA-Cu NCs for simple, sensitive and selective detection of quercetin. The relative fluorescence intensity of AA-Cu NCs had a well linear relationship with quercetin amounts from 0.7 to 50 μM and the detection limit reached 0.19 μM. Finally, the AA-Cu NCs as a fluorescent probe could be successfully used to detect quercetin in bovine serum sample.
Conflicts of interest
There are no conflicts to declare.
Acknowledgements
This work was supported by the Shanxi Applied Basic Research Project (Grant No. 201801D121257), the Shanxi Province Science Foundation for Youths (Grant No. 201801D221142) and the Fund for Shanxi “1331 Project” Collaborative Innovation Center (Grant No. I018038).
References
- S. Borska, M. Chmielewska, T. Wysocka, M. D. Zalesinska, M. Zabel and P. Dziegiel, Food Chem. Toxicol., 2012, 50, 3375–3383 CrossRef PubMed.
- A. P. Rogerio, C. L. Dora, E. L. Andrade, J. S. Chaves, L. F. Silva, E. Lemos-Senna and J. B. Calixto, Pharmacol. Res., 2010, 61, 288–397 CrossRef PubMed.
- E. G. Ferrer, M. V. Salinas, M. J. Correa, L. Naso, D. A. Barrio, S. B. Etcheverry, L. Lezama, T. Rojo and P. A. M. Williams, J. Biol. Inorg Chem., 2006, 11, 791–801 CrossRef PubMed.
- N. Pejic, V. Kuntic, Z. Vujic and S. Micic, Direct spectrophotometric determination of quercetin in the presence of ascorbic acid, Il Farmaco, 2004, 59, 21–24 CrossRef CAS PubMed.
- Y. Numata and H. Tanaka, Food Chem., 2011, 126, 751–755 CrossRef CAS.
- A. Nugroho, S. C. Lim, C. M. Lee, J. S. Choi and H. J. Park, J. Pharm. Biomed. Anal., 2001, 61, 247–251 CrossRef.
- J. B. Yu, H. Jin, R. J. Gui, W. Lv and Z. H. Wang, J. Electroanal. Chem., 2017, 795, 97–102 CrossRef CAS.
- D. D. Wu and Z. Chen, Luminescence, 2014, 29, 307–313 CrossRef CAS.
- K. Dwiecki, P. Kwiatkowska, A. Siger, H. Staniek, M. Nogala-Kałucka and K. Polewski, Int. J. Food Sci. Technol., 2015, 50, 1366–1373 CrossRef CAS.
- Y. F. Gao, X. Jin, F. Y. Kong, Z. X. Wang and W. Wang, Analyst, 2019, 144, 7283–7289 RSC.
- Z. G. Chen, S. H. Qian, J. H. Chen and X. Chen, J. Nanopart. Res., 2012, 14, 1264 CrossRef.
- H. Huang, H. Li, J. J. Feng, H. Feng, A. J. Wang and Z. S. Qian, Sens. Actuators, B, 2017, 241, 292–297 CrossRef CAS.
- M. A. Vallejo, M. Perez, P. V. Ceron, R. Navarro, C. Villaseñor, T. Cordova and M. Sosa, Nano, 2017, 12, 1750145 CrossRef.
- J. Chen, P. T. Dong, C. G. Wang, C. Y. Zhang, J. F. Wang and X. Z. Wu, Nano, 2017, 12, 1750131 CrossRef.
- T. T. Luo, S. T. Zhang, Y. J. Wang, M. N. Wang, M. Liao and X. M. Kou, Luminescence, 2017, 32, 1092–1099 CrossRef PubMed.
- H. Y. Cao, Z. H. Chen, H. Z. Zheng and Y. M. Huang, Biosens. Bioelectron., 2014, 62, 189–195 CrossRef.
- M. A. H. Muhammed, S. Ramesh, S. S. Sinha, S. K. Pal and T. Pradeep, Nano Res., 2008, 1, 333–340 CrossRef.
- X. Yuan, Z. T. Luo, Q. B. Zhang, X. H. Zhang, Y. G. Zheng, J. Y. Lee and J. P. Xie, ACS Nano, 2011, 5, 8800–8808 CrossRef.
- R. P. Li, C. L. Wang, F. Bo, Z. Y. Wang, H. B. Shao, S. H. Xu and Y. P. Cui, ChemPhysChem, 2012, 13, 2097–2101 CrossRef CAS.
- H. Y. Liu, X. Zhang, X. M. Wu, L. P. Jiang, C. Burda and J. J. Zhu, Chem. Commun., 2011, 47, 4237–4239 RSC.
- Z. Shen, H. W. Duan and H. Frey, Adv. Mater., 2007, 19, 349–352 CrossRef.
- H. B. Wang, H. Y. Bai, A. L. Mao and Y. M. Liu, Anal. Lett., 2019, 52, 2300–2311 CrossRef.
- B. Z. Zhang and C. Y. Wei, Talanta, 2018, 182, 125–130 CrossRef.
- S. Shahsavari, S. Hadian-Ghazvini, F. H. Saboor, I. M. Oskouie, M. Hasany, A. Simchi and A. L. Rogach, Mater. Chem. Front., 2019, 3, 2326–2356 RSC.
- X. L. Guo, Y. X. Suo, X. Zhang, Y. S. Cui, S. F. Chen, H. T. Sun, D. W. Gao, Z. W. Liu and L. G. Wang, Analyst, 2019, 144, 5179–5185 RSC.
- H. Huang, H. Li, A. J. Wang, S. X. Zhong, K. M. Fang and J. J. Feng, Analyst, 2014, 139, 6536–6541 RSC.
- D. L. Zhou, H. Huang and Y. Wang, Anal. Methods, 2017, 9, 5668–5673 RSC.
- X. M. Yang, Y. J. Feng, S. S. Zhu, Y. W. Luo, Y. Zhuo and Y. Dou, Anal. Chim. Acta, 2014, 847, 49–54 CrossRef.
- C. X. Wang, H. Cheng, Y. J. Huang, Z. Z. Xu, H. H. Lin and C. Zhang, Analyst, 2015, 140, 5634–5639 RSC.
- Y. H. Huang, H. Q. Zhang, X. F. Xu, J. C. Zhou, F. F. Lu, Z. S. Zhang, Z. B. Hu and J. S. Luo, Spectrochim. Acta, Part A, 2018, 202, 65–69 CrossRef PubMed.
- Z. C. Liu, J. W. Qi, C. Hu, L. Zhang, W. Song, R. P. Liang and J. D. Qiu, Anal. Chim. Acta, 2015, 895, 95–103 CrossRef PubMed.
- T. Y. Zhou, Q. H. Yao, T. T. Zhao and X. Chen, Talanta, 2015, 141, 80–85 CrossRef PubMed.
- Y. Ling, N. Zhang, F. Qu, T. Wen, Z. F. Gao, N. B. Li and H. Q. Luo, Spectrochim. Acta, Part A, 2014, 118, 315–320 CrossRef CAS PubMed.
- W. J. Zhang, S. G. Liu, L. Han, Y. Ling, L. L. Liao, S. Mo, H. Q. Luo and N. b. Li, Anal. Methods, 2018, 10, 4251–4256 RSC.
- Y. Zhao, S. Zou, D. Huo, C. Hou, M. Yang, J. Li and M. Bian, Anal. Chim. Acta, 2019, 1047, 179 CrossRef CAS PubMed.
- L. Li, C. J. Hou, J. W. Li, Y. X. Yang, J. Z. Hou, Y. Ma, Q. He, H. B. Luo and D. Q. Huo, Anal. Methods, 2019, 11, 4637 RSC.
- X. J. Zheng, R. P. Liang and Z. J. Li, Sens. Actuators, B, 2016, 230, 314–319 CrossRef CAS.
- K. Shanmugaraj and S. A. John, New J. Chem., 2018, 42, 7223–7229 RSC.
- P. L. Zuo, D. L. Xiao, M. M. Gao, J. Peng, R. F. Pan, Y. Xia and H. He, Microchim. Acta, 2014, 181, 1309–1316 CrossRef CAS.
|
| This journal is © The Royal Society of Chemistry 2020 |
Click here to see how this site uses Cookies. View our privacy policy here.  Open Access Article


