 Open Access Article
Potentiometric and UV-Vis spectrophotometric titrations for evaluation of the antioxidant capacity of chicoric acid†
Haiqing Yia,
Yan Chenga,
Yu Zhanga,
Qingji Xie *a and
Xiaoping Yang
 b
b
aKey Laboratory of Chemical Biology and Traditional Chinese Medicine Research (Ministry of Education), College of Chemistry and Chemical Engineering, Hunan Normal University, Changsha 410081, China. E-mail: xieqj@hunnu.edu.cn
bKey Laboratory of Study and Discovery of Small Targeted Molecules of Hunan Province, School of Medicine, Hunan Normal University, Changsha 410013, China
First published on 24th March 2020
Abstract
The antioxidant capacity (AOC) of chicoric acid (ChA, the main antioxidant component of Echinacea) or an ethanol/water-extract of Echinacea flowers was determined by potentiometric and UV-Vis absorption spectrophotometric titrations with ABTS˙+ radical cations as the oxidizing probe. The potentiometric and spectrophotometric titration results agreed well with each other. The trolox-equivalent antioxidant capacity (TEAC) of ChA was found to be 5.00 ± 0.07 (potentiometry) and 4.81 ± 0.06 (spectrophotometry) at pH 7.4, and the TEAC value has been proven to be actually equal to the ratio of the stoichiometric ratio of the ABTS˙+–ChA redox reaction to that of the ABTS˙+–trolox redox reaction. The TEAC of the ethanol/water-extract of Echinacea flowers, expressed in mM (trolox) per gram per liter (Echinacea extract), was found to be 0.241 ± 0.006 mmol g−1 (potentiometry) and 0.240 ± 0.007 mmol g−1 (spectrophotometry) at pH 7.4. The stoichiometric ratio of the ABTS˙+–ChA redox reaction varied from 10.8 to 3.2, depending on the solution pH and the final ABTS˙+–ChA concentration ratio. However, the stoichiometric ratio of the ABTS˙+–trolox redox reaction remained ca. 2.0 at various solution-pH values and final ABTS˙+–trolox concentration ratios. The unusual stoichiometric ratio of the ABTS˙+–ChA redox reaction is examined by potentiometric/spectrophotometric titrations and cyclic voltammetry, clearly revealing the new mechanism of a rapid redox process followed by a slow redox process at pH 7.4 and 9.0 when the ABTS˙+–ChA molar concentration ratio is greater than 4. The electrochemistry methods coupled with spectrophotometry can conveniently and reliably provide important quantitative and qualitative information on redox chemistry, and are expected to find wider applications in accurately evaluating the redox activities of many other natural/synthesized antioxidants and oxidants.
1. Introduction
The oxidative stress resulting from reactive oxygen species is related to the pathogenesis of many diseases, and thus the anti-oxidation study is of good practical significance.1,2 To date, the methods of evaluating antioxidant capacity (AOC) mainly include UV-Vis absorption spectrophotometry, molecular fluorescence spectrophotometry and electrochemical methods.3–5 The widely employed oxidizing radical probes include the oxidized states of 2,2′-azino-bis(3-ethylbenzothiazoline-6-sulfonic acid) (ABTS, Scheme S1†),6 1,1-diphenyl-2-picrylhydrazyl (DPPH),7 and 2,2′-azobis[2-methylpropionamidine] dihydrochloride (AAPH).8 In general, electrochemical methods have the advantages of fast and simple operation, low instrument cost, high sensitivity, direct acquisition of quantitative information on various redox reactions, and high compatibility to colored or turbid solution systems which are usually difficult to be studied by optical approaches. There are many kinds of electrochemical methods, including electrolytic cell methods such as cyclic voltammetry (CV) and galvanic cell methods such as direct potentiometry and potentiometric titration, and appropriate electrochemical methods can be selected according to actual conditions. For example, Rebelo et al. employed differential pulse voltammetry and UV-Vis spectrophotometry to determine the AOCs of various wines.9 Gulaboski et al. employed CV to accurately detect the antioxidant properties of edible oils, as compared with UV-Vis spectrophotometry.10 Milardovic et al. measured the AOCs of coffee, fruit juice and other drinks by amperometry on interdigitated array microelectrodes.11 The AOCs of herbal extracts were determined by potentiometric titration by Ivanova et al.12 Martinez et al. determined the AOCs of wines with electrogenerated chlorine.13 Mitsuaki et al. developed an automatic potentiometric titrator to determine the radical scavenging activity of flavonoids by oxidized AAPH.14 In our opinion, the AOC systems can be divided into three categories from the potentiometric titration point of view. (1) Both the redox pairs of the oxidizing probe and the antioxidant are reversible, and thus the whole process of potentiometric titration can be quantitatively depicted by the Nernst equation. (2) Only one reversible redox pair exists between the oxidizing probe and the antioxidant, and thus the potentiometric titration only when the reversible redox pair takes effect can be quantitatively depicted by the Nernst equation. (3) Both the redox pairs of the oxidizing probe and the antioxidant are irreversible, making the whole process of potentiometric titration impossible to be quantitatively depicted by the Nernst equation, and thus the potentiometric titration, as we are aware, has not been used for AOC studies on the irreversible redox pairs of both the oxidizing probe and the antioxidant to date. Imaginably, the potentiometric titration method is good for the quantitative AOC evaluation of many systems, since this convenient and cost-effective method can quantitatively return valuable process information on the involved redox reactions. It is also expected that the potentiometry coupled with more common spectrophotometry should be able to provide important information on the redox chemistry of many systems in a mutual-authentication way.Echinacea (asters division) is a perennial herb with important immune stimulation and anti-inflammatory bioactivities, including anti-anxiety, anti-depression, antioxidation, anti-cytotoxicity, and anti-mutagenicity.15,16 Chicoric acid (ChA) is the main anti-oxidation component of Echinacea. ChA is a water-soluble phenolic acid with anti-inflammation, antiviral and anti-oxidation activities,17,18 and its chemical structure is shown in Scheme S1.† The reported methods for determining the AOC of ChA include UV-Vis spectrophotometry and square wave voltammetry.19–21 For example, Hu et al. determined the antioxidant activity of Echinacea root extract by spectrophotometry.21 The use of ABTS˙+ (the oxidized state of ABTS, Scheme S1†) to potentiometrically evaluate the AOC of ChA belongs to the first category of AOC systems defined as above, in which the whole process of potentiometric titration can be perfectly quantified by the Nernst equation. However, to the best of our knowledge, the ABTS˙+–ChA system has not been studied by potentiometric titration to date.
Herein, ABTS˙+ is selected as the oxidizing probe to evaluate the AOC of ChA or an ethanol/water-extract of Echinacea flowers by potentiometric and UV-Vis absorption spectrophotometric titrations. Trolox (Scheme S1†) is selected as the reference antioxidant. Potentiometry and spectrophotometry give AOC results well agreeable with each other. The unusual stoichiometric ratio of ABTS˙+–ChA redox reaction is found and discussed by potentiometric and spectrophotometric titrations as well as CV, revealing a rapid redox process followed by a slow redox process at appropriate solution-pH values and ABTS˙+–ChA molar concentration ratios.
2. Experimental section
2.1 Instrumentation and chemicals
All electrochemical experiments were performed on CHI660E electrochemical workstation (Shanghai Chenhua Instrument Co., Ltd.), and a conventional three-electrode electrolytic cell was employed. A disk glassy carbon electrode (GCE, 3.0 mm diameter) served as the working electrode, a graphite rod as the counter electrode, and a KCl-saturated calomel electrode (SCE) as the reference electrode. All potentials are reported versus SCE. UV-Vis spectrophotometric results were obtained from Shimadzu UV-2450 UV-Vis spectrophotometer (Japan).ABTS, ChA, trolox, and ethanol were purchased from Tokyo Chemical Industry Co., Ltd., Bide Pharmaceutical Co., Ltd., Hefei Bomei Biotechnology Co., Ltd., and Tianjin Fuyu Fine Chemical Co., Ltd., respectively. K2S2O8 and H2SO4 were purchased from Chinese Medicine Chemical Reagent Co. Ltd. 0.1 M phosphate buffer (pH 7.4, 0.1 M NaH2PO4 − Na2HPO4 + 0.1 M Na2SO4) was employed, and appropriate NaOH or H2SO4 aqueous solution was used to adjust its pH value when needed. Milli-Q ultrapure water (≥18 MΩ cm) was used throughout. An ABTS˙+ free radical cation solution was prepared by mixing ABTS (7 mM) and K2S2O8 (2.45 mM) at 1![[thin space (1/6-em)]](https://www.rsc.org/images/entities/char_2009.gif) :
:![[thin space (1/6-em)]](https://www.rsc.org/images/entities/char_2009.gif) 1 volume ratio,5 and the reaction was conducted at room temperature for ca. 12 h. According to the redox reaction of S2O82− with ABTS,22 2ABTS + S2O82− = 2ABTS˙+ + 2SO42−, ABTS should be in excess so that the interference from the unreacted S2O82− can be eliminated. The prepared ABTS˙+ solution was diluted with pH 7.4 phosphate buffer. Original ChA solution was prepared with a mixture of water and anhydrous ethanol at 1
1 volume ratio,5 and the reaction was conducted at room temperature for ca. 12 h. According to the redox reaction of S2O82− with ABTS,22 2ABTS + S2O82− = 2ABTS˙+ + 2SO42−, ABTS should be in excess so that the interference from the unreacted S2O82− can be eliminated. The prepared ABTS˙+ solution was diluted with pH 7.4 phosphate buffer. Original ChA solution was prepared with a mixture of water and anhydrous ethanol at 1![[thin space (1/6-em)]](https://www.rsc.org/images/entities/char_2009.gif) :
:![[thin space (1/6-em)]](https://www.rsc.org/images/entities/char_2009.gif) 1 volume ratio, and original trolox solution was prepared with anhydrous ethanol.
1 volume ratio, and original trolox solution was prepared with anhydrous ethanol.
2.2 Electrochemical experiments
The GCE was mechanically/chemically/electrochemically treated, followed by CV characterization using the electroactive ferrocyanide probe. First, the GCE was polished with fine sandpapers and 0.05 μm Al2O3 slurry, rinsed with ultrapure water and ultrasonically cleaned successively in water, ethanol and water. Second, the GCE was treated with concentrated sulfuric acid for 15 s. Third, the GCE was treated by CV in 0.1 M aqueous H2SO4 (from −1 V to 1 V, 0.05 V s−1) until the CV curve became reproducible. Finally, the GCE was placed in 0.2 M aqueous Na2SO4 containing 2.0 mM K4Fe(CN)6 for CV characterization, and the peak-to-peak separation (ΔEp) of Fe(CN)63−/4− redox electrochemistry was less than 75 mV (theoretically 56.5 mV at 25 °C for a reversible one-electron electrode reaction), indicating that the GCE had been well cleaned.Electrochemical experiments to evaluate AOC included CV and potentiometric titration. First, 0.100 mM ChA, 0.100 mM trolox or 0.100 mM ABTS was characterized by CV in 0.1 M phosphate buffer at different pH. Second, the prepared ABTS˙+ solution was diluted to 4 mL with 0.1 M phosphate buffer (ca. 87.5 μM final ABTS˙+ concentration), and the open-circuit potential (OCP) was monitored. ChA was then titrated into the ABTS˙+ solution, until a potential-decrease jump and then gradual potential decreases were observed. Similarly, trolox as a reference was titrated into the ABTS˙+ solution to obtain the potentiometric titration curve. The redox reaction between the antioxidant (AO, here ChA or trolox) and the ABTS˙+ radical cations can be depicted by eqn (1),23
| bABTS˙+ + AOred → bABTS + AOox | (1) |
The OCP here should obey the Nernst equation, E = E0′ + (RT/nF)ln(cox/cred), where E represents the OCP during the experiment, E0′ is the formal potential of the redox pair, n is the number of electrons transferred, F is the Faraday constant (96![[thin space (1/6-em)]](https://www.rsc.org/images/entities/char_2009.gif) 485.3 C mol−1), R is the gas constant (8.314 J mol−1 K−1), T is the thermodynamic temperature, and cox and cred are the concentrations of oxidized and reduced states, respectively. Note that, for the reduction titration (additions of antioxidant into ABTS˙+ solution), in the first stage of potentiometric titration with excess ABTS˙+, the ABTS˙+/ABTS redox pair takes effect, but in the second stage of potentiometric titration (after the potential-decrease jump), ABTS˙+ is exhausted, and thus the redox pair of antioxidant (trolox or ChA) takes effect instead.
485.3 C mol−1), R is the gas constant (8.314 J mol−1 K−1), T is the thermodynamic temperature, and cox and cred are the concentrations of oxidized and reduced states, respectively. Note that, for the reduction titration (additions of antioxidant into ABTS˙+ solution), in the first stage of potentiometric titration with excess ABTS˙+, the ABTS˙+/ABTS redox pair takes effect, but in the second stage of potentiometric titration (after the potential-decrease jump), ABTS˙+ is exhausted, and thus the redox pair of antioxidant (trolox or ChA) takes effect instead.
The antioxidant activity of a pure (single-component) antioxidant is expressed as the trolox-equivalent antioxidant capacity (TEAC),24 which represents the concentration ratio of trolox to a tested pure antioxidant just when the concentration of trolox (ctrolox, in μM) shows the same antioxidant activity as that of the tested antioxidant (cAO, in μM), as expressed in eqn (2).
| TEAC = ctrolox/cAO = (ΔcABTS˙+/btrolox)/(ΔcABTS˙+/bAO) = bAO/btrolox | (2) |
Eqn (2) reveals that the TEAC value is actually equal to the ratio of two redox reaction stoichiometric ratios, which will be quantitatively proven from both potentiometry and spectrophotometry in this research for the first time. In principle, eqn (2) that involves the redox reaction stoichiometric ratios can be reasonably extended to the systems of other pure target/reference antioxidants.
2.3 UV-Vis spectrophotometric experiment
UV-Vis spectrophotometry has been widely used for antioxidant activity evaluation.5,25 The ABTS˙+ solution was appropriately diluted with pH 7.4 phosphate buffer, which gave an absorption peak at 734 nm that is interference-free in the tested systems. The reaction of ChA or trolox at a certain concentration with ABTS˙+ free radical cations should result in the absorbance decrease from the original absorbance A0 to the final absorbance A1 after the reaction is completed. The absorbance is proportional to the ABTS˙+ concentration according to Lambert–Beer's law, A = εbc, where ε is the molar absorption coefficient (15![[thin space (1/6-em)]](https://www.rsc.org/images/entities/char_2009.gif) 000 L mol−1 cm−1 for ABTS˙+),25 b is the optical path (here 1 cm), and c is the concentration of ABTS˙+ radical cations. The AOC can be expressed as the TEAC defined in eqn (2).
000 L mol−1 cm−1 for ABTS˙+),25 b is the optical path (here 1 cm), and c is the concentration of ABTS˙+ radical cations. The AOC can be expressed as the TEAC defined in eqn (2).
2.4 AOC measurement of Echinacea extract
The extraction of active components from Echinacea was conducted as reported,20 with some modifications. The dried flowers were obtained from a local market, 5 g of which was refluxed at 80 °C in 150 mL mixture of water and anhydrous ethanol (1![[thin space (1/6-em)]](https://www.rsc.org/images/entities/char_2009.gif) :
:![[thin space (1/6-em)]](https://www.rsc.org/images/entities/char_2009.gif) 4 volume ratio) for 4 h. The obtained extract was filtered through a filter paper and then centrifuged at 10
4 volume ratio) for 4 h. The obtained extract was filtered through a filter paper and then centrifuged at 10![[thin space (1/6-em)]](https://www.rsc.org/images/entities/char_2009.gif) 000 rpm for 10 min. The ethanol/water extract was dried by a rotatory evaporator at 60 °C. 0.700 g extract was dissolved in 200 mL of ethanol and water (1
000 rpm for 10 min. The ethanol/water extract was dried by a rotatory evaporator at 60 °C. 0.700 g extract was dissolved in 200 mL of ethanol and water (1![[thin space (1/6-em)]](https://www.rsc.org/images/entities/char_2009.gif) :
:![[thin space (1/6-em)]](https://www.rsc.org/images/entities/char_2009.gif) 1) mixture, which was stored at 4 °C before use.
1) mixture, which was stored at 4 °C before use.
The AOC value of Echinacea extract as a mixture of various known and unknown substances including antioxidants is also evaluated by the TEAC value (mmol g−1) in mM of equivalent trolox per gram per liter of extract,26 as shown in eqn (3).
| TEAC (mmol g−1) = Ctrolox/CAO = (ΔC/btrolox)/(Csample/D) | (3) |
![[thin space (1/6-em)]](https://www.rsc.org/images/entities/char_2009.gif) :
:![[thin space (1/6-em)]](https://www.rsc.org/images/entities/char_2009.gif) 1 volume ratio, so Csample = 3.50 g L−1), and D is the dilution ratio of the prepared extract sample at the end point of Echinacea extract titration (here 4.00 mL original ABTS˙+ solution consumed ca. 0.123 mL Echinacea extract at the end point of titration, thus D ≈ (4.00 + 0.123) mL/0.123 mL ≈ 33.5).
1 volume ratio, so Csample = 3.50 g L−1), and D is the dilution ratio of the prepared extract sample at the end point of Echinacea extract titration (here 4.00 mL original ABTS˙+ solution consumed ca. 0.123 mL Echinacea extract at the end point of titration, thus D ≈ (4.00 + 0.123) mL/0.123 mL ≈ 33.5).
3. Results and discussion
3.1 Potentiometric titration for AOC evaluation
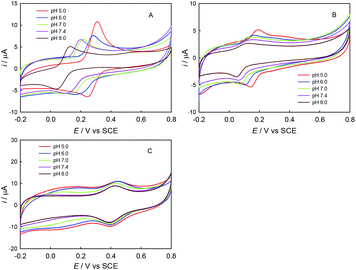
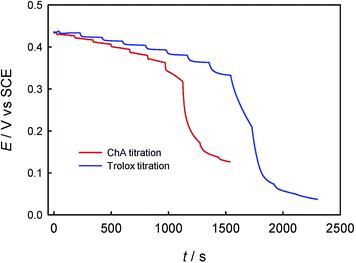
First, the electrochemical behaviors of ABTS, trolox and ChA were studied by CV. As shown in Fig. 1, the redox peak potentials of ChA and trolox negatively shifted with the solution-pH increase, and the solution-pH increase also decreased the peak currents, but the peak potentials/currents of ABTS remained almost the same at various pH values, demonstrating that both the ChA electrochemistry and the trolox electrochemistry are proton-transfer coupled electron-transfer processes dependent on solution-pH,27 but the ABTS is a pure electron-transfer process independent of solution-pH.28,29 At pH 7.4, the formal potentials of ChA, trolox and ABTS redox pairs are ca. 0.15 V, 0.11 V and 0.43 V, respectively, accompanied with their relatively large peak currents. Considering that the physiological pH and the larger formal-potential difference between ABTS redox pair and ChA (or trolox) redox pair that is more favorable for the redox potentiometric titration, pH 7.4 is selected as the optimized pH.Second, the potentiometric titration of ABTS˙+ with ChA or trolox was studied. Fig. 2 shows the potentiometric titration curve for ChA or trolox. Obviously, the concentration can be evaluated from the OCP and the Nernst equation. In the initial ABTS˙+ + ABTS solution (0–40 s), the concentration of ABTS˙+ is calculated to be 47.5 μM (OCP = 0.434 V at 0 s, blue line) or 43.8 μM (OCP = 0.430 V at 0 s, red line). The initial total ABTS˙+ plus ABTS concentration should be the original ABTS concentration of 87.5 μM. In the first stage of potentiometric titration with ChA (40 to ca. 1250 s) or trolox (20 to ca. 1750 s), the OCP should be governed by the ABTS redox pair, which gradually and finally rapidly decreased due to the redox exhaustion of ABTS˙+. In the second stage of potentiometric titration with ChA (ca. 1250–1550 s) or trolox (ca. 1750–2300 s), the OCP should be governed by the ChA or trolox redox pair, which gradually decreased in the recording time window. The potentiometric titration curves here show similar shapes to that for the potentiometric titration of wine into chlorine.13
The redox reaction stoichiometry ratio of ABTS˙+ to ChA (bChA) or trolox (btrolox) can be estimated from the Nernst equation and the end-point potential. At the end point for each, the initial 47.5 μM ABTS˙+ consumed 4.48 μM ChA, and the initial 43.8 μM ABTS˙+ consumed 21.0 μM trolox, giving bChA = 10.6 (10.4 ± 0.4 for three parallel experiments) and btrolox = 2.09 (2.11 ± 0.1 for three parallel experiments). The obtained btrolox values agree well with those reported for trolox.22 The obtained bChA values are notably larger than the number of four phenolic hydroxyl groups in ChA structure, which will be discussed later. Thygesen et al. obtained bChA = 4 with DPPH˙ radical in ethanol solution.30 From the above consumption of ChA or trolox by ABTS˙+ at the end point, we can calculate the TEAC value to be TEAC = ctrolox/cChA = (22.7 μM)/(4.48 μM) = 5.07, or TEAC = bChA/btrolox = 10.6/2.09 = 5.07, proving that the c-ratio-based and b-ratio-based TEAC definitions in eqn (2) are both correct in potentiometry. Three parallel experiments give TEAC = 5.00 ± 0.07.
3.2 UV-Vis spectrophotometry for AOC evaluation
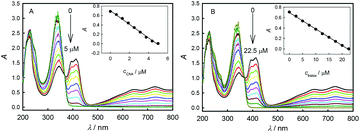
Fig. 3 shows the absorbance responses to the additions of ChA or trolox into ABTS˙+ solution. The original peak absorbance of ABTS˙+ at 734 nm was recorded. According to Lambert–Beer's law, the original ABTS˙+ concentration is calculated to be 46.7 μM in Fig. 3A and 46.8 μM in Fig. 3B, respectively. With the additions of antioxidant, the consumption of ABTS˙+ led to the absorbance decrease.23 Insets show good linearity between the peak absorbance of ABTS˙+ at 734 nm and the concentration of ChA or trolox, indicating a proportionable redox reaction of ABTS˙+ with each antioxidant under the titration conditions. At the end points just when the peak absorbance of ABTS˙+ at 734 nm drops to zero, the initial 46.7 μM ABTS˙+ consumed 4.68 μM ChA, and the initial 46.8 μM ABTS˙+ consumed 22.2 μM trolox. According to eqn (1), the b value is bChA = 9.98 (10.1 ± 0.1 for three parallel experiments) or btrolox = 2.11 (2.13 ± 0.03 for three parallel experiments). The TEAC value is calculated to be TEAC = ctrolox/cChA = (22.2 μM)/(4.68 μM) = 4.74, or TEAC = bChA/btrolox = 9.98/2.11 = 4.73, also proving that the c-ratio-based and b-ratio-based TEAC definitions in eqn (2) are both correct in spectrophotometry. Three parallel experiments give TEAC = 4.81 ± 0.06. Obviously, both potentiometric and spectrophotometric titration methods give well comparable b or TEAC values.As shown in Fig. S1† (panels A and B), a linear relationship is obtained between the concentrations of unreacted ABTS˙+ and added trolox in a potentiometric titration experiment (y = 47.8 − 2.39x, R2 = 0.995, panel A), or in a spectrophotometric titration experiment (y = 47.0 − 2.15x, R2 = 0.998, panel B), proving again that the potentiometric and spectrophotometric titration methods can yield well comparable results. We also potentiometrically and spectrophotometrically titrated ABTS˙+ at different concentrations and calculated the ChA concentrations consumed at the end points. Fig. S1C† shows the correlation of consumed ChA concentrations found by spectrophotometric and potentiometric titrations. A linear relationship of y = −0.270 + 0.958x (R2 = 0.997) is obtained, and the slope of 0.958 indicates the good agreement between the two methods. In our experiments, 1.50 μM ABTS˙+ solution still had a stable and reasonable potential, and 7.00 μM ABTS˙+ solution had a net absorbance of 0.003 at 734 nm, indicating that potentiometric titration should have its detection limit somewhat lower than spectrophotometric titration here. Anyway, both potentiometric and spectrophotometric titration methods give well agreeable results for AOC evaluation.
3.3 Discussion on the unusual stoichiometric ratio of the ABTS˙+–ChA redox reaction
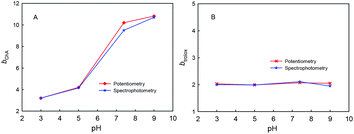
The four phenolic hydroxyl groups in ChA structure and the one phenolic hydroxyl group in trolox can be easily oxidized by ABTS˙+, so the b values simply for phenolic hydroxyl oxidation may be 4 for ChA and 1 for trolox. However, the redox stoichiometric ratios obtained as above are ca. 10 for ChA and ca. 2 for trolox. Unusually “overlarge” b values have also been reported for AOC evaluations of gallic acid and quercetin.24,27 We believe that the deep oxidation of ChA after the expected oxidation of phenolic hydroxyl groups by ABTS˙+ takes place here, which results in the “overlarge” stoichiometric ratio. In this research, the effects of solution pH, concentration ratio, and dissolved oxygen were studied as follows.First, Fig. 4 shows the dependence of bChA and btrolox on the solution pH (3.0, 5.0, 7.0, or 9.0) obtained from potentiometric and spectrophotometric titrations. bChA increases from 3.2 to 10.8 with the pH increase, but btrolox remains almost the same at various pH values (btrolox = 2.12 ± 0.09 for potentiometry and btrolox = 2.12 ± 0.03 for spectrophotometry). Both potentiometric and spectrophotometric titrations give well agreeable bChA (or btrolox) values, proving the reliability of data obtained from both methods.
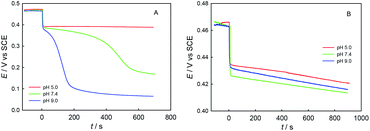
Fig. 5 shows the potentiometric titration kinetics curves for a single dose of ChA (or trolox) into 0.1 M phosphate buffer at different pH (5.0, 7.4, or 9.0) containing 0.1 M Na2SO4, 117 μM ABTS˙+ and 58.0 μM ABTS. For the ChA titrations at pH 5.0, 7.4, and 9.0 shown in Fig. 5A, we observed a very rapid potential-decrease to ca. 0.38 V at each pH for the first ca. 10 s, which may be caused by the rapid oxidation of the four phenolic hydroxyl groups of ChA by ABTS˙+. Then, the potential became almost steady at pH 5.0, but the potential gradually (gradual consumption of ABTS˙+) and then rapidly (approaching to the full exhaustion of ABTS˙+) decreased at pH 7.4 or 9.0, demonstrating the deep oxidation of ChA by ABTS˙+ at pH 7.4 and 9.0. In another sentence, the ABTS˙+–ChA redox chemistry at pH 7.4 or 9.0 is featured by a rapid redox process followed by a slow redox process. In contrast, as shown in Fig. 5B, the trolox titrations at pH 5.0, 7.4, and 9.0 gave almost the same titration kinetics curves, demonstrating that the ABTS˙+–trolox redox chemistry is simply a rapid redox process at pH 5.0, 7.4, or 9.0.
As shown in Fig. S2,† while the redox peaks of ABTS˙+ change negligibly in all cases, the redox peaks of ChA at pH 7.4 or 9.0 decreased with time after adding 25 μM ChA into 117 μM ABTS˙+, but the redox peaks of ChA changed very slightly at pH 5.0, implying that the electroactive ChA and its oxidized state of quinones have been gradually turned into the electro-inactive forms in the recording potential window due to the deep oxidation by ABTS˙+ at pH 7.4 or 9.0. Fig. S3† shows no redox peaks of trolox at different pH and different time, implying that the reaction between trolox and ABTS˙+ is simply a rapid redox process, and the original electroactive form of trolox is absent after the ABTS˙+–trolox redox reaction. Fig. S4–S6† show that the peak current drops slightly with time in 0.1 M phosphate buffer + 0.1 M Na2SO4 solution solely containing ABTS˙+ + ABTS (or trolox, or ChA). It is seen that without the ABTS˙+–ChA (or ABTS˙+–trolox) redox reaction, the redox peaks of ABTS˙+ (or trolox, or ChA) changed rather slowly with time at various pH. Hence, the notable time-dependent decrease of ChA redox peaks in the presence of ABTS˙+ should result from the deep oxidation of ChA by ABTS˙+ at pH 7.4 and 9.0.
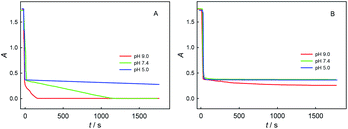
Fig. 6 shows the spectrophotometric titration kinetics curves for a single dose of ChA (or trolox) into 0.1 M phosphate buffer at different pH (5.0, 7.4, and 9.0) containing 0.1 M Na2SO4, 117 μM ABTS˙+ and 58.0 μM ABTS. For the ChA titrations at pH 5.0, 7.4, and 9.0 shown in Fig. 6A, we observed a very rapid absorbance-decrease to ca. 0.35 at each pH. Then, the absorbance became almost steady at pH 5.0, but the absorbance gradually decreased to 0 at pH 7.4 and 9.0. As shown in Fig. 6B, the trolox titrations at pH 5.0, 7.4, and 9.0 gave the titration kinetics curves almost of the same trends as those in Fig. 5B, confirming the conclusion of deep oxidation of ChA by ABTS˙+ at pH 7.4 and 9.0 drawn from the above potentiometric titrations.
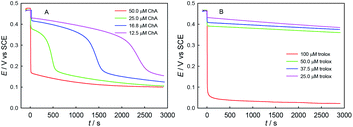
Second, we explored the influence of ABTS˙+–antioxidant concentration ratio, as shown in Fig. 7. As expected, the redox consumption of ABTS˙+ can be accelerated by the increase of ChA or trolox concentration. At the selected conditions of ABTS˙+ and ChA, ABTS˙+ can be fully redox-exhausted (below 0.2 V) by ChA, through either a single rapid redox process (50.0 μM ChA) or a rapid redox process followed by a slow redox process (25.0, 16.8, or 12.5 μM ChA). In contrast, solely a rapid redox process was observed for all the trolox titrations, and thus the btrolox value should be independent of the ABTS˙+–trolox concentration ratio. As expected, the observations reasonably imply that a high ABTS˙+–ChA concentration ratio is beneficial for the deep oxidation of ChA and then increasing the bChA value.
Third, in order to explore the influence of dissolved oxygen, we conducted control experiments under nitrogen saturated and air saturated conditions, as shown in Fig. S7.† The ChA (or trolox) titration kinetics curves under nitrogen saturated and air saturated conditions agree acceptably with each other, indicating that oxygen is not an important factor responsible for the deep oxidation of ChA in this research.
The above experiments demonstrate that the unusually large bChA value should result from the deep oxidation of ChA by ABTS˙+ radical cations. The solution pH determines the occurrence of such a deep oxidation (negligible at pH 5.0, but visible at pH 7.4 and notable at pH 9.0). At pH 7.4, a high ABTS˙+–ChA concentration ratio is beneficial for the deep oxidation of ChA. The deep oxidation takes place in both nitrogen saturated and air saturated solutions at pH 7.4. Here, we have demonstrated that the potentiometric/spectrophotometric titrations can be used to monitor the deep-oxidation process of ChA in a real-time manner. The exact reaction mechanism for the pH-dependent oxidation of ChA by ABTS˙+ has not been reported to date, as we are aware. According to the mechanisms reported for the complicated oxidations of catechol structure-containing caffeic acid, chlorogenic acid, catechol, and protocatechuic by some free radicals,31–34 the oxidation of ChA at pH 7.4 and pH 9.0 might similarly involve the following possible two-step mechanism. (1) Catechol is oxidized to (semi)quinone by the oxidant; and (2) the nucleophilic attack of the catechol reactant to (semi)quinone may occur to form dimers or polymers, leading to the reproduction of phenolic hydroxyl structures and an overlarge b value. Possible mechanisms of the oxidation of a catechol structure at high pH are shown and explained in Scheme S2.† Moreover, the oxidation of catechol structure is coupled with proton transfer, and elevating the solution pH can also facilitate the ionization of catechol structure that is somewhat acidic, making the oxidation and nucleophilic reactions easier at high pH values.35 In contrast, all the comparison experiments of trolox titrations reveal that the ABTS˙+–trolox redox chemistry is simply a rapid process, thus giving a constant btrolox value of ca. 2.0 in all cases. Accordingly, trolox can be used as a stable reference for antioxidation researches.
3.4 Evaluation of the TEAC of Echinacea extract
The results of potentiometric and spectrophotometric titrations of Echinacea flowers extract at pH 7.4 are shown in Fig. S8.† According to eqn (3) and the titration results, the TEAC value of the extract is calculated to be TEAC = (ΔC/btrolox)/(Csample/D) = (0.0539/2.11)/(3.50/33.5) = 0.245 mmol g−1 (0.241 ± 0.006 mmol g−1 for three parallel experiments) for potentiometric titration, or TEAC = (0.0547/2.13)/(3.50/33.3) = 0.244 mmol g−1 (0.240 ± 0.007 mmol g−1 for three parallel experiments) for spectrophotometric titration. The TEAC values obtained from potentiometric titration are in good agreement with those from spectrophotometric titration. The obtained TEAC values agree acceptably with the TEAC values of 0.278 ± 0.004 mmol g−1 reported for the aqueous-alcoholic extract of a mixture of medicinal herb substances including licorice root and Echinacea rhizomes.364. Conclusions
In summary, a potentiometric titration method with ABTS˙+ as the oxidizing probe has been suggested for evaluating the AOC of ChA and an ethanol/water-extract of Echinacea flowers for the first time. The potentiometric and spectrophotometric titration results agree well with each other. We have also found that the TEAC value here for ChA is actually equal to the ratio of the stoichiometric ratio of ABTS˙+–ChA redox reaction to that of ABTS˙+–trolox redox reaction, and the new insight into TEAC may be reasonably extended to the systems of other pure target/reference antioxidants. The unusual stoichiometric ratio of ABTS˙+–ChA redox reaction has been found and discussed by potentiometric/spectrophotometric titrations and CV for the first time, which can be ascribed to the deep oxidation of ChA by ABTS˙+. Although the complicated molecular mechanism of deep oxidation of ChA by ABTS˙+ requires adequate structural analyses to be made clearer in the future, the presented methods and relevant discussion should help the quantitative AOC evaluation of many antioxidants probed by many free radicals and the observation/confirmation of possible deep-oxidation behaviors.Conflicts of interest
There are no conflicts to declare.Acknowledgements
This work was supported by the National Natural Science Foundation of China (21675050, 21475041, 21775137), Hunan Lotus Scholars Program (2011), and Foundation of the Science & Technology Department of Hunan Province (2016SK2020).Notes and references
- W. Droge, Physiol. Rev., 2002, 82, 47–95 CrossRef CAS PubMed.
- B. Badhani, N. Sharma and R. Kakkar, RSC Adv., 2015, 5, 27540–27557 RSC.
- R. L. Prior, X. L. Wu and K. Schaich, J. Agric. Food Chem., 2005, 53, 4290–4302 CrossRef CAS PubMed.
- G. Ziyatdinova, E. Kozlova and H. Budnikov, Food Chem., 2016, 196, 405–410 CrossRef CAS PubMed.
- N. J. Miller, C. Rice-Evans, M. J. Davies, V. Gopinathan and A. Milner, Clin. Sci., 1993, 84, 407–412 CrossRef CAS PubMed.
- O. Erel, Clin. Biochem., 2004, 37, 277–285 CrossRef CAS PubMed.
- D. J. Huang, B. X. Ou and R. L. Prior, J. Agric. Food Chem., 2005, 53, 1841–1856 CrossRef CAS PubMed.
- J. R. Soares, T. C. Dinis, A. P. Cunha and L. M. Almeida, Free Radical Res., 1997, 26, 469–478 CrossRef CAS PubMed.
- M. J. Rebelo, R. Rego, M. Ferreira and M. C. Oliveira, Food Chem., 2013, 141, 566–573 CrossRef CAS PubMed.
- R. Gulaboski, V. Mirceski and S. Mitrev, Food Chem., 2013, 138, 116–121 CrossRef CAS PubMed.
- S. Milardovic, I. Kerekovic, R. Derrico and V. Rumenjak, Talanta, 2007, 71, 213–220 CrossRef CAS PubMed.
- A. V. Ivanova, E. L. Gerasimova and E. R. Gazizullina, Anal. Chim. Acta, 2019, 1046, 69–76 CrossRef CAS PubMed.
- S. Martinez, L. Valek, J. Piljac and M. Metikos-Hukovic, Eur. Food Res. Technol., 2005, 220, 658–661 CrossRef CAS.
- M. Sano, R. Yoshida, M. Degawa, T. Miyase and K. Yoshino, J. Agric. Food Chem., 2003, 51, 2912–2916 CrossRef CAS PubMed.
- W. Dorsch, Z. Aerztl. Fortbild., 1996, 90, 117–122 CAS.
- S. M. Ross, Holist. Nurs. Pract., 2016, 30, 122–125 CrossRef PubMed.
- Y. Sahan, O. Gurbuz, M. Guldas, N. Degirmencioglu and A. Begenirbas, Food Chem., 2017, 217, 483–489 CrossRef CAS PubMed.
- Y. Wang, Z. Diao, J. Li, B. Ren, D. Zhu, Q. Liu, Z. Liu and X. Liu, RSC Adv., 2017, 7, 36149–36162 RSC.
- C. Bergeron, S. Gafner, L. L. Batcha and C. K. Angerhofer, J. Agric. Food Chem., 2002, 50, 3967–3970 CrossRef CAS PubMed.
- E. F. Newair, R. Abdel-Hamid and P. A. Kilmartin, Electroanalysis, 2017, 29, 1131–1140 CrossRef CAS.
- C. Hu and D. D. Kitts, J. Agric. Food Chem., 2000, 48, 1466–1472 CrossRef CAS PubMed.
- I. V. Geletii, G. G. A. Balavoine, O. N. Efimov and V. S. Kulikova, Bioorg. Khim., 2002, 28, 551–566 Search PubMed.
- A. V. Ivanova, E. L. Gerasimova and K. Z. Brainina, Crit. Rev. Anal. Chem., 2015, 45, 311–322 CrossRef CAS PubMed.
- X. Tian and K. M. Schaich, J. Agric. Food Chem., 2013, 61, 5511–5519 CrossRef CAS PubMed.
- R. Re, N. Pellegrini, A. Proteggente, A. Pannala, M. Yang and C. Rice-Evans, Free Radical Biol. Med., 1999, 26, 1231–1237 CrossRef CAS PubMed.
- A. N. Tufan, S. Baki, K. Guclu, M. Ozyurek and R. Apak, J. Agric. Food Chem., 2014, 62, 7111–7117 CrossRef CAS PubMed.
- E. F. Newair, R. Abdel-Hamid and P. A. Kilmartin, Electroanalysis, 2017, 29, 850–860 CrossRef CAS.
- H. Zeng, Z. Tang, L. Liao, J. Kang and Y. Chen, Chin. J. Chem. Phys., 2011, 24, 653–658 CrossRef CAS.
- E. Kibena, U. Maeeorg, L. Matisen and K. Tammeveski, J. Electroanal. Chem., 2011, 661, 343–350 CrossRef CAS.
- L. Thygesen, J. Thulin, A. Mortensen, L. H. Skibsted and P. Molgaard, Food Chem., 2007, 101, 74–81 CrossRef CAS.
- H. Hotta, H. Sakamoto, S. Nagano, T. Osakai and Y. Tsujino, Biochim. Biophys. Acta, 2001, 1526, 159–167 CrossRef CAS.
- H. Hotta, S. Nagano, M. Ueda, Y. Tsujino, J. Koyama and T. Osakai, Biochim. Biophys. Acta, 2002, 1572, 123–132 CrossRef CAS.
- H. Hotta, M. Ueda, S. Nagano, Y. Tsujino, J. Koyama and T. Osakai, Anal. Biochem., 2002, 303, 66–72 CrossRef CAS PubMed.
- S. Saito and J. Kawabata, Biosci., Biotechnol., Biochem., 2008, 72, 1877–1880 CrossRef CAS PubMed.
- Y. L. Li, M. L. Liu, C. H. Xiang, Q. J. Xie and S. Z. Yao, Thin Solid Films, 2006, 497, 270–278 CrossRef CAS.
- P. A. Struchkov, V. L. Beloborodov, I. R. Il'yasov, A. M. Savvatee, V. K. Kolkhir and I. V. Voskoboinikova, Pharm. Chem. J., 2016, 50, 486–490 CrossRef CAS.
Footnote |
| † Electronic supplementary information (ESI) available. See DOI: 10.1039/d0ra01248c |
| This journal is © The Royal Society of Chemistry 2020 |

