 Open Access Article
A two-enzyme cascade reaction consisting of two reaction pathways. Studies in bulk solution for understanding the performance of a flow-through device with immobilised enzymes†
Nicolas Ghéczy‡
 a,
Kai Sasaki‡§
 a,
Makoto Yoshimoto
 ab,
Sajad Pour-Esmaeil¶
 a,
Martin Kröger
 c,
Pasquale Stano
 d and
Peter Walde
 *a
*a
aLaboratory for Multifunctional Materials, Department of Materials, ETH Zürich, Vladimir-Prelog-Weg 5, CH-8093 Zürich, Switzerland. E-mail: peter.walde@mat.ethz.ch
bDepartment of Applied Chemistry, Yamaguchi University, Tokiwadai 2-16-1, Ube 755-8611, Japan
cPolymer Physics, Department of Materials, ETH Zürich, Leopold-Ruzicka-Weg 4, CH-8093 Zürich, Switzerland
dDepartment of Biological and Environmental Sciences and Technologies (DiSTeBA), University of Salento, Ecotekne, 73100 Lecce, Italy
First published on 18th May 2020
Abstract
Enzyme-catalysed cascade reactions in flow-through systems with immobilised enzymes currently are of great interest for exploring their potential for biosynthetic and bioanalytical applications. Basic studies in this field often aim at understanding the stability of the immobilised enzymes and their catalytic performance, for example, in terms of yield of a desired reaction product, analyte detection limit, enzyme stability or reaction reproducibility. In the work presented, a cascade reaction involving the two enzymes bovine carbonic anhydrase (BCA) and horseradish peroxidase (HRP) – with hydrogen peroxide (H2O2) as HRP “activator” – was first investigated in great detail in bulk solution at pH = 7.2. The reaction studied is the hydrolysis and oxidation of 2′,7′-dichlorodihydrofluorescein diacetate (DCFH2-DA) to 2′,7′-dichlorofluorescein (DCF), which was found to proceed along two reaction pathways. This two-enzyme cascade reaction was then applied for analysing the performance of BCA and HRP immobilised in glass fiber filters which were placed inside a filter holder device through which a DCFH2-DA/H2O2 substrate solution was pumped. Comparison was made between (i) co-immobilised and (ii) sequentially immobilised enzymes (BCA first, HRP second). Significant differences for the two arrangements in terms of measured product yield (DCF) could be explained based on quantitative UV/vis absorption measurements carried out in bulk solution. We found that the lower DCF yield observed for sequentially immobilised enzymes originates from a change in one of the two possible reaction pathways due to enzyme separation, which was not the case for enzymes that were co-immobilised (or simultaneously present in the bulk solution experiments). The higher DCF yield observed for co-immobilised enzymes did not originate from a molecular proximity effect (no increased oxidation compared to sequential immobilisation).
1. Introduction
The study of enzymatic cascade reactions taking place inside dispersed compartments or on solid surfaces is currently attracting a lot of attention.1–19 There are at least two reasons for the interest in these systems: (i) the possible mimicking of enzymatic cascade reactions as they occur in vivo towards a better understanding of the efficiency of metabolic reactions; and (ii) the development of selective, stable and reusable bioanalytical and biosynthetic devices. Well-studied bioanalytical systems are two-enzyme cascade reactions, i.e., coupled enzyme assays involving an oxidase and a peroxidase. Examples are glucose oxidase (abbreviated as GOD or GOx) and horseradish peroxidase (HRP) for the quantification of D-glucose,20,21 or three-enzyme cascade reactions involving β-galactosidase (β-Gal), GOD, and HRP for the quantification of lactose.20,22 In both cases, quantification of the analyte (D-glucose or lactose) is achieved through a determination of hydrogen peroxide (H2O2) which is formed in stoichiometric amounts as side product in the oxidation of D-glucose to glucono-δ-lactone with GOD/O2. The formed H2O2, which is the key intermediate that links the two reactions, rapidly oxidises HRP which in turn oxidises a chosen, suitable reducing substrate that is added. This reducing substrate often is selected such that its one-electron oxidation (or possible rapid follow-up reactions) can be monitored spectrophotometrically. Well known examples are ABTS2−(NH4+)2 (2,2′-azino-bis(3-ethylbenzothiazoline-6-sulfonic acid)diammonium salt),23 TMB (3,3′,5,5′-tetramethylbenzidine),24 or OPD (ortho-phenylenediamine = 1,2-diaminobenzene).25The work presented consists of two parts. In the first part, we aimed at understanding in detail a two-enzyme cascade reaction in bulk solution at pH = 7.2 involving BCA (bovine erythrocyte carbonic anhydrase) and HRP. The substrates used were 2′,7′-dichlorodihydrofluorescein diacetate (DCFH2-DA) and H2O2 (the results are presented and discussed in Section 3.1.). This cascade reaction differs from the ones mentioned above, and is related to a well-known assay applied in experimental cell physiology to determine the presence of reactive oxygen and nitrogen species (ROS and RNS) inside cells.26–34 In that well-known assay, the focus is on determining the presence of ROS or RNS. In the first part of our work, however, the goal was not to apply the cascade reaction to such an assay, but to understand the reaction catalysed by BCA and HRP in order to later understand the behavior of differently immobilized BCA and HRP.
From a mechanistic viewpoint, the cascade reaction we investigated consists of two possible reaction pathways involving more than five different reaction steps, as outlined in detail in the following. In contrast to the conventional oxidase–peroxidase coupled assays, H2O2 does not play the role of an in situ formed linking intermediate, but is one of the added substrates. The cascade reaction is summarised in Scheme 1 (complete DCFH2-DA hydrolysis before oxidation, as known from literature) and Scheme 2 (simplified representation including oxidation upon partial hydrolysis of DCFH2-DA, as found in this work). Schemes 1 and 2 include the chemical structures of the compounds dominating at pH = 7.2 (see also Fig. S-1, ESI†).
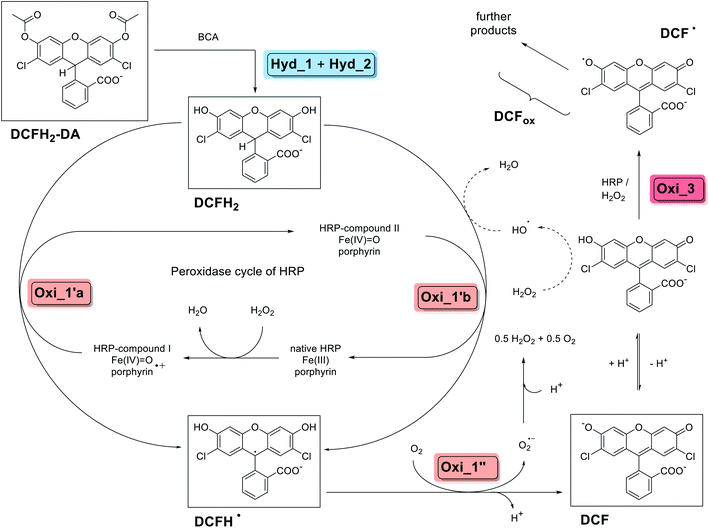 | ||
| Scheme 1 Overview about the two-enzyme cascade reaction analysed and applied in this work, describing the situation for an initial complete hydrolysis of DCFH2-DA to DCFH2, followed by oxidation using HRP/H2O2 (pathway 1 of Scheme 2). The scheme summarises key findings of a number of previous detailed studies (not using BCA, but other esterases), see for example (Rota et al., 1999)44 and (Wardman, 2007).31 Steps Hyd_1 and Hyd_2 are the BCA-catalysed hydrolyses of DCFH2-DA (λmax = 260 nm) to DCFH2 (λmax = 287 nm). Steps Oxi_1′a and Oxi_1′b are the two possible one-electron oxidations of DCFH2 to DCFH˙ by HRP-compound I and HRP-compound II, respectively, which are followed by the one-electron oxidation (step Oxi_1′′) of DCFH˙ to DCF (λmax = 503 nm). Step Oxi_3 is the HRP/H2O2-catalysed oxidation of DCF to DCF˙ and possible follow-up reactions (yielding further products, altogether abbreviated as DCFox). Non-enzymatic formation of hydroxyl radicals (HO˙) from H2O2 may occur in the presence of DCF.51 The key compounds of the reactions, DCFH2-DA, DCFH2, DCFH˙, DCF, and DCF˙, are given with the chemical structures of the dominating species at the pH conditions of the reaction (pH = 7.2), see text for details. For information about the different acid–base equilibria of DCFH2, DCFH˙ and DCF, see (Wrona and Wardman, 2006)48 and Fig. S-1, ESI.† | ||
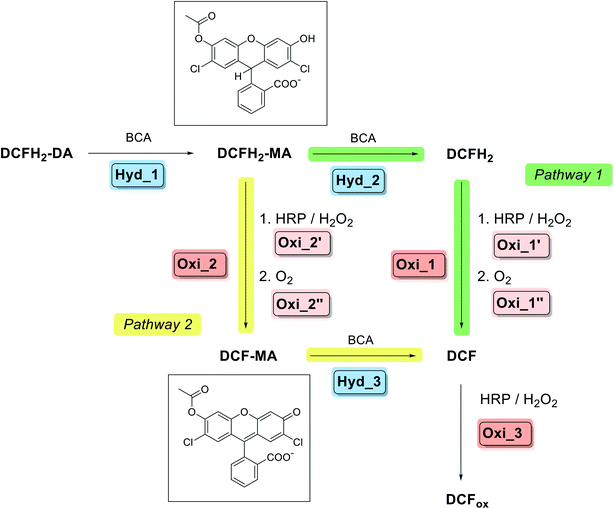 | ||
| Scheme 2 Overview about pathway 1 and pathway 2 of the two-enzyme cascade reaction analysed and applied in this work; describing the situation for simultaneous addition of BCA and HRP to DCFH2-DA in the presence of H2O2 at the beginning. For details of pathway 1, see Scheme 1: Hyd_1 → Hyd_2 → Oxi_1 (→Oxi_3). In pathway 2, DCFH2-MA is oxidised to DCF-MA, followed by hydrolysis to DCF: Hyd_1 → Oxi_2 → Hyd_3 (→Oxi_3). The chemical structures of the two important intermediates DCFH2-MA and DCF-MA are shown. Formation of DCFox (reaction Oxi_3) only occured to a significant extent in the presence of HRP and if H2O2 was present in excess over DCFH2 as well as HRP was not rate limiting for the formation of DCF-MA/DCF. The oxidation reactions were faster than the hydrolysis reactions when similar molar concentrations of BCA and HRP were present. For the BCA-catalysed hydrolysis reactions the kinetic efficiency was found in the relation: Hyd_1 > Hyd_3 > Hyd_2 (see later Table S-2, ESI†); while for the HRP-catalysed oxidations, Oxi_1 > Oxi_2 was found (see later Scheme-S1, ESI†). Experimental data confirmed the expectation that the higher the ratio of BCA to HRP, the higher the contribution from pathway 1; and the lower the reaction time, the higher the contribution from pathway 2 (see later Section 3.1.6.). | ||
DCFH2-DA has two (identical) ester bonds, the hydrolysis of both is catalysed by BCA, similar to fluorescein diacetate (the oxidised form of DCFH2-DA)35 or 6-carboxyfluorescein diacetate (Fig. S-2, ESI†).36 Upon initial addition of DCFH2-DA, BCA, HRP and H2O2, the first reaction intermediate obtained from DCFH2-DA by the action of BCA, 2′,7′-dichlorodihydrofluorescein monoacetate (DCFH2-MA), is either hydrolysed by BCA to 2′,7′-dichlorodihydrofluorescein (DCFH2) or oxidised by HRP/H2O2 to 2′,7′-dichlorofluorescein monoacetate (DCF-MA) (Scheme 2). Hydrolysis of DCF-MA by BCA or oxidation of DCFH2 by HRP/H2O2 yields 2′,7′-dichlorofluorescein (DCF). In the presence of HRP and H2O2, DCF may be oxidised further, depending on the experimental conditions; the products obtained are the phenoxyl radical DCF˙ (Scheme 1) and possibly other oxidation products whose chemical structures are unknown. Any type of oxidised form of DCF is abbreviated as DCFox (Schemes 1 and 2). While DCFH2-DA, DCFH2-MA and DCFH2 are colourless and non-fluorescent, DCF has a red colour (λmax = 503 nm) and is fluorescent.37,38 For the spectroscopic properties of DCF-MA and DCFox, see Results and discussion. From a previous study it is known that DCFox has a drastically reduced absorption at λ = 503 nm, as compared to DCF, with concomitant decrease in fluorescence.39
Overall, the seemingly simple two-enzyme cascade reaction can occur via two pathways (Scheme 2). For pathway 1, DCFH2-DA first undergoes complete hydrolysis to DCFH2, followed by oxidation to DCF and possibly DCFox. The reaction steps are: Hyd_1 → Hyd_2 → Oxi_1 (→Oxi_3). For pathway 2, DCFH2-DA is only partially hydrolysed to DCFH2-MA, followed by oxidation to DCF-MA and then hydrolysis to DCF and possibly oxidation to DCFox. The reaction steps are: Hyd_1 → Oxi_2 → Hyd_3 (→Oxi_3). Whether the two-enzyme cascade reaction proceeds predominantly via pathway 1 or 2 depends on whether the hydrolysis of DCFH2-MA is faster or slower than its oxidation.
Scheme 1 summarises known details from literature concerning pathway 1, illustrating the situation when an esterase (BCA or a different one) is added in excess over HRP/H2O2 (in terms of activity) or before HRP/H2O2 to a solution of DCFH2-DA so that complete hydrolysis to DCFH2 occurs before oxidation. After oxidation by HRP/H2O2, DCF is obtained (via DCFH˙ as short-lived intermediate, see below), indicated as steps Oxi_1′ and Oxi_1′′. Finally, oxidation of DCF to DCF˙ and to further oxidation products is possible (formation of DCFox).40–42
Concerning the two-electron oxidation of DCFH2 to DCF (step Oxi_1 in Schemes 1 and 2), it is known from literature that this reaction can take place spontaneously (slow auto-oxidation),43 but occurs readily with HRP (or other heme proteins) in the presence of H2O2 (and O2).31,42 Detailed previous studies suggest the following mechanism (Scheme 1):31,44 Native HRP is first oxidised by H2O2 in a two-electron oxidation to yield HRP-compound I. This is the first step of the well-known peroxidase cycle of HRP.45–47 DCFH2 is then oxidised by HRP-compound I in a one-electron oxidation to yield DCFH˙ (Oxi_1′a in Scheme 1). In this reaction, HRP-compound I is reduced to HRP-compound II, which can oxidise an additional molecule of DCFH2 to yield another DCFH˙ (Oxi_1′b in Scheme 1), whereby HRP-compound II is reduced to HRP. Deprotonation of DCFH˙ (pKa ∼ 8.8)48 leads to the formation of DCF˙− (Fig. S-1, ESI†). Oxidation of DCFH˙/DCF˙− to DCF occurs rapidly with O2, with concomitant formation of the superoxide radical anion, O2˙− (Oxi_1′′ in Scheme 1),49 which is known to spontaneously dismutate to O2 and H2O2 (disproportionation reaction: 2O2˙− + 2H+ → H2O2 + O2).50 The formed H2O2 acts as an accelerator of the oxidation of DCFH2, and O2 oxidises DCFH˙/DCF˙− (see above). Finally, it was reported that DCF in the presence of H2O2 may lead to the formation of hydroxyl radicals, HO˙,51 which in turn may oxidise peroxidase substrates (e.g., DCFH2), indicated by the dashed arrows in Scheme 1. This type of “peroxidase substrate-oxidizing activity” of DCF was demonstrated with 0.4 mM TMB as peroxidase substrate.51
Independent from the complexity of the reaction, if the cascade reaction works according to pathway 1 (Scheme 2), DCF is obtained from DCFH2-DA via DCFH2-MA and DCFH2. For pathway 2, DCFH2-MA and DCF-MA are formed as intermediates (Scheme 2). In both cases, formation of DCFox is possible. The determination of the absorption spectra of DCFH2-DA, DCFH2-MA, DCFH2, DCF-MA, DCF, and DCFox within the first part of our work allowed quantifying the composition of the reaction mixture during the course of the reaction and after reaching reaction equilibrium in bulk solution.
After having investigated the reaction in bulk solution, the results obtained were applied in the second part of the work to understand the performance of the two enzymes after they were immobilised and used in a flow-through device (the results are presented and discussed in Sections 3.2. and 3.3.). The enzymes were immobilised in glass fibre filters with a method that was elaborated before for BCA,52 and the two filters were placed in a home-made filter holder device for running flow-through reactions. The focus was on a comparison of the outflow in the case of co-immobilised enzymes as compared to sequentially immobilised enzymes.
2. Materials and methods
2.1. Chemicals
![[thin space (1/6-em)]](https://www.rsc.org/images/entities/char_2009.gif) 000, pI = 5.9),53,54 was obtained from Sigma-Aldrich (molar absorption coefficient at λ = 280 nm, ε280 (BCA) = 56
000, pI = 5.9),53,54 was obtained from Sigma-Aldrich (molar absorption coefficient at λ = 280 nm, ε280 (BCA) = 56![[thin space (1/6-em)]](https://www.rsc.org/images/entities/char_2009.gif) 000 M−1 cm−1).55 Horseradish peroxidase isoenzyme C (HRP, EC 1.11.1.7, cat. number PEO-131, grade I, lot 8153665000, RZ (A403/A260) = 3.0, Mr ∼ 44
000 M−1 cm−1).55 Horseradish peroxidase isoenzyme C (HRP, EC 1.11.1.7, cat. number PEO-131, grade I, lot 8153665000, RZ (A403/A260) = 3.0, Mr ∼ 44![[thin space (1/6-em)]](https://www.rsc.org/images/entities/char_2009.gif) 000, pI = 8.8)47 was purchased from Toyobo Enzymes, Japan (ε403 (HRP) = 102
000, pI = 8.8)47 was purchased from Toyobo Enzymes, Japan (ε403 (HRP) = 102![[thin space (1/6-em)]](https://www.rsc.org/images/entities/char_2009.gif) 000 M−1 cm−1).56,57
000 M−1 cm−1).56,57![[thin space (1/6-em)]](https://www.rsc.org/images/entities/char_2009.gif) 000 M−1 cm−1, determined in PB) from Cayman Chemical (product 85155, lot 0523494-3, Mr = 487.3), 2′,7′-dichlorofluorescein diacetate (DCF-DA, ≥95%, product 35845, lot #BCBV6655, Mr = 485.27) from Sigma-Aldrich, 2,2′-azino-bis(3-ethylbenzothiazoline-6-sulfonic acid)diammonium salt (ABTS2−(NH4+)2, ≥98%, ε340 (ABTS2−) = 36
000 M−1 cm−1, determined in PB) from Cayman Chemical (product 85155, lot 0523494-3, Mr = 487.3), 2′,7′-dichlorofluorescein diacetate (DCF-DA, ≥95%, product 35845, lot #BCBV6655, Mr = 485.27) from Sigma-Aldrich, 2,2′-azino-bis(3-ethylbenzothiazoline-6-sulfonic acid)diammonium salt (ABTS2−(NH4+)2, ≥98%, ε340 (ABTS2−) = 36![[thin space (1/6-em)]](https://www.rsc.org/images/entities/char_2009.gif) 000 M−1 cm−1)23 from Sigma-Aldrich (cat. number A1888, lot SLBV3167, Mr = 548.68), and hydrogen peroxide (H2O2, 35 wt%) was from Acros Organics (product 202460010, lot A0352305). The molar concentration of H2O2 in the 35 wt% solution (11.7 M) was determined spectrophotometrically after dilution with deionised water and using ε240 (H2O2) = 43.6 M−1 cm−1.60
000 M−1 cm−1)23 from Sigma-Aldrich (cat. number A1888, lot SLBV3167, Mr = 548.68), and hydrogen peroxide (H2O2, 35 wt%) was from Acros Organics (product 202460010, lot A0352305). The molar concentration of H2O2 in the 35 wt% solution (11.7 M) was determined spectrophotometrically after dilution with deionised water and using ε240 (H2O2) = 43.6 M−1 cm−1.60![[thin space (1/6-em)]](https://www.rsc.org/images/entities/char_2009.gif) 900 M−1 cm−1 (Fig. S-3, ESI†). This value is in good agreement with the spectrum given by (Chignell and Sik, 2003),43 but disagrees with the value given by (Ischiropoulos et al., 1999),41 see the known pH-dependency of ε503 (DCF)38 and Fig. S-3, ESI.†
900 M−1 cm−1 (Fig. S-3, ESI†). This value is in good agreement with the spectrum given by (Chignell and Sik, 2003),43 but disagrees with the value given by (Ischiropoulos et al., 1999),41 see the known pH-dependency of ε503 (DCF)38 and Fig. S-3, ESI.†2.2. UV/vis spectrophotometers
Molar absorption coefficient determinations and kinetic measurements in bulk solution were carried out with a JASCO V-670 or a SPECORD S600 spectrophotometer (from Analytik Jena) using quartz cells with path length of either 1.0 cm or 0.1 cm. For the determination of the concentrations of concentrated enzyme or dendronised polymer stock solutions a NanoDrop One instrument was used (from ThermoFisher Scientific). For spectrophotometric quantifications in the flow-through experiments, a Cary 60 spectrophotometer (from Agilent Technologies) was used in addition to the SPECORD S600, using the same cells mentioned above.2.3. Enzymatic reactions in bulk aqueous solution
![[thin space (1/6-em)]](https://www.rsc.org/images/entities/char_2009.gif) 510 M−1 cm−1.61
510 M−1 cm−1.61![[thin space (1/6-em)]](https://www.rsc.org/images/entities/char_2009.gif) 000 M−1 cm−1,23 see (Hou et al., 2019).59
000 M−1 cm−1,23 see (Hou et al., 2019).59For variations of the concentrations of BCA (0 or 0.5–3.0 μM in the cuvette), HRP (0 or 0.25–1.50 μM in the cuvette) and H2O2 (0 or 4.5–27 μM in the cuvette), the same type of stock solutions were used, but the volumes added were adjusted accordingly, balancing the total volume (1 mL) with PB. For low concentrations of HRP (2.5–7.5 nM in the cuvette), the HRP stock solution (50 μM in PB) was first diluted 100-fold before use. For reactions with an initial hydrogen peroxide concentration of [H2O2]0 = 180 μM, a 18 mM H2O2 stock solution (in PB) was used.
In order to oxidise DCF (10 μM in PB, 1 vol% DMSO, 1 mL) catalysed by HRP (0.5 μM) with an excess of H2O2 (180 μM) added at once at the beginning, 970 μL PB was placed inside a 1.0 cm/1.4 mL quartz cuvette. 10 μL HRP stock solution (50 μM in PB) and 10 μL H2O2 stock solution (18 mM in PB) were added and mixed gently. After the addition of 10 μL DCF stock solution (1 mM in DMSO), the cuvette was closed with a stopper, and after gentle mixing the UV/vis spectrum was recorded between 240 and 600 nm at 25 °C in 5 min intervals for 3 hours.
In order to oxidise DCF (10 μM in PB, 1 vol% DMSO, 1 mL) catalysed by HRP (0.5 μM) with an excess of H2O2 added stepwise, 980 μL PB was placed inside a 1.0 cm/1.4 mL quartz cuvette. 10 μL HRP stock solution (50 μM in PB) and 10 μL DCF stock solution (1 mM in DMSO) were added and mixed gently. From now on, the UV/vis spectrum was recorded between 240 and 600 nm at 25 °C in 1 min intervals for 3 hours. After 10 min, 10 μL diluted H2O2 stock solution (1 mM in PB) was added to the cuvette that was then put back inside the spectrophotometer after gentle mixing. Upon a stable value of A503 was reached (several minutes), another 10 μL diluted H2O2 stock solution were added. This process was repeated three more times (50 μL diluted H2O2 stock solution added, corresponding to 5 equivalents H2O2). Further addition of 5 μL diluted H2O2 stock solution (5.5th equivalent) did not lead to any significant spectral change anymore.
In another experiment, DCFH2 (50 μM) was added stepwise to already present HRP (0.5 μM) and H2O2 (9 μM). First, a 500 μM DCFH2 solution was prepared as described above in a buffer volume of 0.1 mL instead of 1 mL. From this 500 μM DCFH2 solution, 2 μL were added to a 1 mL solution containing HRP (0.5 μM) and H2O2 (9 μM) every 30 seconds for 4 minutes, followed by mixing and taking an absorption spectrum every minute. After thereby having added ∼10 μM of DCFH2 over the first 4 min, it was equilibrated for another 4 min and found to remain stable, indicating full H2O2 consumption. Addition of the remaining ∼40 μM of DCFH2 (80 μL of the 500 μM stock solution after 15 min) did not lead to significant changes in the spectrum above λ = 330 nm.
2.4. Preparation of the denpol-enzyme conjugates de-PG21000-BAH-BCA and de-PG21000-BAH-HRP
Two different types of dendronised polymer (denpol)-enzyme conjugates were prepared in this work, abbreviated as de-PG21000-BAH-BCA and de-PG21000-BAH-HRP. BAH stands for bis-aryl hydrazone and indicates the type of covalent bond through which the enzyme molecules were bound to de-PG21000. Quantification of the average number of BAH and enzyme molecules bound per 1000 repeating units (r.u.) long dendronised polymer molecules yielded 86 and 90 in the case of HRP (i.e., about one BAH bond per HRP molecule): de-PG21000-BAH86-HRP90. In the case of BCA, two conjugates were prepared, abbreviated as de-PG21000-BAH152-BCA101 and de-PG21000-BAH207-BCA152. For both BCA conjugates, on average more than one BAH bond was estimated to have formed per BCA molecule, the molar BCA/BAH ratio being 0.66 and 0.73, respectively.52 In Fig. 1, the chemical structures of an unmodified r.u. of de-PG21000 and of a r.u. to which one enzyme molecule is bound via a BAH bond are shown, together with a simple visualisation of how the enzyme molecules might be packed along the denpol chain for the average enzyme loadings determined experimentally.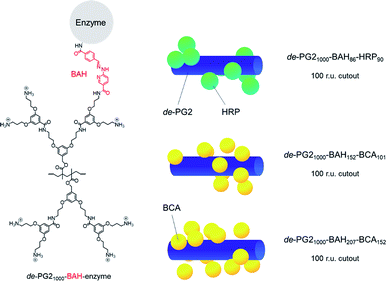 | ||
| Fig. 1 Left: Chemical structure of one r.u. of the dendronised polymer (denpol) de-PG21000 (bottom) in its fully protonated state, and of one r.u. to which an enzyme molecule is bound via a bis-aryl hydrazone (BAH) bond (top); “de-PG21000” stands for “deprotected dendronized polymer of second generation consisting of 1000 r.u. on average and a polymethacrylate backbone”. The different denpol-enzyme conjugates prepared had various average numbers of BAH bonds and enzyme molecules per average denpol chain. Right: Simplified visualisation of a possible packing of the enzymes molecules along a 100 r.u. long denpol chain (represented as blue cylinder): de-PG21000-BAH86-HRP90, de-PG21000-BAH152-BCA101, and de-PG21000-BAH207-BCA152. The enzyme molecules are represented as green (HRP) or yellow (BCA) spheres. The schematic representations show that the experimentally determined average number of enzymes molecules per average denpol chain are spatially feasible. Higher enzyme loadings along the denpol chains seem spatially possible, see ESI† for details about the visualisation. | ||
For the BCA-conjugates, details about their synthesis, purification and quantification are given in (Yoshimoto et al., 2018);52 for the HRP-conjugate, see (Hou et al., 2019).59 Additional information is provided in the ESI (Section 4) with Fig. S-4 and S-5.† If stored in aqueous solution at 4 °C, both types of conjugates are stable over prolonged periods of time.52,59
2.5. Immobilisation of de-PG21000-BAH-BCA and de-PG21000-BAH-HRP in glass fiber filters
The prepared denpol-enzyme conjugates were immobilised in glass fiber filters in a similar way as described previously, see (Yoshimoto et al., 2018).52 Before use, the glass fiber filters were first washed by immersing them 3 times for 10 min in 5 mL fresh ethanol. The filters were let dry under ambient conditions until no change in weight could be observed anymore (ca. 30 min). In the following, the general procedure for the immobilisation of the denpol-enzyme conjugates in the filters via simple adsorption from aqueous solution is described; for some of the experiments, this general procedure was modified. Although no major changes resulted from those modifications, they are summarised in the ESI (Section 5).†![[thin space (1/6-em)]](https://www.rsc.org/images/entities/char_2009.gif) 000 M−1 cm−1), see (Yoshimoto et al., 2018).52 The corresponding concentration of BCA in this desalted denpol-BCA conjugate solution was [BCA] = 8.8 μM. The denpol-HRP conjugate solution used was prepared from a stock solution obtained from the conjugate preparation according to a previously published protocol using a 10 mM sodium phosphate buffer solution (pH = 7.0, 0.15 M NaCl), see (Hou et al., 2019).59 This stock solution was diluted with the same buffer solution to [HRP] = 0.5 μM, determined by activity measurements using ABTS2− and H2O2 as substrates and a calibration curve for free HRP, see (Hou et al. 2019) for details.59 For control measurements with “empty” filters, pure PB or pure 10 mM sodium phosphate buffer solution (pH = 7.0, 0.15 M NaCl) was used.
000 M−1 cm−1), see (Yoshimoto et al., 2018).52 The corresponding concentration of BCA in this desalted denpol-BCA conjugate solution was [BCA] = 8.8 μM. The denpol-HRP conjugate solution used was prepared from a stock solution obtained from the conjugate preparation according to a previously published protocol using a 10 mM sodium phosphate buffer solution (pH = 7.0, 0.15 M NaCl), see (Hou et al., 2019).59 This stock solution was diluted with the same buffer solution to [HRP] = 0.5 μM, determined by activity measurements using ABTS2− and H2O2 as substrates and a calibration curve for free HRP, see (Hou et al. 2019) for details.59 For control measurements with “empty” filters, pure PB or pure 10 mM sodium phosphate buffer solution (pH = 7.0, 0.15 M NaCl) was used.The wetted filters were put inside closed 2 mL polypropylene tubes and stored for 1 h at room temperature. The filters were then placed in a home-made filter holder52 and washed for 3 h by using a peristaltic pump (P-1 from Pharmacia) at 200 μL min−1 with either PB (in the case of the denpol-BCA conjugate and for control filters treated with PB only), or with a 10 mM sodium phosphate buffer solution, pH = 7.0, containing 0.15 M NaCl (in the case of the denpol-HRP conjugates and the corresponding control filters). If not immediately used (or after buffer washing following activity measurements, see below) the washed, buffer immersed filters were stored inside a refrigerator at 4 °C with both ends of the filter holder closed with parafilm.
2.6. Measurements of the activity of immobilised denpol-BCA and denpol-HRP
![[thin space (1/6-em)]](https://www.rsc.org/images/entities/char_2009.gif) 510 M−1 cm−1,61 and [p-nitrophenolate]/[p-nitrophenol] = 1.15 at pH 7.2 using pKa (p-nitrophenol) = 7.14.52 Since p-NA undergoes significant autohydrolysis, reference measurements were carried out with “empty” filters (PB only). Data for this non-enzymatic p-NA hydrolysis were subtracted from the data obtained for the filter with immobilised BCA.
510 M−1 cm−1,61 and [p-nitrophenolate]/[p-nitrophenol] = 1.15 at pH 7.2 using pKa (p-nitrophenol) = 7.14.52 Since p-NA undergoes significant autohydrolysis, reference measurements were carried out with “empty” filters (PB only). Data for this non-enzymatic p-NA hydrolysis were subtracted from the data obtained for the filter with immobilised BCA.![[thin space (1/6-em)]](https://www.rsc.org/images/entities/char_2009.gif) 000 M−1 cm−1).23
000 M−1 cm−1).23![[thin space (1/6-em)]](https://www.rsc.org/images/entities/char_2009.gif) 900 M−1 cm−1 (see Fig. S-3, ESI†). For the collected final outflow (t = 150–180 min), the full absorption spectrum was analysed with the analytical methods already applied for the cascade reactions in bulk solution, as described in “Results and discussion” (Section 3.1.6.).
900 M−1 cm−1 (see Fig. S-3, ESI†). For the collected final outflow (t = 150–180 min), the full absorption spectrum was analysed with the analytical methods already applied for the cascade reactions in bulk solution, as described in “Results and discussion” (Section 3.1.6.).3. Results and discussion
3.1. Cascade reaction of DCFH2-DA and H2O2 in bulk aqueous solution with co-added free BCA and HRP
As summarised in Schemes 1 and 2, the investigated cascade reaction is characterised by two possible reaction pathways (see Introduction). We analysed the reaction in bulk solution in great detail after both enzymes were added from the beginning to a solution containing both substrates DCFH2-DA and H2O2, allowing the reaction to proceed not only along pathway 1 but also along pathway 2. If BCA would have been added before HRP to allow for complete hydrolysis of DCFH2-DA, progress along pathway 2 would have been prevented (not targeted here). For all reactions a 0.01 M sodium phosphate buffer solution was used with pH = 7.2 (PB) at T = 25 °C with a fixed initial concentration of DCFH2-DA ([DCFH2-DA]0) of 50 μM. The concentrations of BCA, HRP and H2O2 were varied, and the progress of the reactions was followed spectrophotometrically by recording the time-dependent changes in the absorption spectra of the reaction mixtures between λ = 240 and 600 nm.In the following, we first report on results obtained from a number of control measurements that helped understanding the progress and final outcome of the cascade reaction in dependence of initial H2O2 concentration and concentrations of BCA and HRP. Thanks to these control measurements, it was possible to finally know the absorption spectra between 240 and 600 nm of all components of the reaction mixtures (Fig. 2, Table S-1, and Fig. S-6, ESI†). This allowed for a molecular interpretation of the time-dependent spectral changes occurring in the case of the cascade reaction. In addition, the control measurements made a comparison of the kinetic efficiency for the BCA-catalysed hydrolysis of DCFH2-DA, DCFH2-MA and DCF-MA possible, which greatly helped interpreting the results from the cascade reaction.
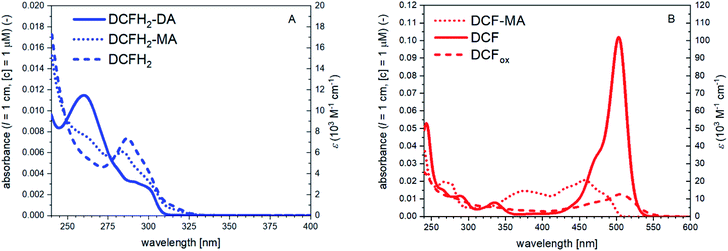 | ||
| Fig. 2 UV/vis absorption spectra between λ = 240 and 600 nm of all substrates, intermediates and products of the cascade reaction. (A) Reduced compounds DCFH2-DA, DCFH2-MA, and DCFH2 (as obtained from complete DCFH2-DA hydrolysis using NaOH). (B) Oxidised compounds DCF-MA, DCF, and DCFox (as obtained from DCF with more than 5 equivalents H2O2 in the presence of HRP, see Fig. S-8, ESI†). H2O2 did not have a significant absorption under the conditions used. On the left vertical axes, the absorbance normalised to 1 μM solutions (PB, pH = 7.2) are given, either as measured with quartz cells using solutions with about ten times higher concentrations, or as obtained by fitting (dotted lines), or as obtained by in situ preparation (dashed lines). The molar absorption coefficients are indicated on the right vertical axes (see also Table S-1, ESI†). See text for details. | ||
For the conditions we used for the cascade reaction (T = 25 °C, pH = 7.2, see later Section 3.1.6.), we re-investigated the stability of DCF (10 μM) in the presence and absence of HRP and H2O2 by placing different DCF-containing solutions, prepared in quartz cells, inside a spectrophotometer and then recording at a predetermined time interval the absorption spectrum between λ = 240 and 600 nm. The results were the following. Without HRP and H2O2, dissolved DCF is stable at pH = 7.2 for at least 3 days, independent whether the solution is stored (i) within the cell compartment of the spectrophotometer with continuous recording of the spectrum every 5 min for 18 h (Fig. S-7A, ESI†), (ii) in the dark, or (iii) exposed to room light in the laboratory (data not shown). Also the presence of either H2O2 (9 μM, Fig. S-7A, ESI†) or HRP (0.5 μM, Fig. S-7B, ESI†) separately did not lead to a significant change in the absorption spectrum of DCF. The situation was very different when both, H2O2 and HRP, were present, as demonstrated with two types of experiments. In the first one, H2O2 was added at [H2O2]0 = 180 μM to 10 μM DCF and 0.5 μM HRP, followed by recording the absorption spectrum every 5 min up to 3 h (Fig. S-8A, ESI†). In the second one, H2O2 was added in steps of 10 μM to 10 μM DCF and 0.5 μM HRP as long as significant changes in the absorption spectrum were observed (Fig. S-8B, ESI†). Both types of experiments showed that in the presence of HRP (0.5 μM) and excess H2O2, the DCF absorption with λmax = 503 nm decreased monotonically until A503 leveled off at about 1/8 of the initial value. This final value was reached after addition of about 50 μM H2O2 (Fig. S-8C and D, ESI†), corresponding to 5 equivalents with respect to the concentration of DCF used in the experiments (10 μM). It is possible that a lot of the excess H2O2 during this stepwise addition was decomposed to O2 and H2O by the “catalase-like” activity of the high amounts of HRP present, so-called “catalatic” activity.62,63 As adding 5.5 and more H2O2 equivalents did not lead to a further decrease in A503, and since there was no change in the spectrum obtained (no band shift or appearance of new bands), the absorption spectrum obtained after addition of 5 equivalents H2O2 to DCF is considered as the spectrum of oxidised DCF products (DCFox). Although we are not aware of any detailed investigation of the oxidation of DCF with HRP/H2O2, the spectrum of DCFox we obtained (Fig. 2B) resembles the spectrum reported by (Rota et al., 1999).39 Most notably, the remaining absorption bands around 503 nm are much broader than the ones for DCF, with additional absorption between λ = 525 and 550 nm, a region in which the absorption of DCF is very low or almost zero. This high wavelength absorption seems to be characteristic for DCFox.39 The catalatic activity of HRP was tested under similar conditions (0.5 μM HRP, 9 μM H2O2, PB buffer), yielding significant H2O2 decomposition within a few minutes, i.e., within a similar time frame as in the case of the stepwise addition of H2O2 to DCF described above (see Fig. S-9, ESI†). Although the excess H2O2 consumption needed to oxidise DCF to DCFox might possibly have several additional reasons (H2O2 destabilisation by DCF, reduction of DCF˙),39,51 it became clear that under the experimental conditions we used, HRP-catalysed DCF oxidation always was in competition with HRP-catalysed H2O2 oxidation (catalatic activity of HRP).
Control 1: DCFH2-DA only. The absorption spectrum of DCFH2-DA dissolved in PB at pH = 7.2 is shown in Fig. 2A. The spectrum has an absorption maximum at λ = 260 nm.64 As shown in Fig. S-10, ESI,† the spectrum of dissolved DCFH2-DA (50 μM in PB) did not change much upon storage for up to 15 h at T = 25 °C. There was only a slight decrease in A260 with time and a very small increase in A287 (slow auto-hydrolysis). A503 remained almost zero.
Controls 2 and 3: DCFH2-DA + HRP and DCFH2-DA + H2O2. The situation is practically the same as for Control 1 when DCFH2-DA (50 μM) was incubated for 15 h with either 0.5 μM HRP (Fig. S-11, ESI†) or 9 μM H2O2 (Fig. S-12, ESI†).
Control 4: DCFH2-DA + BCA. Incubation of DCFH2-DA (50 μM) with either 1.0 μM BCA (Fig. S-13, ESI†) or 2.0 μM BCA (Fig. S-14, ESI†) resulted in (i) clear changes of A260 (decrease) and A287 (increase) due to DCFH2-DA hydrolysis, as well as (ii) appearance of a band with low intensity at λmax = 503 nm. Although A503 remained low, its small increase with time indicates that the formation of DCF can occur from hydrolysed DCFH2-DA without an oxidative enzyme (Fig. 2B). This observation is in agreement with the results of studies by Rota et al. (1999),39 which showed that auto-oxidation of the intermediate DCFH2 to DCFH˙ and DCF can occur to some extent (Scheme 1).
As an intermediate conclusion of Controls 1–4, the measurements showed that (i) dissolved DCFH2-DA (50 μM) in PB (pH = 7.2) is relatively stable during the time of the experiments (negligible non-enzymatic hydrolysis); (ii) the presence of HRP (0.5 μM) or H2O2 (9 μM) does not affect the stability of DCFH2-DA; (iii) BCA (1.0 or 2.0 μM) catalyses the hydrolysis of DCFH2-DA with appearance of a band centered around λ = 287 nm and formation of small amounts of DCF. After 15 h at T = 25 °C, the concentration of formed DCF was 0.14 μM for 1.0 μM BCA and 0.16 μM for 2.0 μM BCA (Fig. S-13 and S-14, ESI†).
Control 5: DCFH2-DA + BCA + HRP. DCFH2-DA (50 μM) was incubated with BCA (either 1.0 or 2.0 μM) and 0.5 μM HRP (without H2O2), see Fig. S-15, ESI† for 1.0 μM BCA and Fig. S-16, ESI,† for 2.0 μM BCA. In both cases, hydrolysis of DCFH2-DA occurred with more pronounced formation of DCF as in the absence of HRP. After 15 h at T = 25 °C, the concentration of DCF was 0.4 μM for 1.0 μM BCA and 0.55 μM for 2.0 μM BCA.
Control 6: DCFH2-DA + BCA + H2O2. DCFH2-DA (50 μM) was incubated with 1.0 μM BCA and 9 μM H2O2 (without HRP), see Fig. S-17, ESI.† The results were very similar to those for the incubation of DCFH2-DA (50 μM) with 1.0 μM BCA only (Fig. S-13, ESI†). After 15 h at T = 25 °C, the concentration of formed DCF was 0.13 μM (Fig. S-17, ESI†).
Control 7: DCFH2-DA + HRP + H2O2. Incubation of DCFH2-DA (50 μM) in the presence of 0.5 μM HRP and 9 μM H2O2 (no BCA) represents the situation of non-enzymatic hydrolysis of DCFH2-DA followed by enzymatic oxidation (Fig. S-18, ESI†). The extent of DCF formation after 15 h at T = 25 °C was 0.98 μM, considerably higher than in the case of Controls 5 and 6. This confirms the efficiency of HRP/H2O2 in oxidising the intermediates DCFH2-MA and DCFH2 (Scheme 2).
As a summary of Controls 5–7 it is clear that non-enzymatic oxidation of partially or fully hydrolysed intermediates (DCFH2-MA or DCFH2) can occur, in agreement with literature.39 For efficient oxidations, however, both HRP and H2O2 must be present, see below.
Quantitative conclusions drawn from the BCA catalysed hydrolysis of DCFH2-DA (“Control 4” above). As mentioned above, the data shown in Fig. S-13 and S-14, ESI,† reflect the BCA-catalysed hydrolysis of DCFH2-DA, i.e., the time-dependent disappearance of DCFH2-DA, the transient formation of DCFH2-MA and the formation of the completely hydrolysed product DCFH2 (with formation of only negligible amounts of DCF). The recorded time-dependent spectral changes for this two-step hydrolysis of DCFH2-DA (Hyd_1 and Hyd_2 in Scheme 2) was analysed by taking into account the known absorption spectra of DCFH2-DA and DCFH2 (Fig. 2A), the latter being obtained through complete hydrolysis of DCFH2-DA with hydroxide ions (see Materials and methods). The spectral changes show two isosbestic points, the first one appearing at the beginning of the reaction (λiso = 276 nm, Fig. S-13C, ESI†), reflecting coexistence of DCFH2-DA and DCFH2-MA (with negligible amounts of DCFH2), the second one appearing at the second phase of the reaction (λiso = 279 nm, Fig. S-13B, ESI†), reflecting DCFH2-MA and DCFH2 (with negligible amounts of DCFH2-DA), see Table 1. Once A279 reached a constant value, only DCFH2-MA and DCFH2 were present in the reaction mixture, with a continuous change in their relative amounts until eventually reaction equilibrium was reached. With this, the absorption spectrum of DCFH2-MA could be obtained by manual fitting (Fig. S-13D, ESI†). The spectrum is shown in Fig. 2A. In Fig. 3, the decrease in [DCFH2-DA] during the first phase and the decrease in [DCFH2-MA] and increase in [DCFH2] during the second phase of the reaction are shown for the two reactions with initially 50 μM DCFH2-DA and either 1.0 μM BCA (Fig. 3A) or 2.0 μM BCA (Fig. 3B). The beginnings of the second phase were identified as about 300 and 200 min, respectively.
| Molecules | λiso (nm) | ελ (M−1 cm−1) |
|---|---|---|
| DCFH2-DA/DCFH2-MA | 276 | 5600 |
| DCFH2-MA/DCFH2 | 279 | 5600 |
| DCF-MA/DCF | 284 | 11![[thin space (1/6-em)]](https://www.rsc.org/images/entities/char_2009.gif) 400 400 |
| 340 | 7200 | |
| 460 | 19![[thin space (1/6-em)]](https://www.rsc.org/images/entities/char_2009.gif) 800 800 |
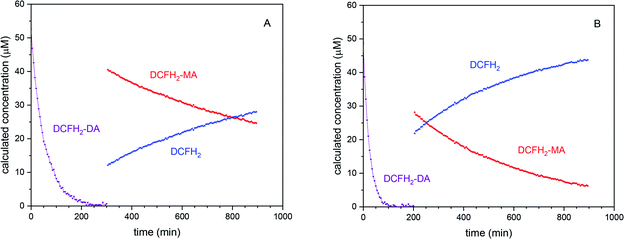 | ||
| Fig. 3 Quantitative analysis of the BCA-catalysed hydrolysis of DCFH2-DA (50 μM, 1 vol% DMSO) in PB (10 mM sodium phosphate buffer solution, pH = 7.2) at 25 °C with (A) [BCA] = 1.0 μM and (B) [BCA] = 2.0 μM. The determination of the time-dependent decrease of [DCFH2-DA] at the beginning of the reaction and the time-dependent decrease of [DCFH2-MA] and increase of [DCFH2] in the second phase of the reaction was achieved by taking into account the spectral changes shown in Fig. S-13 and S-14, ESI,† and the absorption spectra of DCFH2-DA, DCFH2-MA, and DCFH2 (Fig. 2A). For [BCA] = 1.0 μM and t > 300 min (A), only DCFH2-MA and DCFH2 existed (second phase of the reaction). For [BCA] = 2.0 μM (B), the second phase of the reaction started at t ≈ 200 min. For both reactions, [DCF] (t = 15 h) < 0.2 μM. For both hydrolysis steps the specificity constant (kcat/KM) was determined showing a higher value for the initial hydrolysis of DCFH2-DA to DCFH2-MA (see Table S-2, ESI†). | ||
From the exponential decrease of [DCFH2-DA] and [DCFH2-MA] with time, the kinetic efficiency (kcat/KM) was determined by curve fitting under the assumption that [S] ≪ KM (Michaelis–Menten kinetics, S being DCFH2-DA or DCFH2-MA, kcat the catalytic constant and KM the Michaelis constant). As already recognisable by eye, the catalytic efficiency is higher for the BCA catalysed hydrolysis of DCFH2-DA (≈0.020 μM−1 min−1) than for the one of DCFH2-MA (≈0.001 μM−1 min−1). For more details about the determination of kcat/KM see the ESI, Table S-2.† The behaviour shown in Fig. 3 is very similar to what has been reported for the enzymatic hydrolysis of fluorescein diacetate and fluorescein di-β-D-galactopyranoside.65,66
As for DCFH2-DA and DCFH2-MA (see Section 3.1.2.), from the BCA-catalysed decrease of [DCF-MA], the kinetic efficiency (kcat/KM) was determined. It was ≈0.004 μM−1 min−1, i.e., about four times higher than the one for its reduced analogue (≈0.001 μM−1 min−1 for DCFH2-MA) but still around 5-times lower than the one for DCFH2-DA (≈0.020 μM−1 min−1). For more information about the determination of kcat/KM, see the ESI, Table S-2.† As for the hydrolysis of the reduced form (DCFH2-DA, see above), the behaviour for DCF-DA shown in Fig. S-19C (ESI†) is very similar to what has been reported for the enzymatic hydrolysis of fluorescein diacetate and fluorescein di-β-D-galactopyranoside.65,66
In the first experiment, 50 μM DCFH2 were incubated with 0.5 μM HRP and 9 μM H2O2 altogether and the change of the absorption spectrum was recorded at t = 2, 4, and 15 min after preparing the reaction mixture (Fig. S-20A, ESI†). The conditions were [DCFH2]0 > 2·[H2O2]0, which resulted in a rapid oxidation of a fraction of the initially present DCFH2 into DCF (18 μM). Formation of 18 μM DCF with 9 μM H2O2 and 0.5 μM HRP is in agreement with what one expects from the oxidation step Oxi_1 of Scheme 1 (formation of two DCFH˙ intermediates for each H2O2 molecule via step Oxi_1′, with subsequent non-enzymatic oxidation of DCFH˙ to DCF with O2 via step Oxi_1′′). Under the conditions of the experiments ([HRP] = 0.5 μM) there was no proof for obtaining H2O2 from the formed superoxide radical anion (O2˙−) in step Oxi_1′′. It may well be that O2˙− reacted with some of the functional groups present in HRP67–69 or it reacted with water to form hydroperoxyl radicals and hydroxide ions  .67
.67
In the second experiment, 10 μM DCFH2 were first added stepwise (over 4 min) to 0.5 μM HRP and 9 μM H2O2, and the change of the absorption spectrum was measured until a stable spectrum was reached (after t = 8 min, see Fig. S-20B, ESI†). The conditions were [DCFH2]0 < 2·[H2O2]0 until t = 8 min. After t = 15 min, additional 40 μM DCFH2 were added to the reaction mixture, without any significant change of the absorption spectrum between λ = 330 and 600 nm. This indicates that there was no H2O2 left that could activate HRP for oxidising the newly added DCFH2.70 All H2O2 molecules were used up during the first 8 min, resulting in a partial overoxidation of DCF (step Oxy_3 in Scheme 1), i.e., formation of DCFox with a decreased absorption intensity at λ = 503 nm and a characteristic absorbance increase between λ ≈ 530 and 540 nm (see above, Section 3.1.1.). H2O2 may also be oxidized to O2 and H2O via the catalatic cycle of HRP (see 3.1.1.).62,63 In this second experiment, A503 remained much lower than in the case of the first experiment (A503 = 0.61 vs. A503 = 1.83), despite the final concentrations of all added reacting molecules and HRP were the same for both reactions (Fig. S-20, ESI†). This clearly shows that irreversible DCF overoxidation is expected to occur in the presence of HRP only if (transient) conditions exist at which H2O2 is in excess over DCFH2 (conditions of the second experiment).71 Besides DCF overoxidation, catalatic H2O2 decomposition occurred under our conditions in a similar time scale (see Fig. S-9, ESI†).
An important conclusion drawn from the two experiments is that the consumption of H2O2 in the presence of HRP and DCFH2 is due to a competition between (i) DCFH2 oxidation (resulting in DCF formation), (ii) DCF overoxidation, and (iii) catalatic H2O2 decomposition. The individual contributions by these competitive reactions depend in a complex manner on the concentrations of DCFH2, H2O2, and HRP.
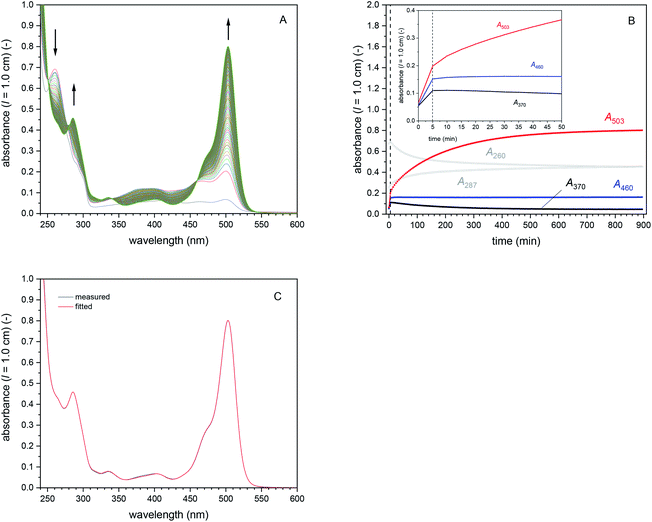 | ||
| Fig. 4 Cascade reaction 1 (in bulk solution) with [DCFH2-DA]0 = 50 μM, [BCA] = 1.0 μM, [HRP] = 0.5 μM, and [H2O2]0 = 9 μM, PB (pH = 7.2), 1 vol% DMSO, T = 25 °C. (A) Changes in the UV/vis absorption spectrum, recorded every 5 min for 15 h. Besides the growing peak at λ = 503 nm (mainly originating from DCF), λiso (DCF-MA/DCF) at 340 and 460 nm can easily be seen (formed after t ≈ 5 min). (B) Changes of A260, A287, A370, A460, and A503 during the reaction, up to t = 15 h (inset: zoom-in for the first 50 min). After t = 5 min (dashed vertical line), most of the added H2O2 was consumed, disabling any further HRP-catalysed oxidation reactions. Therefore, only BCA-catalysed hydrolysis reactions could take place. Hydrolysis of DCF-MA to DCF is evident in the region of the spectrum in which the reduced species do not absorb (λ = 330–600 nm): increase of A503, decrease of A370 (DCF-MA), with a stable value of A460. DCFox only formed within the first 5 min (presumably with concomitant HRP-catalysed catalatic H2O2 decomposition, see Fig. S-9, ESI†). (C) Comparison of the spectrum measured after t = 15 h (black line) with the sum of the spectra obtained by fitting (red line). The fitted concentrations of the individual species present in the reaction mixture after t = 15 h are given in Table S-3.† [BCA] = 1.0 μM; [HRP] = 0.5 μM; [DCFH2-DA] = 0 μM; [DCFH2-MA] = 9.5 μM; [DCFH2] = 30.9 μM; [DCF-MA] = 0 μM; [DCF] = 7.6 μM; [DCFox] = 1.0 μM. | ||
(i) Obtained results based on analysing spectral changes.
Cascade reaction 1 with [DCFH2-DA]0 = 50 μM, [BCA] = 1.0 μM, [HRP] = 0.5 μM, and [H2O2]0 = 9 μM. This reaction was considered as “standard reaction” in bulk solution. All further reactions were systematic deviations for this standard reaction, whereby only the concentration of one of the four components was changed at a time. The progress of the standard reaction is shown in Fig. 4A and B. Clear changes in the spectrum with increasing reaction time were (i) a decrease in A260 and an increase in A287 (originating from the hydrolysis of DCFH2-DA); and (ii) the appearance of a band at λmax = 503 nm (originating predominantly from the formation of DCF and only to a small extent from DCFox, the latter if oxidation of DCF occurred). A460, the absorbance measured at λiso (DCF-MA/DCF), increased during the first 5 min and then remained almost constant. This indicates that after t = 5 min, [DCF-MA] + [DCF] (+[DCFox]) remained practically unchanged. At t ≈ 5 min, DCFH2-DA was still being hydrolysed but no oxidation reaction was observed anymore. This indicates complete consumption of H2O2 within the first 5 min. The increase in A503 for t > 5 min reflects the formation of DCF at the expenses of DCF-MA.72 After t = 15 h, no significant amounts of DCF-MA anymore, but small quantities of DCFox were observed (see below).
The spectrum measured after t = 15 h is shown in Fig. 4C and was fitted with the reference spectra shown in Fig. S-6, ESI,† and Fig. 2, by taking into account information from isosbestic points (λiso, see Table 1) and characteristic absorptions (e.g. A503 for DCF or A550 for DCFox): [DCFH2-DA] = 0 μM, [DCFH2-MA] = 11.5 μM, [DCFH2] = 30.9 μM, [DCF-MA] = 0 μM, [DCF] = 7.6 μM, and [DCFox] = 1.0 μM, see Table S-3, ESI.† Such compound concentration determinations were also made for the following cascade reactions 2–4 (see Table S-3, ESI†).
Cascade reactions 2 with [DCFH2-DA]0 = 50 μM, [HRP] = 0.5 μM, [H2O2]0 = 9 μM, and [BCA] = 0–3.0 μM. In Fig. 5, the time-dependent changes in A503 and A460 are shown for the cascade reaction with the different BCA concentrations used (0, 0.5, 1.0, 2.0, and 3.0 μM). There are two main observations. First, the higher the BCA concentration was, the faster was the increase in A503 and the higher was A503 after t = 15 h. However, A503 (t = 15 h) did not correlate linearly with [BCA] (Fig. 5A). The time-dependent change of A460 shows that for all cases, the oxidation reactions were completed after a few minutes, after which a stable value of A460 was reached (Fig. 5B), while A503 still continued to increase (Fig. 5A). Second, the higher the BCA concentration was, the higher [DCF-MA] + [DCF], i.e., higher values of A460 were obtained (Fig. 5B). With this, the higher the BCA concentration was, the lower the amount of overoxidised products (DCFox) formed, see Table S-3, ESI.† The BCA-catalysed hydrolysis reactions clearly were rate limiting. During the second phase of the reaction, after A460 was constant, only hydrolysis of DCF-MA to DCF took place (λiso (DCF-MA/DCF) = 460 nm, Table 1). For the compound concentrations at t = 15 h, see Table S-3, ESI.†
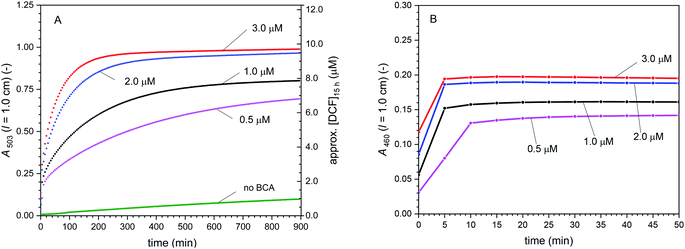 | ||
| Fig. 5 Cascade reaction 2 (in bulk solution) with [DCFH2-DA]0 = 50 μM, [HRP] = 0.5 μM, [H2O2]0 = 9 μM, and [BCA] = 0–3.0 μM, PB (pH = 7.2), 1 vol% DMSO, T = 25 °C. (A) Changes of A503 with time up to t = 15 h. (B) Changes of A460 with time for the first 50 min. After an initial increase with time, A460 did not change anymore after a few minutes. This indicates that all oxidation reactions completed within the first few minutes. The continued increase in A503 was due to hydrolysis of DCF-MA to DCF. In (A), the approximate concentration of DCF after t = 15 h is given on the right hand side (on the simple basis of A503, ignoring the much smaller contribution of DCFox to A503), see Table S-3 (ESI†) for the more elaborate concentrations of all the different species in the reaction mixture, as obtained by spectral fitting. | ||
Cascade reactions 3 with [DCFH2-DA]0 = 50 μM, [BCA] = 1.0 μM, [HRP] = 0.5 μM, [H2O2]0 = 0–180 μM. The effect of varying the initial H2O2 concentration on the cascade reaction is shown in Fig. 6, illustrated by plotting A503 (Fig. 6A) and A460 (Fig. 6B) vs. reaction time for [H2O2]0 = 4.5, 9.0, 18, 27 and 180 μM (arbitrarily chosen). Interestingly, the initial rate of increase of A460 was the same for all [H2O2]0 ≥ 9.0 μM – and it was probably also the same for [H2O2]0 = 4.5 μM, although we do not have spectral data for t < 5 min, i.e., for the very early phase of the reaction. After t = 50 min or less, depending on [H2O2]0, A460 remained constant, while A503 continued to increase. This shows again that all oxidation reactions were completed during the initial phase of the reaction, resulting in a complete consumption of the initially added H2O2. The changes that occurred after this initial phase were due to hydrolysis of DCF-MA to DCF (Hyd_3 in Scheme 2). Worth noting is the case of [H2O2]0 = 180 μM (Fig. 6C). After an initial increase of A503 with reaction time, A503 started to slightly decrease at t = 40–50 min before it increased again. This behaviour was due to the over-oxidation of DCF (formation of DCFox) between t = 40 and 50 min (which is pronounced for such high H2O2 concentration (2 [H2O2]0 ≫ [DCFH2-DA]0)). The HRP/H2O2-catalysed formation of DCFox was faster than the DCF formation in that period. Since A460 was still increasing, DCF-MA was still being formed. For the compound concentrations at t = 15 h, see Table S-3, ESI.†
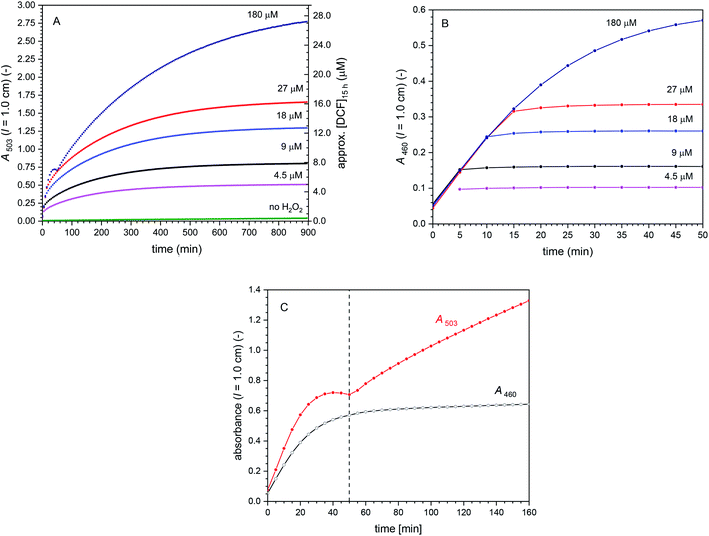 | ||
| Fig. 6 Cascade reactions 3 (in bulk solution) with [DCFH2-DA]0 = 50 μM, [BCA] = 1.0 μM, [HRP] = 0.5 μM, and [H2O2]0 = 0–180 μM, PB (pH = 7.2), 1 vol% DMSO, T = 25 °C. (A) Changes of A503 with time up to t = 15 h. (B) Changes of A460 with time for the first 50 min. With the exception of [H2O2]0 = 180 μM, after an initial increase with time, A460 did not change anymore after a few minutes (all added H2O2 reacted). This indicates that in these cases, all oxidation reactions completed within the first few minutes. (C) Zoom-in for data obtained for [H2O2]0 = 180 μM for up to t = 160 min. The observed change of A503 during the first 50 min appears strange, but can be explained by fast oxidation of DCF to DCFox (see text). Although such overoxidation leads to a decrease in A460, the observed increase in A460 indicates DCF-MA was still formed during this time period. Moreover, oxidation reactions with [H2O2]0 = 180 μM occurred beyond 50 min, reaching a stable value of A460 only after t ≈ 200 min (not shown). For all H2O2 concentrations, the initial rate of DCF-MA/DCF formation (dA460/dt) was the same. The continued increase in A503 was due to hydrolysis of DCF-MA to DCF. In (A), the approximate concentration of DCF after t = 15 h is given on the right hand side (on the simple basis of A503, ignoring the much smaller contribution of DCFox to A503), see Table S-3 (ESI†) for the more elaborate concentrations of all the different species in the reaction mixture, as obtained by spectral fitting. | ||
Cascade reactions 4 with [DCFH2-DA]0 = 50 μM, [BCA] = 1.0 μM, [H2O2]0 = 9 μM, [HRP] = 0–1.50 μM. For this series of cascade reactions with variation of the HRP concentration, from as low as 2.5 nM to as high as 1.5 μM, a seemingly strange behaviour is observed if A503 is plotted vs. reaction time (Fig. 7A). However, the situation becomes clear if instead of A503, the absorbance at λiso (DCF-MA/DCF), A460, is considered (Fig. 7B).
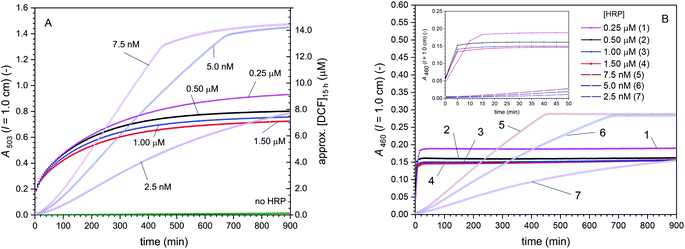 | ||
| Fig. 7 Cascade reaction 4 (in bulk solution) with [DCFH2-DA]0 = 50 μM, [BCA] = 1.0 μM, [H2O2]0 = 9 μM, and [HRP] = 0–1.50 μM, PB (pH = 7.2), 1 vol% DMSO, T = 25 °C. Changes of A503 (A) and A460 (B) with time for up to t = 15 h (inset: zoom-in for the first 50 min). For [HRP] = 0.25–1.50 μM, all oxidation reactions (see Scheme 2) were finished during the first few minutes. For [HRP] = 2.5–7.5 nM, the oxidation reactions were slow, as indicated by the slow increase in A460 with time (slow consumption of H2O2, suppressing overoxidation, i.e., prevention of DCFox formation. HRP being rate limiting presumably also suppressed catalatic H2O2 decomposition to a big extent). In (A), the approximate concentration of DCF after t = 15 h is given on the right hand side (calculated on the basis of A503, ignoring the much smaller contribution of DCFox to A503). The lower [HRP] was, the more negligible the extent of overoxidation was, and thus the more precise is the approximation. See Table S-3 (ESI)† for the more elaborate concentrations of all the different species in the reaction mixture, as obtained by spectral fitting. | ||
For [HRP] = 0.25–1.50 μM, all oxidation reactions were completed within the first few minutes (t < 20 min), after which A460 did not change anymore (Fig. 7B, inset). Analysis of dA460/dt for the first 5 min showed that the rate of [DCF-MA] + [DCF] formation (slightly) decreased with increasing HRP concentration. As (for a high HRP concentration) BCA-catalysed DCFH2-DA hydrolysis was the rate limiting step for DCF-MA/DCF formation (see above reactions 2) and [H2O2] for the largest part did not affect dA460/dt (see above reactions 3), using more HRP did probably simply support DCF overoxidation and catalatic H2O2 decomposition in this case.
For [HRP] = 2.5–7.5 nM, the oxidation reactions were completed after much longer time than in the case of [HRP] = 0.25–1.50 μM: after 450 min for [HRP] = 7.5 nM, or after 650 min for [HRP] = 5.0 nM. In this case, the slow HRP/H2O2-catalysed oxidation of DCFH2-MA and DCFH2 to DCF-MA and DCF was rate limiting, thereby suppressing overoxidation; dA460/dt was directly proportional to [HRP]. With the oxidation being the rate limiting step, DCFH2-MA and DCFH2 formed faster than they were further oxidised. For the compound concentrations at t = 15 h, see Table S-3, ESI.†
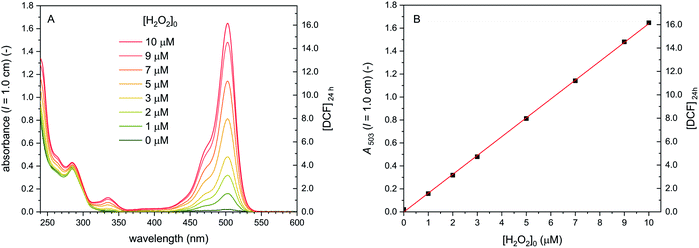
Cascade reactions 5 with [DCFH2-DA]0 = 50 μM, [BCA] = 1.0 μM, [HRP] = 10 nM, [H2O2]0 = 0–10 μM. The conditions for this last series of measurements in bulk solution were chosen on the basis of our analysis of cascade reactions 1–4 (Fig. 4–7 and ESI, Section 14†). With the analysis carried out so far, it became clear how the initial bulk reaction conditions must be chosen for obtaining, for example, a linear correlation between [H2O2]0 and A503 for reaction times at which reaction equilibrium is approached (t ≈ 24 h): the HRP-catalysed oxidation reactions must be rate limiting but still fast enough so that reaction equilibrium is reached within 24 h. The results of the experiments run under such conditions are shown in Fig. 8. A503 correlates linearly with [H2O2]0, although for all initial H2O2 concentrations, the H2O2 conversion in terms of DCF formation was about 80%. Since no DCFox formed under these conditions (verified by spectral fitting), the 20% H2O2 conversion missing were most likely due to the catalatic activity of HRP.62,63
(ii) Summary and discussion of observed trends upon variation of initial concentrations.
The most significant changes in the cascade reaction were observed upon varying [HRP], while keeping the concentrations of the other reaction components constant ([DCFH2-DA]0 = 50 μM, [BCA] = 1 μM, [H2O2]0 = 9 μM, see Fig. 7B). Adding HRP at comparatively low ([HRP] = 2.5–7.5 nM) or high concentration ([HRP] = 0.25–1.50 μM) determined whether the oxidation (Oxi_1 and Oxi_2, Scheme 2) or the hydrolysis (Hyd_1) was rate limiting for the combined formation of DCF + DCF-MA. In the following discussion, the rate of the combined formation of the oxidized species DCF + DCF-MA (directly proportional to dA460/dt) will be considered and not the rate of DCF formation only (proportional to dA503/dt). The continuous hydrolysis of DCF-MA (Hyd_3) turned out to stably yield DCF over time.
Under conditions at which oxidation was rate limiting for the combined formation of DCF + DCF-MA. Under these conditions, dA460/dt was linearly dependent on [HRP]. Overoxidation (DCFox formation) was suppressed while catalatic H2O2 decomposition was minimized (see Section 3.1.4.). The suppression of these H2O2 consuming side reactions allowed for a DCF formation linearly depending on [H2O2]0 (see Fig. 8).
Under conditions at which hydrolysis was rate limiting for the combined formation of DCF + DCF-MA. Under conditions at which hydrolysis was rate limiting for the combined formation of DCF + DCF-MA, dA460/dt did not increase with increasing [HRP] (or [H2O2]0, see Fig. 6B). Therefore, [HRP] and [H2O2]0 were considered to be in “in excess” under these conditions. Thus, the initial hydrolysis of DCFH2-DA (Hyd_1) was rate limiting. With [HRP] and [H2O2]0 being “in excess”, DCFox formation and catalatic H2O2 decomposition gained significant contribution. Thereby, the formation of DCF was not linearly dependent on [H2O2]0 anymore (see Table S-3, ESI†).
Regarding the two reaction pathways (Scheme 2). Although a complete absence of one reaction pathway could never be observed, one of them dominated, depending on whether oxidation or hydrolysis was rate limiting for the combined formation of DCF + DCF-MA (dA460/dt). For conditions with rate limiting hydrolysis, pathway 2 was predominant. Since the oxidation of DCFH2-MA (Oxi_2) was much faster than its hydrolysis (Hyd_2) under these conditions, the concentration of DCFH2 remained very low until most H2O2 was consumed. For conditions with rate limiting oxidation, the situation was more complex. Under these conditions, pathway 2 was predominant only at the beginning of the reaction, where [DCFH2-MA] ≫ [DCFH2] (see Fig. 3). Pathway 1 was gaining increasing contribution over time, as [DCFH2] continuously increased. Interestingly, the ratio of DCF formed via pathway 1 to DCF formed via pathway 2 increased much faster with time than the ratio of the concentrations of DCFH2 to DCFH2-MA. This indicated that Oxi_1 > Oxi_2 (given the same [HRP] and [H2O2]0). This relation could be confirmed, even for [DCFH2] being one order of magnitude lower than [DCFH2-MA] (see Scheme S-1, ESI†). As pathway 2 was predominant at the beginning of the reaction but pathway 1 became predominant relatively quickly, the reaction time determined which of the two pathways dominated. Overall, the experimental data fully confirm what one expects from Scheme 2: the higher the ratio of BCA to HRP, the higher the contribution from pathway 1; and the lower the reaction time, the higher the contribution from pathway 2 (see ESI Section 15 with Fig. S-21 and Scheme S-1†).
Regarding quantitative analysis of the cascade reaction. From all conditions under which the cascade reaction was investigated (cascade reactions 1–5), it became clear that the analysis of the cascade reaction was much more straightforward when the oxidation was rate limiting for the combined formation of DCF + DCF-MA (dA460/dt), as complicating side reactions were suppressed (overoxidation and catalatic H2O2 decomposition). The determination of [DCF] + [DCF-MA] by measuring A460 (at λiso = 460 nm) turned out to be most useful for fully understanding the complex changes of A503 occuring during the reaction. Following the reaction by monitoring A503 only can be puzzling. Similarly, great care should be taken if the reaction is followed by fluorescence spectroscopy only, since with this only the formation of DCF is detected, without any quantitiative information about remaining DCF-MA or formed DCFox. In that case, wrong oxidation turnovers might be determined – even if DCF was quantified correctly – and wrong interpretations regarding e.g. catalyst activity or H2O2 concentration might be the consequences.
Based on the gained in-depth understanding, the cascade reaction using BCA and HRP was tunable to some extent (see e.g. cascade reactions 5, Fig. 8). More important for this work, however, the detailed analysis of the bulk solution reactions was essential for analysing the same cascade reaction run with immobilised BCA and HRP in a flow-through device, as discussed in the following sections.
3.2. Immobilisation of BCA and HRP in glass fiber filters
The two enzymes BCA and HRP were immobilised in borosilicate glass fiber filters with a methodology that has been elaborated before, see (Yoshimoto et al., 2018; Hou et al., 2019).52,59 The method is based on first preparing and characterising covalent dendronised polymer (denpol)-enzyme conjugates in bulk aqueous solution. Defined volumes of aqueous solutions of such conjugates at defined enzyme concentrations were then added to the glass fiber filters and incubated for 1 h at room temperature. Most efficient was the use of 50 μL solutions per filter since the entire volume was taken up by the filter through capillary forces. During the incubation, some of the conjugates present in the solution adsorbed on the surface of the fibers through non-covalent interactions. After placement of the filters containing the adsorbed conjugates inside a home-made filter holder,52 excess conjugate which did not adsorb and small amounts of free enzyme molecules that might still have been present in the conjugate solution were removed by pumping buffer solution through the filter holder device.The dendronised polymer used for the preparation of the conjugates was the same as in our previous work,52,59 abbreviated as de-PG21000 (Fig. 1). It was a deprotected (de) second generation denpol with on average 1000 r.u. per polymer chain and four peripheral amino groups per r.u. The enzyme molecules were connected covalently (via accessible lysine residues) to some of the amino groups along the denpol chains through stable bis-aryl hydrazone (BAH) bonds as linker units. For the work presented here, three conjugates were used, de-PG21000-BAH207-BCA152, de-PG21000-BAH152-BCA101, and de-PG21000-BAH86-HRP90. The subscripts indicate the average numbers of de-PG2 r.u., BAH bonds, and enzyme molecules per de-PG2 chain, as determined experimentally, see Materials and methods. In Fig. 1, the three conjugates are represented in a simplified way by drawing the denpol as stiff cylinder and the enzyme molecules as rigid spheres. Although the real situation is different, the conjugates being flexible structures,21 the representation shows, however, that a packing of the enzyme molecules along the denpol chain according to the experimentally determined loading density (average number of enzyme molecules per denpol chain) is spatially feasible and that the achieved loading does not appear to be the maximal loading theoretically possible.
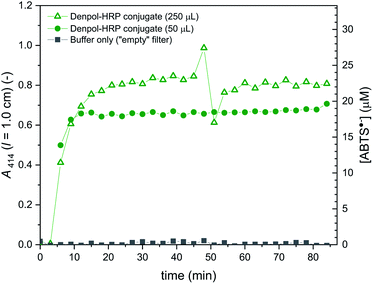
The activities of the immobilised conjugates were first determined separately using p-NA (p-nitrophenyl acetate) or ABTS2−/H2O2 as substrates for filters containing either immobilised de-PG21000-BAH152-BCA101 or de-PG21000-BAH86-HRP90. The results are shown in Fig. 9 (for the denpol-BCA conjugate) and Fig. 10 (for the denpol-HRP conjugate). For both conjugates, after an initial equilibration phase of a couple of minutes, the concentrations of the monitored reaction products in the outflow were constant, without any indication of significant enzyme leakage from the filters. Since BCA is not very efficient in catalysing the hydrolysis of p-NA, the flow rate in the experiments with immobilised de-PG21000-BAH152-BCA101 (3 μL min−1) was much lower than the one for filters with immobilised de-PG21000-BAH86-HRP90 (200 μL min−1).
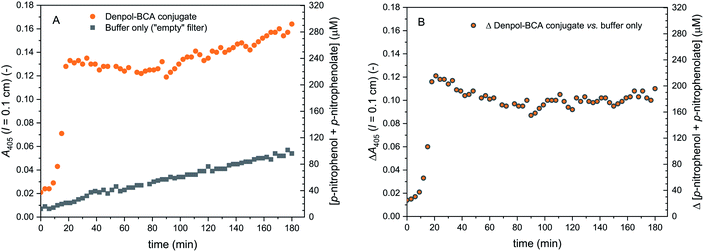 | ||
| Fig. 9 Activity of de-PG21000-BAH152-BCA101 immobilised in a glass fiber filter, measured with p-NA as substrate. The filter was loaded with denpol-BCA conjugate by using 250 μL of a conjugate solution (prepared in PB, 10 mM sodium phosphate buffer solution, pH = 7.2) with [BCA] = 2.2 μM, see Materials and methods and ESI (Section 5†). The filter was placed inside a filter holder device through which a solution of 1.0 mM p-NA (prepared in PB) was pumped through at room temperature at a flow rate of 3 μL min−1, and the UV/vis spectrum of the outflow was measured. On the left vertical axes, A405 (originating from p-nitrophenolate) is plotted vs. time for up to 180 min. (A) Raw data are shown for the reaction with immobilised denpol-BCA conjugate (filled orange circles) and for the background reaction for a filter which did not contain the conjugate (filled black squares). (B) Net formation of p-nitrophenolate due to the presence of immobilised BCA (raw data minus background). The total concentration of p-nitrophenol + p-nitrophenolate is shown on the right vertical axes, see Materials and methods for details. | ||
The results obtained with the denpol-HRP conjugate showed that stable immobilisation of HRP in glass fiber filters is easily possible, as in the case of the denpol-BCA conjugate.52 Furthermore, if an excess volume of the denpol-HRP solution (250 μL) was added to a filter so that the maximum volume that could be taken up by the filter (50 μL) was exceeded, the product concentrations in the filter outflow were very similar to the ones obtained by loading with 50 μL. This indicates that efficient enzyme loading can be achieved with a minimum volume of conjugate (e.g. for the used amount: 50 μL × 0.5 μM = 25 pmol active HRP in conjugated form per filter, see Materials and methods).
In addition to the immobilisation of the two enzymes in separate filters, stable co-immobilisation of both enzymes in one and the same filter was also shown to be equally simple by incubation of 50 μL of an aqueous solution prepared from stock solutions of both conjugates, see Materials and methods.
3.3. Cascade reaction of DCFH2-DA and H2O2 in a flow-through device with BCA and HRP immobilised in glass fiber filters
The same cascade reaction, which we first investigated in bulk solution with dissolved, free BCA and HRP added at the beginning of the reaction, was used for gaining information about the performance of the two enzymes when they were immobilised in glass fiber filters and used in a flow-through device. Different types of experiments were carried out, as illustrated in Fig. 11. In all cases, the outflow from the filters was analysed by recording the absorption spectrum between λ = 240 and 600 nm. The spectral region in which only the oxidised species absorb (λ = 330–600 nm) is shown in Fig. S-22, ESI.†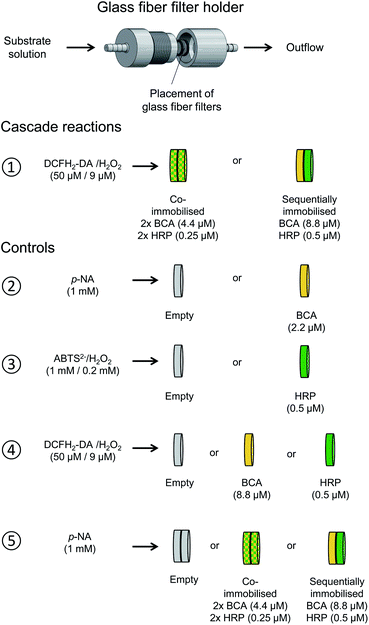 | ||
| Fig. 11 Illustration of the two setups used for the cascade reaction in a flow-through device consisting of glass fiber filters with immobilised denpol-BCA conjugate (yellow) and denpol-HRP conjugate (green) (①), and for the different control measurements carried out (②–⑤). All filters were loaded with 50 μL of the corresponding denpol-enzyme conjugate solutions or with 50 μL PB solution (pH = 7.2, “empty” filters). The enzyme concentrations in the conjugate solutions used for loading the filters are given in parenthesis; all filters were placed in the home-made filter holder52 and kept at room temperature; see Materials and methods. ①: Cascade reaction with co-immobilised BCA and HRP or with sequentially immobilised BCA (first) and HRP (second), analysed by using a PB solution containing 50 μM DCFH2-DA and 9 μM H2O2 as substrates. ②: Control measurements with an “empty” filter or with a filter containing immobilised BCA, using 1 mM p-NA in PB as substrate. ③: Control measurements with an “empty” filter or with a filter containing immobilised HRP, using 1 mM ABTS2− and 0.2 mM H2O2 as substrates. ④ Control measurements with an “empty” filter or with a filter containing either immobilised BCA or HRP, using 50 μM DCFH2-DA and 9 μM H2O2 as substrates. ⑤: Control measurements with two “empty” filters or with two filters containing either co-immobilised BCA and HRP or sequentially immobilised BCA (first) and HRP (second), using 1 mM p-NA in PB as substrate. | ||
In Fig. 12, A503 vs. the time the substrate solution consisting of DCFH2-DA (50 μM) and H2O2 (9 μM) in PB (pH = 7.2) was pumped through the filter holder device is shown for the cascade reaction with both enzymes co-immobilised in the same filter (① in Fig. 11, left hand side) and with sequentially immobilised enzymes (① in Fig. 11, right hand side: BCA first, HRP second). The DCF concentration in the outflow was calculated by assuming insignificant DCFox formation (which was shown to be a reasonable assumption, see below). For both arrangements, two independent experiments were carried out, see the legend of Fig. 12. The trend was in both sets of experiments the same: A503 for the co-immobilised enzymes was about 50% higher than A503 for the sequentially immobilised enzymes. This clearly indicates larger amounts of DCF formed for the co-immobilised enzymes (≈1.5 μM) as compared to the sequentially immobilised enzymes (≈0.9 μM). Analysis of the UV/vis spectra of the outflow between λ = 330 and 600 nm by spectral fitting, using the reference spectra shown in Fig. 2, showed, however, that for both arrangements (co-immobilised and sequentially immobilised) the total concentration [DCF] + [DCF-MA] was the same, see Fig. 13 and S-23, ESI.† The only difference was the ratio of the two products: 59% DCF with the co-immobilised enzymes, 39% DCF with the sequentially immobilised enzymes. In both cases, the “oxidation turnover” was the same (≈1.2–1.3 μM H2O2 out of the 9 μM present in the substrate solution which was pumped through the filters were “consumed” by the dichlorofluorescein derivative), indicating for both cases a similar amount of immobilized HRP. Moreover, no proximity or channeling effects were effective due to a co-immobilisation of the two enzymes, as this should speed up the oxidation as second reaction step. Of course the oxidation could theoretically only be speeded up by proximity or channeling effects, if oxidation would be a rate limiting step. In both cases (sequentially- and co-immobilized enzymes), no significant amounts of overoxidised products (no DCFox) were present in the outflow. Indeed, this identifies the oxidation reaction as a rate limiting step for the total amount of DCF-MA + DCF (while the hydrolysis reaction, i.e. BCA, was limiting the relative amount of DCF within the oxidised species DCF-MA + DCF).
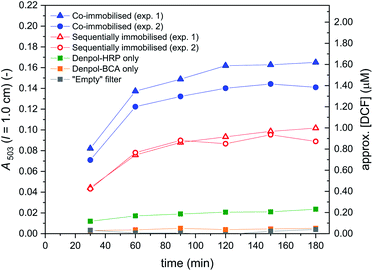 | ||
| Fig. 12 Cascade reaction in a flow-through device consisting of glass fiber filters with immobilised de-PG21000-BAH207-BCA152 and de-PG21000-BAH86-HRP90 (① in Fig. 11). The conjugates were immobilised by adding to each filter a volume of 50 μL of the denpol-enzyme conjugate solutions at the enzyme concentrations indicated in Fig. 11. Filled blue symbols: data for co-immobilised denpol-enzyme conjugates (two independent immobilisations and analyses). Empty red symbols: data for sequentially immobilised denpol-enzyme conjugates (denpol-BCA first, denpol-HRP second; two independent immobilisations and analyses). The performance of the immobilised enzymes was carried out by pumping a solution consisting of 50 μM DCFH2-DA and 9 μM H2O2 in PB (pH = 7.2) through the filter holder device at 5 μL min−1. The outflow was collected in portions of 150 μL in polypropylene tubes (collection for 30 min), followed by immediate measurement of the UV/vis absorption spectrum (Fig. S-22, ESI†). A503 is plotted against the time the substrate solution was pumped through the filters. Control measurements with either an “empty” filter, a filter containing immobilised denpol-BCA only, or a filter containing immobilised denpol-HRP only, were carried out according to ④ in Fig. 11. | ||
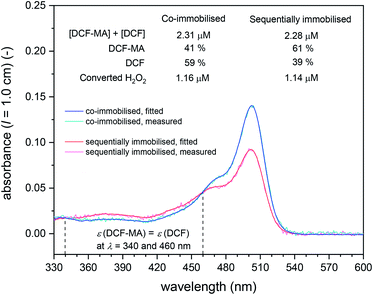 | ||
| Fig. 13 UV/vis absorption spectra between λ = 330 and 600 nm of the outflow from the filter holder device for cascade reactions ① in Fig. 11 for co-immobilised (blue) and sequentially immobilised conjugates (red), collected between t = 150 and 180 min (“exp. 2”, blue filled circle and red empty circle at t = 180 min in Fig. 12). The measured and fitted spectra are shown with the total concentrations of DCF-MA and DCF and the relative amounts of DCF-MA and DCF present in the outflow. The spectra fitting was done as described for the analysis of the reaction run in bulk solution (see caption of Table S-3, ESI†). | ||
Consequently, the reason for the difference in the amount of DCF formed in the two setups is not a different oxidation turnover (as already mentioned above), but a different extent of hydrolysis within the total amount of oxidised compounds (DCF-MA + DCF). This altered hydrolysis extent was caused by the different arrangement of the two enzymes. In the sequential immobilisation, BCA-catalysed hydrolysis reactions only take place before oxidations, disabling Hyd_3 in Scheme 2. Therefore, any compounds being oxidized according to pathway 2 will ultimately end up as DCF-MA and thus, formation of DCF is only possible via pathway 1 (Scheme 2). For the co-immobilised enzymes, BCA-catalysed hydrolysis and HRP-catalysed oxidation reactions are possible from the very beginning, allowing DCF formation to proceed along pathway 1 and pathway 2 (Scheme 2). For the sequential setup, the molar ratio of final DCF-MA to final DCF is predetermined by the molar ratio of DCFH2-MA to DCFH2 (thus by Hyd_2) when leaving the first filter containing immobilised BCA.73 Since in the co-immobilised setup, hydrolysis is possible before and after oxidation, the molar ratio of final DCF-MA to final DCF is determined by both, Hyd_2 and the more efficient Hyd_3 (Scheme 2). To sum up: the DCF to DCF-MA ratio in the sequential immobilisation was lower as only the less efficient hydrolysis of DCFH2-MA (Hyd_2) was determining it since the more efficient hydrolysis of DCF-MA (Hyd_3) was disabled. In contrast, for co-immobilised enzymes this ratio was determined by both hydrolysis reactions (both at the same time, as for simultaneously present enzymes in bulk solution). The extent of oxidation ([DCF] + [DCF-MA]), however, was the same in both setups.
The results of the control measurements ④ illustrated in Fig. 11 are shown in Fig. 12: A503 in the outflow remained low, as expected from the Controls 1, 2, and 4 made in bulk solution, see Fig. S-10, S-11, and S-14, ESI.†
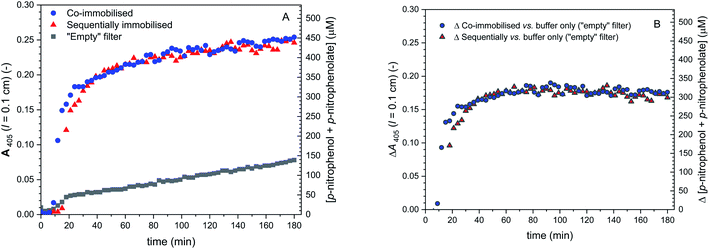
As mentioned, different DCF to DCF-MA molar ratios in the outflows were observed for the two different setups (co-immobilised and sequentially immobilized enzymes). Besides from different enzyme arrangements, the extent of hydrolysis is also dependent on the amount of immobilised BCA. In order to prove that the differences in the DCF to DCF-MA ratio for the two setups originated from a disabled hydrolysis of DCF-MA in the case of the sequentially immobilised enzymes and not from different amounts of immobilised BCA, control measurements ⑤ of Fig. 11 were carried out. BCA and HRP were again immobilised in glass fiber filters in the two different setups and placed in the filter holder. A 1 mM p-NA solution in PB (pH = 7.2) was then pumped through the two devices at the same flow rate and the outflow was analysed by measuring A405 (indicative for the formation of p-nitrophenolate) see Fig. 14. The two measurements gave identical A405 vs. time profiles, indicating that in both setups, the same amounts of active BCA were immobilised.
 | ||
| Fig. 14 Activity of de-PG21000-BAH207-BCA152 immobilised in glass fiber filters placed in a flow-through device, either together with de-PG21000-BAH86-HRP90 (blue symbols, two filters, co-immobilised) or sequentially with de-PG21000-BAH86-HRP90 in the second filter (red symbols, two filters, sequentially immobilised), measured with p-NA as substrate (experiments ⑤ in Fig. 11). The conjugates were immobilised by adding to each filter a volume of 50 μL of the denpol-enzyme conjugate solutions at the concentrations indicated in Fig. 11. A solution of 1 mM p-NA prepared in PB (pH = 7.2) was pumped through the filter device at 3 μL min−1. The outflow was analysed by measuring A405 (left vertical axes), from which the total concentrations of p-nitrophenolate + p-nitrophenol was calculated (right vertical axes), see Materials and methods. Data for background measurements with two “empty” filters are also shown (non-enzymatic p-NA hydrolysis). (A) Raw data. (B) Net formation of p-nitrophenolate and calculated total concentration of p-nitrophenolate + p-nitrophenol, due to the presence of BCA (raw data minus background). For both setups, the same outflow resulted, indicating identical BCA activity, i.e. identical denpol-BCA conjugate loading. | ||
4. Conclusions
The enzymatic conversion of DCFH2-DA into DCF, catalysed by BCA and HRP/H2O2, is a complex example of a two-enzyme cascade reaction. It is complex because two reaction pathways exist, involving five different reactions steps (Scheme 2). Moreover, under certain conditions the final product, DCF, may be further oxidised to DCFox (Scheme 1). Nevertheless, the reaction turned out to be an interesting model reaction that could be tuned and analysed in bulk solution by simple time-dependent UV/vis absorption measurements. The determination of the spectra of all components of the reaction (Fig. 2 and S-6, ESI†) and of the molar absorption coefficients of isosbestic points (Table 1) was crucial for understanding the changes in the absorption spectrum of the reaction mixture during the reaction. This detailed analysis in bulk solution was then the basis for analysing the outflow from a flow-through device containing glass fiber filters with immobilised BCA and HRP. Although the arrangement with co-immobilised BCA and HRP resulted in a higher yield of DCF as compared to sequentially immobilised enzymes (BCA first, HRP second), this higher yield was not due to a proximity effect. It is simply a consequence of the fact that the transformation of DCFH2-DA into DCF can occur via two possible pathways (Scheme 2). One pathway becomes “interrupted” halfway in the sequential arrangement (no hydrolysis after oxidation possible anymore, disabling one hydrolysis step), while both of them are still fully available for DCF formation when using co-immobilised enzymes (as for simultaneously added enzymes in bulk solution). Through which of the two pathways the reaction can proceed to the final product (DCF) thus depends on the arrangement of the enzymes. Through which of the two pathways the reaction will proceed to what extent depends on the amounts, i.e., the activities of the enzymes as well as the reaction time (the lower the HRP to BCA ratio, the higher the contribution from pathway 1; and the lower the reaction time, the higher the contribution from pathway 2, see Scheme 2).Concerning the methodology used for the immobilisation of the two enzymes in glass fiber filters, the previously developed protocol for BCA52 was slightly modified in terms of the amount of denpol-BCA conjugate solution added to the filter (actual immobilisation step via simple conjugate adsorption from aqueous solution) and in terms of the washing procedure. For HRP, stable immobilisation in the filters was successful following the procedure previously elaborated for immobilising the enzyme inside mesoporous silicate monoliths.59 Simple co-immobilisation was possible by solely mixing two different enzyme conjugate solutions in defined amounts before incubation in one and the same filter (showing similar activities as for individual immobilisations with the same stock solutions, see Fig. 14). This study confirms that the enzyme immobilisation methodology which we are being developing since a few years21,58,59,74,75 is a valuable alternative to the more conventional methods.2,76–78
Conflicts of interest
There are no conflicts of interest to declare.Acknowledgements
The authors thank the Swiss National Science Foundation (200021_175440) for financial support, Dr Daniel Messmer and Prof. A. Dieter Schlüter (D-MATL, ETH) for providing dendronised polymer, Dr Thomas Schweizer (D-MATL, ETH) for the fabrication of the glass fiber filter holder device, Dr Martin Willeke (D-MATL, ETH), Dr Reinhard Kissner and Dr Thomas Nauser (both D-CHAB, ETH) for discussions about the cascade reaction. K. S. acknowledges the Innovative Flex Course for Frontier Organic Material Systems (iFront) of Yamagata University (YU) for financial support for the research collaboration between YU and ETH. M. Y. acknowledges the Japan Society for the Promotion of Science (JSPS) KAKENHI grant number 15KK0241 for financial support. S. P.-E. thanks the Ministry of Science, Research and Technology of the Islamic Republic of Iran for the scholarship for staying at ETH (grant number 661026). P. S. is grateful to Prof. Sandra Incerpi (University Roma Tre) for discussions about DCFH2-DA.Notes and references
- I. Wheeldon, S. D. Minteer, S. Banta, S. C. Barton, P. Atanassov and M. Sigman, Nat. Chem., 2016, 8, 299–309 CrossRef CAS PubMed
.
- A. Küchler, M. Yoshimoto, S. Luginbühl, F. Mavelli and P. Walde, Nat. Nanotechnol., 2016, 11, 409–420 CrossRef PubMed
.
- P. Gruber, M. P. C. Marques, B. O'Sullivan, F. Baganz, R. Wohlgemuth and N. Szita, Biotechnol. J., 2017, 12, 1700030 CrossRef PubMed
.
- K. Meller, M. Szumski and B. Buszewski, Sens. Actuators, B, 2017, 244, 84–106 CrossRef CAS
.
- M. B. Quin, K. K. Wallin, G. Zhang and C. Schmidt-Dannert, Org. Biomol. Chem., 2017, 15, 4260–4271 RSC
.
- S. P. France, L. J. Hepworth, N. J. Turner and S. L. Flitsch, ACS Catal., 2017, 7, 710–724 CrossRef CAS
.
- Y. Zhang and H. Hess, ACS Catal., 2017, 7, 6018–6027 CrossRef CAS
.
- J. Britton, S. Majumdar and G. A. Weiss, Chem. Soc. Rev., 2018, 47, 5891–5918 RSC
.
- G. Zhang, M. B. Quin and C. Schmidt-Dannert, ACS Catal., 2018, 8, 5611–5620 CrossRef CAS
.
- S. Velasco-Lozano and F. López-Gallego, Biocatal. Biotransform., 2018, 36, 184–194 CrossRef CAS
.
- J. Yin, S. Chen, N. Zhang and H. Wang, ACS Appl. Mater. Interfaces, 2018, 10, 21883–21890 CrossRef CAS PubMed
.
- J. Shi, Y. Wu, S. Zhang, Y. Tian, D. Yang and Z. Jiang, Chem. Soc. Rev., 2018, 47, 4295–4313 RSC
.
- K. Vogele, J. List, F. C. Simmel and T. Pirzer, Langmuir, 2018, 34, 14780–14786 CrossRef CAS PubMed
.
- F. S. Aalbers and M. W. Fraaije, ChemBioChem, 2019, 20, 20–28 CrossRef CAS PubMed
.
- S. Tsikov and H. Hess, ACS Catal., 2019, 9, 2432–2439 CrossRef
.
- E. T. Hwang and S. Lee, ACS Catal., 2019, 9, 4402–4425 CrossRef CAS
.
- Z. Chen, H. Cao and T. Tan, New J. Chem., 2019, 43, 8517–8526 RSC
.
- A. Kuzmak, S. Carmali, E. von Lieres, A. J. Russell and S. Kondrat, Sci. Rep., 2019, 9, 455 CrossRef PubMed
.
- Y. Cao, X. Li, J. Xiong, L. Wang, L.-T. Yan and J. Ge, Nanoscale, 2019, 11, 22108–22117 RSC
.
- S. Fornera, T. Bauer, A. D. Schlüter and P. Walde, J. Mater. Chem., 2012, 22, 502–511 RSC
.
- A. Küchler, J. Adamcik, R. Mezzenga, A. D. Schlüter and P. Walde, RSC Adv., 2015, 5, 44530–44544 RSC
.
- S. Fornera, K. Yazawa and P. Walde, Anal. Bioanal. Chem., 2011, 401, 2307–2310 CrossRef CAS PubMed
.
- R. E. Childs and W. G. Bardsley, Biochem. J., 1975, 145, 93–103 CrossRef CAS PubMed
.
- P. D. Josephy, T. Eling and R. P. Mason, J. Biol. Chem., 1982, 257, 3669–3675 CAS
.
- S. Fornera and P. Walde, Anal. Biochem., 2010, 407, 293–295 CrossRef CAS PubMed
.
- A. S. Keston and R. Brandt, Anal. Biochem., 1965, 11, 1–5 CrossRef CAS PubMed
.
- C. P. LeBel, H. Ischiropoulos and S. C. Bondy, Chem. Res. Toxicol., 1992, 5, 227–231 Search PubMed
.
- J. P. Crow, Nitric Oxide, 1997, 1, 145–157 CrossRef CAS PubMed
.
- M. M. Tarpey and I. Fridovich, Circ. Res., 2001, 89, 224–236 CrossRef CAS PubMed
.
- J. Glebska and H. W. Koppenol, Free Radical Biol. Med., 2003, 35, 676–682 CrossRef CAS PubMed
.
- P. Wardman, Free Radical Biol. Med., 2007, 43, 995–1022 CrossRef CAS PubMed
.
- X. Chen, Z. Zhong, Z. Xu, L. Chen and Y. Wang, Free Radical Res., 2010, 44, 587–604 CrossRef CAS PubMed
.
- B. Kalayanaraman, V. Darley-Usmar, K. J. A. Davies, P. A. Dennery, H. J. Forman, M. B. Grisham, G. E. Mann, K. Moore, L. J. Roberts II and H. Ischiropoulos, Free Radical Biol. Med., 2012, 52, 1–6 CrossRef PubMed
.
- V. Balducci, S. Incerpi, P. Stano and D. Tofani, Biochim. Biophys. Acta, Biomembr., 2018, 1869, 600–610 CrossRef PubMed
.
- J. D. Cohen and H. D. Husic, Phytochem. Anal., 1991, 2, 60–64 CrossRef CAS
.
- E. D'Aguanno, E. Altamura, F. Mavelli, A. Fahr, P. Stano and P. L. Luisi, Life, 2015, 5, 969–996 CrossRef PubMed
.
- H. Leonhardt, L. Gordon and R. Livingston, J. Phys. Chem., 1971, 75, 245–249 CrossRef CAS
.
- N. O. Mchedlov-Petrossyan, M. I. Rubtsov and L. L. Lukatskaya, Dyes Pigm., 1992, 18, 179–198 CrossRef CAS
.
- C. Rota, Y. C. Fann and R. P. Mason, J. Biol. Chem., 1999, 274, 28161–28168 CrossRef CAS PubMed
.
- Variations of this type of two-enzyme cascade reaction according to pathway 1 are well known from literature and often applied as qualitative assay29 for detecting the presence of certain reactive oxygen or reactive nitrogen species (ROS or RNS, e.g. hydroxyl radicals, HO˙, or nitrogen dioxide radicals,
 )28,30,31 inside biological cells.32,33 The principle is the following. If added to biological cells, lipophilic DCFH2-DA permeates across the cell membrane.32 Inside the cells, the hydrolysis of DCFH2-DA is catalysed by intracellular esterases, and the formed membrane-impermeable DCFH2 reacts non-specifically with ROS or RNS to yield DCF.31,32 According to literature, H2O2 alone cannot directly oxidise DCFH2,32,41,42 while DCFH2 oxidation in aerobic aqueous solution containing H2O2 occurs with peroxidases like HRP.31,41 In our investigations, BCA was used as “esterase” and HRP/H2O2 and dissolved O2 as oxidants.
 - H. Ischiropoulos, A. Gow, S. R. Thom, N. W. Kooy, J. A. Royall and J. P. Crow, Methods Enzymol., 1999, 301, 367–373 CAS
.
- M. B. Grisham, Comp. Biochem. Physiol., Part A: Mol. Integr. Physiol., 2013, 165, 429–438 CrossRef CAS PubMed
.
- C. F. Chignell and R. H. Sik, Free Radical Biol. Med., 2003, 34, 1029–1034 CrossRef CAS PubMed
.
- C. Rota, C. F. Chignell and R. P. Mason, Free Radical Biol. Med., 1999, 27, 873–881 CrossRef CAS PubMed
.
- N. C. Veitch and A. T. Smith, Adv. Inorg. Chem., 2001, 51, 107–162 CrossRef CAS
.
- G. I. Berglund, G. H. Carlsson, A. T. Smith, H. Szöke, A. Henriksen and J. Hajdu, Nature, 2002, 417, 463–468 CrossRef CAS PubMed
.
- H. B. Dunford, Peroxidases & Catalases: Biochemistry, Biotechnology, and Physiology, John Wiley & Sons, 2nd edn, 2010, ch. 3, pp. 13–39 Search PubMed
.
- M. Wrona and P. Wardman, Free Radical Biol. Med., 2006, 41, 657–667 CrossRef CAS PubMed
.
- E. Marchesi, C. Rota, Y. C. Fann, C. F. Chignell and R. R. Mason, Free Radical Biol. Med., 1999, 26, 148–161 CrossRef CAS PubMed
.
- B. H. J. Bielski and A. O. Allen, J. Phys. Chem., 1977, 81, 1048–1050 CrossRef CAS
.
- M. Li, L. Liu, Y. Shi, Y. Yang, H. Zheng and Y. Long, New J. Chem., 2017, 41, 7578–7582 RSC
.
- M. Yoshimoto, T. Schweizer, M. Rathlef, T. Pleij and P. Walde, ACS Omega, 2018, 3, 10391–10405 CrossRef CAS PubMed
.
- R. Saito, T. Sato, A. Ikai and N. Tanaka, Acta Crystallogr., Sect. D: Biol. Crystallogr., 2004, 60, 792–795 CrossRef PubMed
.
- V. M. Krishnamurthy, G. K. Kaufman, A. R. Urbach, I. Gitlin, K. L. Gudiksen, D. B. Weibel and G. M. Whitesides, Chem. Rev., 2008, 108, 946–1051 CrossRef CAS PubMed
.
- S. Lindskog, Biochim. Biophys. Acta, 1960, 39, 218–226 CrossRef CAS
.
- H. B. Dunford and J. S. Stillman, Coord. Chem. Rev., 1976, 19, 187–251 CrossRef CAS
.
- S. Aibara, H. Yamashita, E. Mori, M. Kato and Y. Morita, J. Biochem., 1982, 92, 531–539 CrossRef CAS PubMed
.
- A. Küchler, D. Messmer, A. D. Schlüter and P. Walde, Methods Enzymol., 2017, 590, 445–474 Search PubMed
.
- C. Hou, N. Ghéczy, D. Messmer, K. Szymańska, J. Adamcik, R. Mezzenga, A. B. Jarzębski and P. Walde, ACS Omega, 2019, 4, 7795–7806 CrossRef CAS PubMed
.
- R. W. Noble and Q. H. Gibson, J. Biol. Chem., 1970, 245, 2409–2413 CAS
.
- A. Innocenti, A. Scozzafava, S. Parkkila, L. Puccetti, G. De Simone and C. T. Supuran, Bioorg. Med. Chem. Lett., 2008, 18, 2267–2271 CrossRef CAS PubMed
.
- H. B. Dunford, Peroxidases and Catalases: Biochemistry, Biotechnology, and Physiology, John Wiley & Sons, 2nd edn, 2010, ch. 4, pp. 41–56 Search PubMed
.
- P. Campomanes, U. Rothlisberger, M. Alfonso-Prieto and C. Rovira, J. Am. Chem. Soc., 2015, 137, 11170–11178 CrossRef CAS PubMed
.
- M. J. Reiniers, R. F. van Golen, S. Bonnet, M. Broeckgaarden, T. M. van Gulik, M. R. Egmond and M. Heger, Anal. Chem., 2017, 89, 3853–3857 CrossRef CAS PubMed
.
- J. Hofmann and M. Sernetz, Anal. Biochem., 1983, 131, 180–186 CrossRef CAS PubMed
.
- F. Fiedler and H. Hinz, Eur. J. Biochem., 1994, 222, 75–81 CrossRef CAS PubMed
.
- B. H. J. Bielski, D. E. Cabelli, R. L. Arudi and A. B. Ross, J. Phys. Chem. Ref. Data, 1985, 14, 1041–1100 CrossRef CAS
.
- I. B. Afanas'ev, Superoxide Ion Chemistry and Biological Implications, CRC Press, Boca Raton, FL, 1st edn, 1991, ch. 5, vol. II, pp. 135–205 Search PubMed
.
- M. Hayyan, M. A. Hashim and I. M. AlNashef, Chem. Rev., 2016, 116, 3029–3085 CrossRef CAS PubMed
.
- The fact that a stable absorption spectrum was reached indicates that DCFH2 was not oxidised without H2O2 under the conditions used during the experiments. The absorption peak at λ = 287 nm originating from DCFH2 remained unaltered between t = 15 and 19 min, see Fig. S-20B, ESI.†.
- For transient [H2O2] > [DCFH2], an additional condition for DCF overoxidation is that HRP is not completely “occupied” with the kinetically favored oxidation of DCFH2 until the transient condition [H2O2] > [DCFH2] is not met anymore. This additional condition is not valid anymore for low HRP concentrations in the cascade reaction (see 3.1.6.).
- Hydrolysis of DCF-MA can also be seen from the decrease in A370. At λ = 370 nm, DCF does not absorb significantly, see Fig. 2B.
- Of ocurse this is only valid as long as the hydrolysis of DCFH2-MA to DCFH2 was not yet complete in the solution leaving the first filter. Such incomplete hydrolysis was confirmed by the presence of DCF-MA in the filter outflow.
- S. Fornera, P. Kuhn, D. Lombardi, A. D. Schlüter, P. S. Dittrich and P. Walde, ChemPlusChem, 2012, 77, 98–101 CrossRef CAS
.
- A. Küchler, J. N. Bleich, B. Sebastian, P. S. Dittrich and P. Walde, ACS Appl. Mater. Interfaces, 2015, 7, 25970–25980 CrossRef PubMed
.
- R. A. Sheldon and S. van Pelt, Chem. Soc. Rev., 2013, 42, 6223–6235 RSC
.
- S. B. Sigurdardóttir, J. Lehmann, S. Ovtar, J.-C. Grivel, M. Della Negra, A. Kaiser and M. Pinelo, Adv. Synth. Catal., 2018, 360, 2578–2607 CrossRef
.
- Y.-K. Cen, Y.-X. Liu, Y.-P. Xue and Y.-G. Zheng, Adv. Synth. Catal., 2019, 361, 5500–5515 CrossRef CAS
.
Footnotes |
| † Electronic supplementary information (ESI) available. See DOI: 10.1039/d0ra01204a |
| ‡ Equal contributions. |
| § Original affiliation: Graduate School of Organic Materials Science, Yamagata University, 4-3-16 Jonan, Yonezawa, Yamagata, 992-8510, Japan. |
| ¶ Original affiliation: Polymer Laboratory, Nano-Chemistry Division, School of Chemistry, College of Science, University of Tehran, P. O. Box 14155-6455, Tehran, Iran. |
| This journal is © The Royal Society of Chemistry 2020 |

