DOI:
10.1039/D0RA01163K
(Paper)
RSC Adv., 2020,
10, 11188-11199
Stepwise separation of poplar wood in oxalic acid/water and γ-valerolactone/water systems
Received
6th February 2020
, Accepted 8th March 2020
First published on 17th March 2020
Abstract
A cost-efficient methodology was developed for a two-step removal of hemicellulose from lignocellulosic biomass, thereby yielding C5 sugars, further separated residue, and high purity cellulose as well as lignin. In the first step of the process, an oxalic acid (OA)-assisted hydrolysis pretreatment was conducted for the selective decomposition of hemicellulose to C5 sugars. The optimized process conditions were as follows: temperature: 160 °C, OA concentration: 1%, holding time: 10 min. Under these conditions, various monosaccharides and other intermediates were obtained and more than 98.32% of the hemicellulose was removed from the original poplar. In the second step of the process, to extract lignin, a low concentration of sulfuric acid was used as a catalyst during the treatment of samples in a γ-valerolactone/H2O system; more than 91.57% lignin was removed, 82.99% cellulose was retained in the solid cellulose-rich substrates, and 94.45% (i.e., high-purity) cellulose was obtained. This method can be used for efficient fractionation of hemicellulose, cellulose, and lignin with the aim of achieving high value utilization of the entire biomass.
Introduction
Increasing economic and social development has resulted in increased consumption of petroleum fossil resources, leading to the depletion of these resources and the gradual deterioration of the environment.1–3 Lignocellulose biomass is an abundant renewable starting material that is a possible replacement for nonrenewable petroleum resources used in the sustainable production of chemicals and fuels.4,5 This material is mainly composed of cellulose, hemicellulose, and lignin. Biomass is characterized by a cellulose content of ∼35–50%. Cellulose is a D-glucose baseline type polymer homopolysaccharide, which is formed by linking β-1,4-glycosidic bonds.6–8 Cellulose can be converted to glucose by means of hydrolysis or biotransformation, or via further chemical or biological processing that yields ethanol or other products.9 Biomass is characterized by a hemicellulose content of ∼20–30%. Hemicellulose is a heterogeneous oligosaccharide that is composed of two or more types of monosaccharides, such as xylose, arabinose, mannose, and glucose.6,10 Lignin is a complex hydrophobic cross-linked aromatic polymer composed of phenylpropane structural units linked by ether bonds and carbon–carbon bonds.11,12 This substance is the second-most abundant component in plants and accounts for ∼20–35% of biomass.13,14 Therefore, lignin is considered an important renewable resource for the production of chemicals or materials, such as additives for concrete admixtures, dust control, feed and food additives, dispersants, resin, and binder compositions.15,16 However, complete separation of these three biomass components is difficult, owing to the high crystallinity of cellulose, complex chemical cross-linking between components, and sheathing of cellulose by hemicellulose and lignin.17–19
Many studies have focused on improving the utilization efficiency of lignocellulosic biomass. However, the composition varies among lignocelluloses and therefore, a suitable pretreatment method for improving the utilization efficiency of this material and reducing the cost is needed.20 Pretreatment methods employing chemical, physical, biological approaches, ionic liquids, and combinations of these approaches have achieved some improvement.21,22 For example, a dilute acid hydrothermal pretreatment process has been used for hemicellulose removal and degradation into C5 sugars (e.g., xylose and arabinose) and a small amount of intermediates (e.g., furfural and acetic acid). Unlike inorganic acids such as H2SO4 and HNO3, OA is a weak acid with a dicarboxylic acid structure. This acid can be used for highly selective hydrolysis of hemicellulose and can be obtained from natural resources of biomass.23–25 Compared with traditional chemical pretreatment methods, the dilute acid hydrothermal pretreatment method, which results in only mild corrosion on equipment and mild reaction conditions, has received increasing attention.25,26 Owing to its unique properties, OA serves as a suitable catalyst for biomass pretreatment. The removal of hemicellulose loosens the compact framework structure of the biomass and increases the contact space for the separation of lignin and cellulose.
Due to its natural complexity and high stability, lignin is the most recalcitrant among the three components of lignocellulosic biomass.27,28 Compared with the traditional process of extracting lignin, the organosolv process is advantageous because lignin can be isolated from the lignocellulosic biomass and the solvent can be easily recycled at lower environmental impacts.29,30 In recent years, a mixed system of γ-valerolactone (GVL) and water has been considered a promising biomass-transformed organic solvent system.31–33 The GVL/H2O system employed under mild processing conditions can achieve almost complete isolation of lignin from lignocellulosic biomass with negligible degradation of cellulose. This can improve the preservation of β-O-4 bonds in lignin and reduce the condensation of lignin derivatives.34
Previous biomass treatment technologies have focused on the study of single systems, often at the expense of a biomass component, thereby leading to inefficient use of each entire biomass component. Hemicellulose mainly exists in the amorphous region of the raw material, and is difficult to remove via hydrothermal treatments. Oxalic acid is derived from the natural renewability of biomass and, hence, a small amount of oxalic acid can produce H+ for effective removal of hemicellulose during the reaction. The removal of hemicellulose breaks the connection between cellulose and lignin, and this breakage is favorable for dissolving lignin in GVL. Therefore, we proposed a green and efficient fractionation strategy combining OA/H2O and GVL/H2O stepwise separation (Fig. 1). In this process, the hemicellulose was removed by means of an OA-assisted hydrolysis process. The liquor and solid fractions were then determined under various temperatures, times, and concentration of OA after the pretreatment process. Subsequently, fractionation trials were performed under the GVL/H2O solvent system for pretreatment-sample delignification, using dilute sulfuric acid as a catalyst. The cellulose-rich solids obtained after separation were then characterized, the fraction of lignin precipitated was determined, and possible applications were evaluated, based on the lignin properties. To the best of our knowledge, it is the first time we have proposed a green and efficient separation method for biomass which combined with OA/H2O and GVL/H2O treatment.
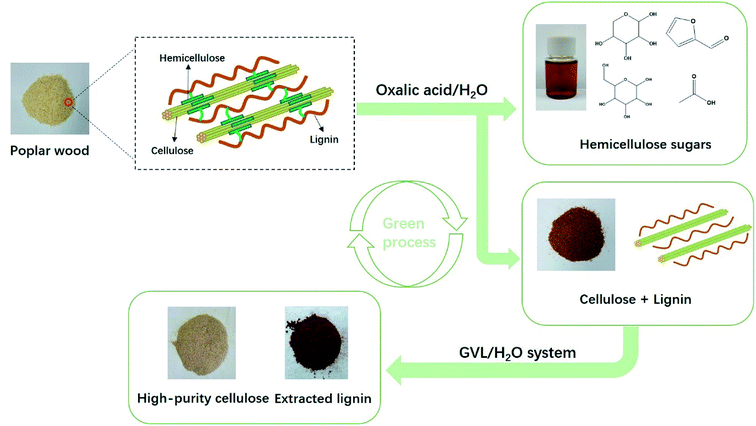 |
| | Fig. 1 Process diagram for the selective fractionation of poplar into hemicellulose sugars, high-purity cellulose, and lignin. | |
Materials and methods
Materials
In this study, poplar feedstock was purchased from a farm (Nanjing, China), passed through a 250–420 μm sieve, and placed for 12 h in a 105 °C constant-temperature oven for drying to a constant weight. The absolutely dry granules were kept in a sealed bag until needed. OA dihydrate (99% purity) was purchased from Lingfeng Chemical Reagent Co., Ltd. (Shanghai). In addition, γ-valerolactone (98% purity) and sulfuric acid (98% purity) were purchased from Shanghai Aladdin Biochemical Technology Co., Ltd. and Nanjing Chemical Reagent Co., Ltd., respectively. All the chemical reagents were of analytical grade and were used without further processing.
OA-assisted hydrolysis pretreatment
The OA-assisted liquefaction reaction was performed in a 1 L reactor. Prior to the reaction, 50 g of the previously treated poplar feedstock was placed in the reactor, and then a 500 mL of the prepared OA solution was slowly added to the reactor. The solid–liquid ratio of the reaction mixture was 1![[thin space (1/6-em)]](https://www.rsc.org/images/entities/char_2009.gif) :
:![[thin space (1/6-em)]](https://www.rsc.org/images/entities/char_2009.gif) 10. The reactor was heated (stirring rate: 350 rpm) to the set temperature and maintained at this temperature for the time determined by the experimental design. After the reaction, the reactor was rapidly cooled to room temperature with condensed water and then opened. The reaction mixture (solid residue and water-soluble component) was separated via filtration through a filter paper, and the solid was washed three times with distilled water. After this separation, the liquid components were evaluated by means of high-performance liquid chromatography (HPLC). The solid was dried for 12 h in an oven at 105 °C.
10. The reactor was heated (stirring rate: 350 rpm) to the set temperature and maintained at this temperature for the time determined by the experimental design. After the reaction, the reactor was rapidly cooled to room temperature with condensed water and then opened. The reaction mixture (solid residue and water-soluble component) was separated via filtration through a filter paper, and the solid was washed three times with distilled water. After this separation, the liquid components were evaluated by means of high-performance liquid chromatography (HPLC). The solid was dried for 12 h in an oven at 105 °C.| |
 | (1) |
| |
 | (2) |
| |
 | (3) |
| |
 | (4) |
| |
 | (5) |
where, mo is the mass of the poplar feedstock; ms is the mass of the solid residues; mCo, mHo, mLo are the mass values of cellulose, hemicellulose, and lignin in raw poplar wood, respectively; mCr, mHr, mLr are the mass values of cellulose, hemicellulose, and lignin, respectively, in the solid residues after liquefaction. The de-cellulose rate and de-hemicellulose rate refer to the degree of cellulose and hemicellulose removal, respectively, from the feedstock. Similarly, the re-lignin rate refers to the retention of lignin in the feedstock, while the re-cellulose rate refers to the retention of cellulose.
Separation of cellulose and lignin in the GVL/H2O system
After the OA-assisted liquefaction treatment of the poplar feedstock, the separation of cellulose and lignin in the pretreated materials was conducted in a GVL/H2O system. During the process, 5 g of the pretreated sample and 60 g of the GVL/H2O (7/3 by weight) solution mixture followed by 10 mM H2SO4 were added to a 100 mL sealed reactor. The reactor was heated to a set temperature and kept for 2 h under stirring from an agitator. After the reaction, the reactor was cooled to room temperature using cooling water, and the reaction mixture was separated into a solid and a liquid phase by means of filtration through a filter paper. The solid was washed with 60 g of GVL/H2O after the reaction, and then repeatedly washed with deionized water and subsequently dried for 12 h in an oven at 105 °C. The liquid was precipitated by adding water to precipitate lignin, which was subsequently washed three times with deionized water and then subjected to a 15 min ultrasonic treatment. Afterward, the lignin was dried in an oven at 105 °C.
The content of each component in the solid and the purity of cellulose and lignin are calculated as follows:
| |
 | (6) |
| |
 | (7) |
| |
 | (8) |
| |
 | (9) |
where,
mL,
mC are the mass values of lignin and cellulose, respectively, in the solid after the GVL/H
2O treatment,
mG,
mP are the mass of solid after the GVL/H
2O treatment and before the GVL/H
2O treatment, respectively,
mLp is the mass of lignin in the solid after the OA hydrolysis pretreatment.
Analytical methods
Compositional analysis of samples
The cellulose, hemicellulose, and lignin content of the feedstock and the samples subjected to the OA pretreatment and GVL/H2O treatment was determined using the two-step hydrolysis method based on NREL/TP-510-42618.
X-ray diffraction (XRD) analysis
The crystallinity of the samples after the OA-assisted liquefaction and GVL/H2O treatment was evaluated via XRD (XRD-6000 X-ray diffractometer) with monochromatic Cu/Kα radiation (λ = 0.15418 nm). The diffraction intensity was measured from 10 to 60° (2θ) using a counting speed of 2° min−1 (step: 0.02°). In addition, the crystallinity index (CrI) of cellulose in the biomass was calculated as follows:| | |
CrI% = (I002 − Iam)/I002 × 100%
| (10) |
where, I002 is the peak intensity of the (002) lattice diffraction at 2θ = 22.4° and Iam is the diffraction intensity of the amorphous region at 2θ = 18.0°.
High-performance liquid chromatography (HPLC) analysis
Sugar and its derivatives in the hydrolyzate after the OA pretreatment were characterized by means of HPLC (Agilent 1260, USA). The instrument was equipped with an Aminex Bio-Rad (Hercules, CA, USA) HPX-87H (300 × 7.8 mm) column and a refractive index detector. A flow rate of 0.6 mL min−1 was employed for the mobile phase, i.e., 5 mM H2SO4, and the column temperature was maintained at 50 °C.
Fourier transform infrared spectroscopy (FT-IR) analysis
Changes in the functional groups of the feedstock and the solid samples were determined by means of FT-IR with a Thermo 208 Nicolet (NEXUS 670) spectrometer. The spectra of samples were recorded (resolution: 2 cm−1) in ATR mode, and data was collected for wavenumbers ranging from 600 to 4000 cm−1.
Thermogravimetric analysis (TGA)
The TGA of the feedstock and samples subjected to the OA-assisted hydrolysis and GVL/H2O treatment were conducted using a Pyris6 TG analyzer (PerkinElmer, Waltham, MA, USA). The samples (∼10 mg) were heated from room temperature to 800 °C (heating rate: 10 °C min−1) under a nitrogen atmosphere (flow: 50 mL min−1).
Scanning electron microscopy (SEM) analysis
Scanning electron microscopy (NeoScope JCM-5000, accelerating voltage: 5–10 kV) was used to observe the surface morphology of the raw materials and the treated samples. The images obtained before and after the reaction were compared.
Gel permeation chromatography (GPC) analysis
To determine the molecular weight distribution of the extracted lignin, the molecular weight distribution of the recovered lignin sample was determined via GPC using a Waters 1515 system equipped with a manually packed column. Polystyrene and tetrahydrofuran were used as an internal standard and the solvent, respectively.
Carbon-13 cross polarization/magic angle spinning nuclear magnetic resonance (13C CP/MAS NMR) spectroscopy
The 13C CP/MAS solid state NMR analysis on the samples subjected to OA-assisted hydrolysis and GVL/H2O treatment was performed on a BRUKER AVIII 400 HD instrument (at room temperature) using a relaxation delay of 2.5 s. Each sample was scanned 800 times in total.
2D heteronuclear single quantum coherence nuclear magnetic resonance (HSQC NMR) spectroscopy analysis
The precipitated lignin was characterized by means of 2D HSQC NMR spectroscopy that allowed analysis of the specific structures comprising the complex compounds. The NMR samples were prepared by dissolving the lignin oil in DMSO-d6 at 30 °C with benzaldehyde as an internal reference. Each NMR experiment was performed on a Bruker DRX 500 NMR spectrometer operated at 500 MHz. The spectral widths for the 1H and 13C dimensions were 8.5 and 120 ppm, respectively.
Results and discussion
Decomposition of hemicellulose-produced C5 sugars via OA-assisted liquefaction
Compositional analysis of solid residues after the OA pretreatment. The poplar feedstock was pretreated in an aqueous system of OA for maximum removal of hemicellulose while retaining the cellulose and lignin. The effects of reaction temperature, holding time, and OA concentration on the product components and hydrolysis process were investigated. Fig. 2(a) shows the effect of temperature on hemicellulose removal as well as cellulose and lignin retention. The removal rate of hemicellulose increased from 90.72% to 99.26% when the temperature increased from 140 °C to 180 °C and a small amount of cellulose and lignin was lost. Fig. 2(b) shows the changes in the three components of poplar wood under different OA concentrations during the hydrolysis process. The addition of OA led to a significant increase in the hydrolysis rate (25.6% at 0.5% OA vs. 9.4% at 0% OA) and the hemicellulose removal rate. Similarly, the hemicellulose removal rate increased from 27.22% to 97.83%, i.e., almost all the hemicellulose was removed. Fig. 2(c) shows the effect of holding time on the removal and retention of components. These results are essentially attributed to the structural nature of the dicarboxylic of OA, which hemicellulose was selectively hydrolyzed by H+ released from OA during the reaction. Unlike previous studies, we have almost minimal loss of cellulose and lignin while removing hemicellulose.
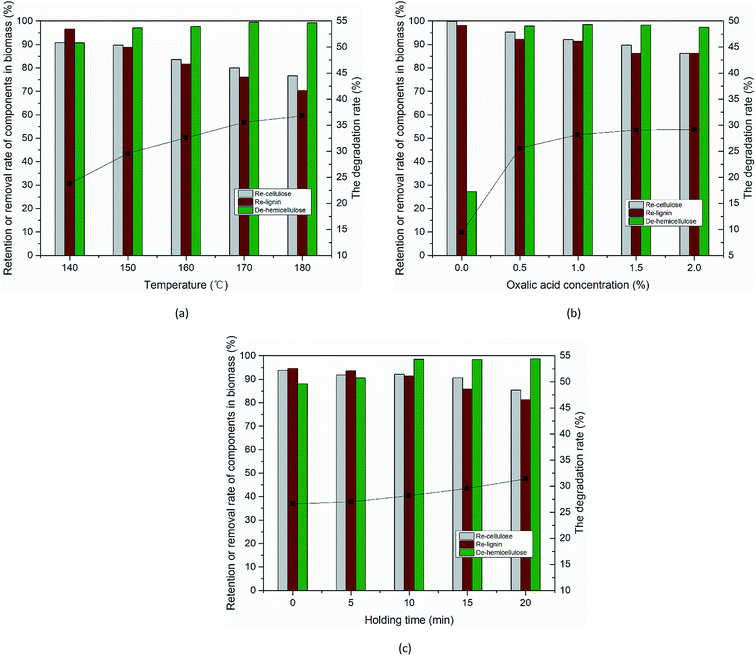 |
| | Fig. 2 Changes in the degree of retention or removal of biomass components and degree of OA hydrolysis for hydrolysis performed at different (a) temperatures, (b) OA concentrations, and (c) holding times. (a) 10 min, 3% OA, (b) 160 °C, 10 min, (c) 160 °C, 1% OA. Note: the column corresponds to the left coordinate, and the broken line corresponds to the right coordinate. | |
FT-IR spectroscopy analysis was performed on the feedstock and samples pretreated at different temperatures. As shown in Fig. 3(a), the unique structural spectra of cellulose, hemicellulose, and lignin ranged mainly from 700 to 2000 cm−1. The bands occurring at 1736 and 1245 cm−1 were generated mainly by the tensile vibration of the C![[double bond, length as m-dash]](https://www.rsc.org/images/entities/char_e001.gif) O and C–O bonds of the acetyl groups in hemicellulose.35 Moreover, the gradual disappearance of the absorbance peaks was attributed to the removal of hemicellulose with increasing temperature. The characteristic absorbance peaks of cellulose occurred at 2900, 1422, 1161, 1104, 1060, and 897 cm−1. In addition, the spectrum remained almost unchanged with varying temperature, indicating that the pretreatment had little effect on the crystalline cellulose. The absorbance peaks at 1593, 1509, 1454, and 1422 cm−1 are associated with the typical features of lignin. Furthermore, the characteristic peaks of lignin in the solid samples treated at different temperatures after hydrolysis were more pronounced than those of the feedstock, indicating that lignin remained in the solid residues. Fig. 3(b) shows the changes in the crystal structure and crystallinity of cellulose at different temperatures. A CrI of 52.26% was determined for the poplar feedstock, and the CrI of the pretreatment sample increased by 5.03% when the temperature was increased from 140 °C to 180 °C. These results showed that the removal of hemicellulose and amorphous cellulose resulted in increased crystallinity, as confirmed by the compositional analysis of the sample.
O and C–O bonds of the acetyl groups in hemicellulose.35 Moreover, the gradual disappearance of the absorbance peaks was attributed to the removal of hemicellulose with increasing temperature. The characteristic absorbance peaks of cellulose occurred at 2900, 1422, 1161, 1104, 1060, and 897 cm−1. In addition, the spectrum remained almost unchanged with varying temperature, indicating that the pretreatment had little effect on the crystalline cellulose. The absorbance peaks at 1593, 1509, 1454, and 1422 cm−1 are associated with the typical features of lignin. Furthermore, the characteristic peaks of lignin in the solid samples treated at different temperatures after hydrolysis were more pronounced than those of the feedstock, indicating that lignin remained in the solid residues. Fig. 3(b) shows the changes in the crystal structure and crystallinity of cellulose at different temperatures. A CrI of 52.26% was determined for the poplar feedstock, and the CrI of the pretreatment sample increased by 5.03% when the temperature was increased from 140 °C to 180 °C. These results showed that the removal of hemicellulose and amorphous cellulose resulted in increased crystallinity, as confirmed by the compositional analysis of the sample.
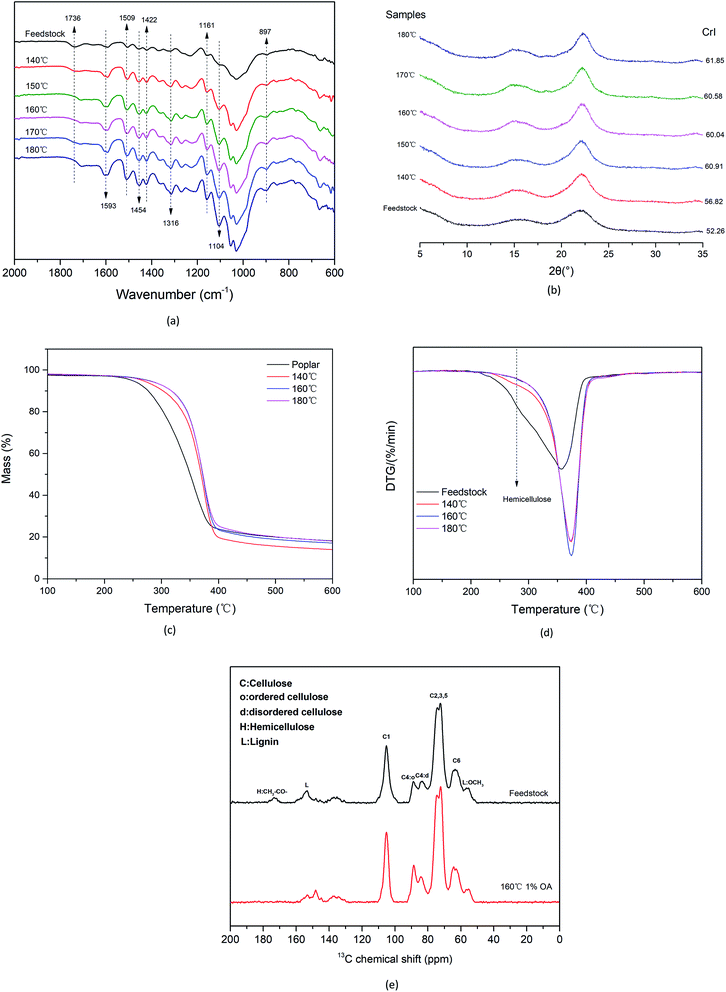 |
| | Fig. 3 (a), (b), (c), and (d) show the FT-IR, XRD, TG, DTG analysis results, respectively, of the feedstock and solid residues obtained after the OA/H2O treatment at various temperatures. (e) 13C CPMAS solid-state NMR spectra of the feedstock and pretreated samples. | |
The TG and DTG curves of the feedstock and pretreated samples are shown in Fig. 3(c) and (d). The sharp broad peak at ∼280 °C resulting from the decomposition of hemicellulose in the feedstock gradually disappeared, indicating that hemicellulose was gradually removed when the temperature was increased. Moreover, the peak near 355 °C was generated mainly by cellulose pyrolysis, and further pyrolysis led to the decomposition of lignin.36,37 The functional-group structure of the hemicellulose-removed sample and the feedstock was further investigated by means of 13C CP/MAS NMR spectroscopy. As shown in Fig. 3(e), sharp peaks corresponding to cellulose C1 at 105 ppm (due to the anomeric carbon in the cellulose structure) occur in the spectra of the feedstock and the pretreated sample. Overlapping signals from cellulose C2 to C6 at 60–110 ppm were also observed. The most intense chemical shifts at 74 ppm and 72 ppm are attributed to C2, C3, and C5 carbons in carbohydrates. The two peaks at 88 ppm and 82 ppm arose from C4 in crystalline and amorphous cellulose, respectively.38,39 The signal at a chemical shift of 173 ppm is attributed to the carboxyl carbon in the hemicellulose acetyl group, although the signal is relatively weak. Signals at chemical shifts of 153 ppm and 55 ppm are attributed to methyl ether in lignin.40 The 13C CP/MAS NMR results also provide evidence for the efficient removal of hemicellulose. Furthermore, the solid residual pretreated sample contained higher cellulose and lignin components. In addition, the signal of the disordered cellulose in the pretreated sample became weaker than that of the feedstock, indicating that the amorphous cellulose was depolymerized.
The SEM images of the raw materials and the samples after OA-assisted hydrothermal treatment are shown in Fig. 4. In addition, the morphological structure of the solid residue under different temperature conditions was analyzed. The surface structure of the sample changed significantly after the OA pretreatment. Compared with the raw materials, which were smooth, dense, and had orderly surfaces, the surface of each treated sample became increasingly irregular with increasing temperature. At 180 °C, the solid surface became loose, many small fragments appeared, and some of the cellulose was destroyed, i.e., the cellulose and lignin underwent severe degradation.
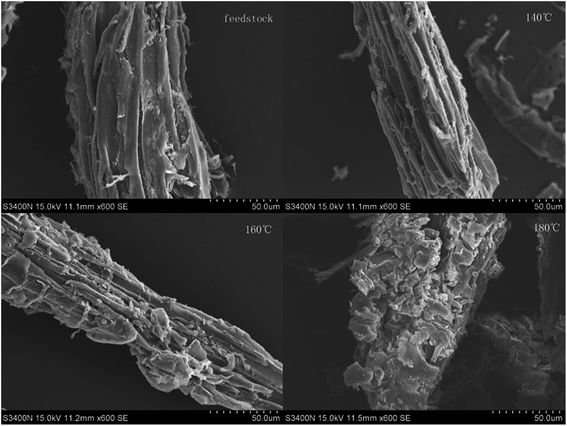 |
| | Fig. 4 SEM images of raw poplar and residues obtained at different temperatures. | |
Compositional analysis of liquors after the OA pretreatment. High-performance liquid chromatography was used to analyze the components of the OA-treated liquid, and various small-molecule products (such as xylose, arabinose, acetic acid, furfural, glucose, and HMF) were detected in the liquid. Xylose and arabinose were produced by the cleavage of hemicellulose. Xylose was the main liquid component, indicating that the dicarboxylic acid properties of OA yield excellent selectivity for the hydrolyzation of hemicellulose to xylose. In addition, the liquid also contained a small amount of glucose, produced mainly by the cleavage of cellulose in the amorphous zone. Furfural and HMF were derived by further conversion of C5 and C6 monosaccharides, respectively, while acetic acid was mainly derived from the hydrolysis of acetyl groups in the O-acetyl-4-O-methylglucuronoxylan in hemicellulose.41,42 The composition of the liquid phase products under different reaction conditions is shown in Table 1. Temperature and concentration played an important role in the formation of furfural and HMF; in addition, the temperature had a greater influence on the formation of glucose than the concentration. The total yield of each component detected under each condition was always less than the degree of hydrolysis, owing mainly to moderate degradation of soluble lignin and extracts.
Table 1 Composition of liquors from OA-assisted hydrolysis of poplar and yields of each product under various conditions
| Reaction conditions |
Composition of the pretreatment liquid/yieldsb (g) |
| Temperature (°C) |
OA (%) |
Timea (min) |
Xylose (g) |
Arabinose (g) |
Glucose (g) |
Furfural (g) |
Acetic acid (g) |
HMF (g) |
| The reaction time was the hold time after reaching the set temperature at a heating rate of 5 °C min−1. The yield was the mass of the component in the hydrolysate, and the mass of the feedstock was 50 g. |
| 140 |
3% |
10 |
6.05 |
0.31 |
0.60 |
|
1.65 |
|
| 150 |
3% |
10 |
7.31 |
0.36 |
1.12 |
|
1.89 |
|
| 160 |
3% |
10 |
8.06 |
0.68 |
1.82 |
1.09 |
2.14 |
|
| 170 |
3% |
10 |
7.30 |
0.33 |
2.53 |
1.77 |
3.68 |
0.61 |
| 180 |
3% |
10 |
6.14 |
0.42 |
3.23 |
1.83 |
1.16 |
0.78 |
| 160 |
2.5% |
10 |
8.02 |
0.41 |
1.61 |
0.67 |
1.65 |
0.22 |
| 160 |
2% |
10 |
7.86 |
0.52 |
1.44 |
0.45 |
1.44 |
0.13 |
| 160 |
1.5% |
10 |
8.44 |
1.48 |
1.54 |
0.31 |
1.84 |
0.02 |
| 160 |
1% |
10 |
9.07 |
1.65 |
1.49 |
0.24 |
1.68 |
|
| 160 |
0.5% |
10 |
5.86 |
0.26 |
0.80 |
|
1.17 |
|
| 160 |
1% |
0 |
5.88 |
0.31 |
0.66 |
|
1.49 |
|
| 160 |
1% |
5 |
6.47 |
0.49 |
0.80 |
|
1.60 |
|
| 160 |
1% |
10 |
9.07 |
1.65 |
1.69 |
0.24 |
1.68 |
|
| 160 |
1% |
15 |
7.77 |
0.23 |
1.26 |
0.31 |
1.88 |
|
| 160 |
1% |
20 |
7.44 |
0.38 |
1.24 |
0.33 |
1.98 |
0.19 |
Separation of lignin and cellulose from the GVL/H2O system
The 9th sample in Table 1 was used for lignin extraction in the GVL/H2O system. The effects of lignin removal and cellulose retention under different temperature conditions were assessed (see Fig. 5). Furthermore, the purity and structural characteristics of the extracted lignin and cellulose-rich substrate were evaluated to determine the treatment effect of the system. These results showed that lignin was well-dissolved in the system, and the cellulose underwent only slight degradation, with the majority remaining in the system. Overall, cellulose and lignin were almost completely separated in the GVL/H2O system.
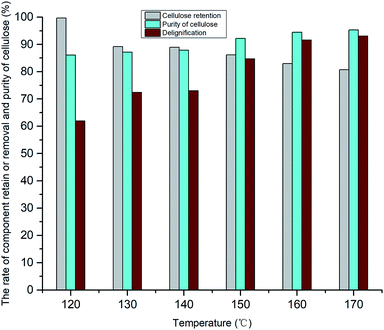 |
| | Fig. 5 Delignification and cellulose retention yield as well as cellulose purity of sample pretreated at different temperatures. | |
Compositional analysis of cellulose-rich substrates
The separation effect of the GVL/H2O system was further demonstrated through characterization of the solid cellulose-rich substrates. Changes in CrI and the crystal structure after treatment with the OA/H2O system and the GVL/H2O system were evaluated by means of XRD measurements (see Fig. 6(a)). The CrI values of the sample after the OA/H2O (1% OA for 10 min at 160 °C) system pretreatment and the GVL/H2O system treatment (130 °C) were 61.43% and 69.3%, respectively. Consistent with the trends observed for the microcrystalline cellulose, the CrI of cellulose-rich substrates increased with increasing temperature (i.e., from 69.3% at 130 °C to 77.56% at 160 °C). This increase was attributed to the removal of amorphous lignin components mainly from the GVL/H2O systems, as indicated by the compositional analysis results obtained for the substrates. The DTG curves reveal the weight loss rate of the samples (see Fig. 6(b)). The temperature yielding the maximum weight loss rate of the sample pretreated by the OA/H2O system (∼375 °C) is higher than those of the samples treated with microcrystalline cellulose and the GVL/H2O system. This resulted mainly from the presence of lignin. The maximum weight loss rate of the sample after treatment of the GVL/H2O system began to shift to the low temperature region, indicating that the lignin in the sample was gradually removed. Moreover, the curves became similar to the curve corresponding to the microcrystalline cellulose. These results indicated that the remaining solid matrix was composed almost entirely of a cellulose component.
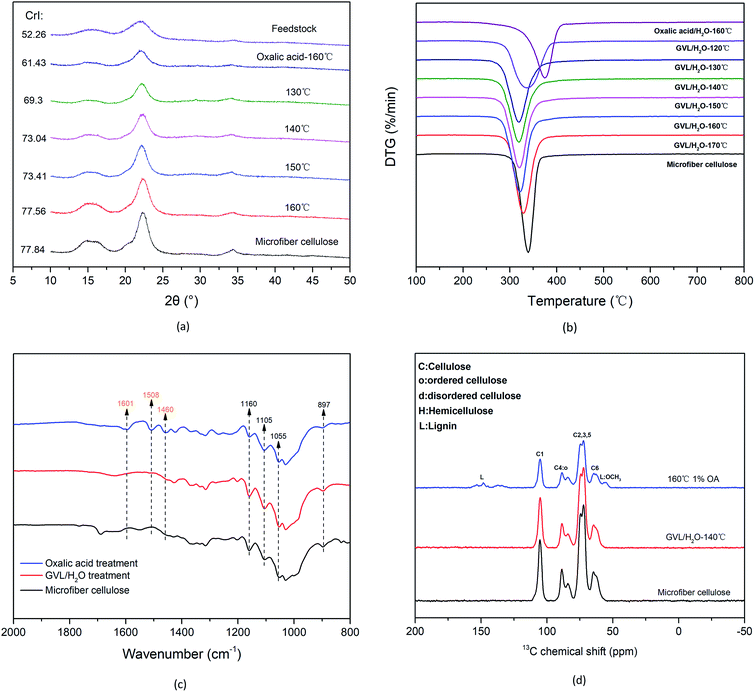 |
| | Fig. 6 Analyses of the samples treated in the OA/H2O and GVL/H2O systems. (a) XRD results (results of poplar wood also included), (b) DTG results, (c) FT-IR spectra collected for wavenumbers ranging from 2000 to 800 cm−1, and (d) 13C CPMAS solid-state NMR spectra. | |
Fig. 6(c) shows the FT-IR spectrum of the cellulose-rich substrate after the GVL/H2O treatment. The disappearance of the absorbance peaks at 1601, 1508, and 1460 cm−1 in the GVL/H2O system-treated sample, compared with the spectrum of the OA pretreated sample, was attributed to the removal of lignin. The absorption peaks of the cellulose-rich samples were consistent with those of the microcrystalline cellulose. Furthermore, the typical absorption peaks of hemicellulose and lignin were absent, confirming that the non-cellulose components were almost completely removed from the cellulose-rich samples. The 13C CPMAS solid-phase NMR results of the OA pretreatment samples and the GVL/H2O system treatment samples are shown in Fig. 6(d). Chemical shift signals of lignin methyl ether at 153 ppm and 55 ppm observed prior to the treatment were absent after the treatment, further confirming the removal of lignin. The spectrum of the cellulose-rich matrix after the GVL treatment was almost identical to that of microcrystalline cellulose, consistent with the results of the previous analysis.
Compositional analysis of extracted lignin
We also investigated the structural changes of lignin, such as relative depolymerization and repolymerization, after the GVL/H2O treatment. The molecular weight distribution of precipitated lignin was determined by means of the GPC method. The weight average (Mw), number average (Mn) molecular weight, and polydispersity index (PDI) of lignin at different temperatures are shown in Table 2. The molecular weight and PDI of lignin decreased with increasing temperature, indicating that the depolymerization degree of lignin increases with increasing temperature. In particular, the lignin prepared by this method can be compared with NMR and GPC of milled wood lignin (MWL) and mild acidolysis lignin (MAL) prepared by Yuan et al.43 who used traditional methods, so as to better understand the similarities and differences of lignin structures prepared by different methods.
Table 2 Molecular weight and recovery rate of the extracted lignin after the GVL/H2O treatmenta
| Samples |
Weight distribution |
Recovery rate (%) |
| Mw |
Mn |
PDI |
| Note: a total of 5 g of the pretreated sample contained 1.5 g of lignin. The lignin content was determined based on the NREL/TP-510-42618 standard. |
| 120 °C |
24![[thin space (1/6-em)]](https://www.rsc.org/images/entities/char_2009.gif) 414 414 |
3800 |
6.42 |
54.46 |
| 130 °C |
19![[thin space (1/6-em)]](https://www.rsc.org/images/entities/char_2009.gif) 981 981 |
3971 |
5.03 |
64.61 |
| 140 °C |
16![[thin space (1/6-em)]](https://www.rsc.org/images/entities/char_2009.gif) 604 604 |
3708 |
4.47 |
65.22 |
| 150 °C |
13![[thin space (1/6-em)]](https://www.rsc.org/images/entities/char_2009.gif) 298 298 |
3419 |
3.89 |
77.19 |
| 160 °C |
11![[thin space (1/6-em)]](https://www.rsc.org/images/entities/char_2009.gif) 739 739 |
3316 |
3.54 |
84.74 |
| 170 °C |
8438 |
3100 |
2.72 |
84.21 |
Furthermore, 2D NMR analysis was performed on the lignin components extracted from samples treated at 140 °C and 170 °C (denoted as L-140 and L-170, respectively). Representative 2D HSQC NMR spectra and the corresponding fractions of the main lignin substructures are shown in Fig. 7. The spectra of lignin can be divided into two main regions, namely the aliphatic C–O side chain region (δC/δH 50–90/2.5–5.0) and the aromatic 13C–1H correlation (δC/δH 100–140/6.0–8.0) region. The cross-signals at δC/δH 90–105/3.9–5.4 resulted mainly from the lignin-carbohydrate complex (LCC) structure, and the lack of signal in this region indicates that the LCC bonds were cleaved during the GVL/H2O treatment process.44
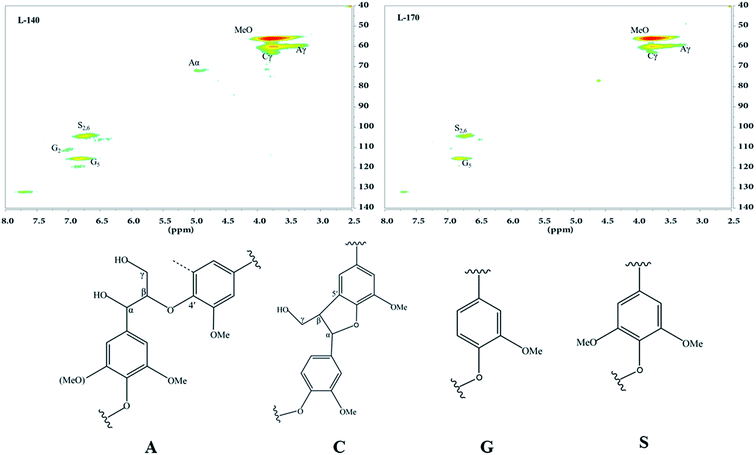 |
| | Fig. 7 The 2D HSQC NMR spectra and main structures of precipitated lignin at 140 °C and 170 °C. | |
In the aliphatic C–O side-chain region of the lignin (δC/δH 50–90/2.5–5.0), cross-peaks of different inter-unit linkages were identified. For example, the α- and γ-positions of β-aryl-ether (β-O-4′) linkages occurred at δC/δH 72.3/4.9 and δC/δH 60.2/3.7, respectively. The most prominent cross-signals occurred for the methoxy groups (–OCH3, δC/δH 56.3/3.79) and β-O-4′ substructures (A).45–47 In addition, the signal at δC/δH 63.4/3.7 was attributed to Cγ–Hγ correlations of phenylcoumaran substructures (β-5′ linkages, C). The aromatic rings of syringyl (S) and guaiacyl (G) units of the typical lignin cross-signals occurring in the aromatic region were also observed in the spectra. The typical G units generated a prominent signal for C2–H2 correlation at δC/δH 110.6/7.0 and C5–H5 correlation at δC/δH 115.1/6.8. Similarly, the S units exhibited different correlations for C2,6–H2,6 at δC/δH 104.1/6.7. Compared with the spectrum of L-170 lignin, the spectrum of L-140 lignin exhibited higher ratios and border signals in the basic structural units. This resulted from the increase in temperature during delignification and consequent increase in chemical bond depolymerization.
Mass balance of entire process
The mass balance of poplar during the OA/H2O treatment and the GVL/H2O treatment is shown in Fig. 8. The optimal OA-assisted hydrolysis of the poplar feedstock was achieved under a relatively short reaction time of 10 min, a moderate temperature of 160 °C, and an OA concentration of 1% with a hydrolysis yield of 28.2%. The removal rate of hemicellulose was 98.32%, and the retention rates of cellulose and lignin were 94.46% and 91.27%, respectively. Hemicellulose was liquefied into small molecules of monosaccharides (xylose 17.84%, arabinose 3.58%, glucose sugar 3.36%) and small amounts of derivatives (acetic acid 2.06%, furfural 0.32%). The pretreatment samples were then reprocessed in the GVL/H2O system to achieve the separation of lignin and cellulose. Under mild conditions (160 °C, 10 mM H2SO4 for 2 h), 91.57% lignin was removed, 82.99% cellulose was retained in the solid cellulose-rich substrates, and 94.45% purity of cellulose was realized. In addition, regarding raw materials, the yield of cellulose was 43.36%, corresponding to a 17.26% recovery of high-purity lignin.
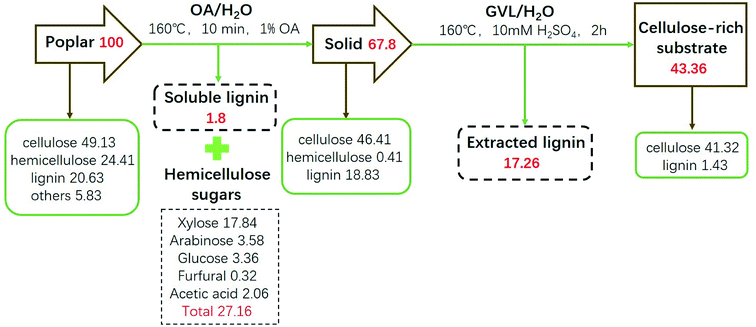 |
| | Fig. 8 Mass balance during the OA/H2O treatment and the GVL/H2O treatment process. Note: all percentages in the figure are based on raw materials. | |
Conclusions
We have proposed an effective method for converting hemicellulose, cellulose, and lignin from poplar to high value-added products, which include C5 sugars (mainly xylose) as well as high-purity cellulose and lignin. These sugars were obtained by using the high selectivity of OA to hemicellulose to extract hemicellulose in an aqueous solvent system. More than 98.32% of the hemicellulose was removed in a relatively short reaction time of 10 min, at a moderate temperature of 160 °C, and an OA concentration of 1%. The C5 sugars obtained and their intermediates exhibit significant promise for use in biomaterials or biochemicals. Moreover, the pretreated solid sample was dissolved in the GVL/H2O system using dilute sulfuric acid as a catalyst for separation of lignin and cellulose-rich substrates. This fractionation strategy recovered 82.38% of the components from the raw materials during the entire process, thereby yielding hemicellulose sugar, lignin, and high-purity cellulose products. In addition, the reagents, solvents, and catalysts employed in the fractionation process are environmentally friendly chemicals that can be recycled during the process.
Conflicts of interest
There are no conflicts to declare.
Acknowledgements
This work was financially supported by the National Natural Science Foundation of China (31530010) and Fundamental Research Funds for Central Universities (2017ZY32).
References
- R. Li, Y. Xie, T. Yang, B. Li, W. Wang and X. Kai, Energy Convers. Manage., 2015, 93, 23–30 CrossRef CAS.
- D. Liu, Q. Li, A. Zhao, L. Song, P. Wu and Z. Yan, Chem. Eng. J., 2015, 279, 921–928 CrossRef CAS.
- D. Xu, G. Lin, S. Guo, S. Wang, Y. Guo and Z. Jing, Renewable Sustainable Energy Rev., 2018, 97, 103–118 CrossRef CAS.
- J. Feng, J. Jiang, J. Xu, Z. Yang, K. Wang, Q. Guan and S. Chen, Appl. Energy, 2015, 154, 520–527 CrossRef CAS.
- Z. Sun, G. Bottari, A. Afanasenko, M. C. A. Stuart, P. J. Deuss, B. Fridrich and K. Barta, Nat. Catal., 2018, 1, 82–92 CrossRef CAS.
- U. Bornscheuer, K. Buchholz and J. Seibel, Angew. Chem., Int. Ed., 2014, 53, 10876–10893 CrossRef CAS PubMed.
- H. Chen, J. Liu, X. Chang, D. Chen, Y. Xue, P. Liu, H. Lin and S. Han, Fuel Process. Technol., 2017, 160, 196–206 CrossRef CAS.
- P. Halder, S. Kundu, S. Patel, A. Setiawan, R. Atkin, R. Parthasarthy, J. Paz-Ferreiro, A. Surapaneni and K. Shah, Renewable Sustainable Energy Rev., 2019, 105, 268–292 CrossRef CAS.
- N. Grishkewich, N. Mohammed, J. Tang and K. C. Tam, Curr. Opin. Colloid Interface Sci., 2017, 29, 32–45 CrossRef CAS.
- V. Dhyani and T. Bhaskar, Renewable Energy, 2018, 129, 695–716 CrossRef CAS.
- J. Dou, H. Kim, Y. Li, D. Padmakshan, F. Yue, J. Ralph and T. Vuorinen, J. Agric. Food Chem., 2018, 66, 7294–7300 CrossRef CAS PubMed.
- J. L. Wen, S. L. Sun, B. L. Xue and R. C. Sun, J. Agric. Food Chem., 2013, 61, 635–645 CrossRef CAS PubMed.
- G. Kabir and B. H. Hameed, Renewable Sustainable Energy Rev., 2017, 70, 945–967 CrossRef CAS.
- Y. Qin, D. Yang and X. Qiu, ACS Sustainable Chem. Eng., 2015, 3, 3239–3244 CrossRef CAS.
- W.-J. Liu, H. Jiang and H.-Q. Yu, Green Chem., 2015, 17, 4888–4907 RSC.
- Q. Zhai, C. Y. Hse, F. Long, T. F. Shupe, F. Wang, J. Jiang and J. Xu, J. Agric. Food Chem., 2019, 67, 9840–9850 CrossRef CAS PubMed.
- Y. Luo, Z. Li, X. Li, X. Liu, J. Fan, J. H. Clark and C. Hu, Catal. Today, 2019, 319, 14–24 CrossRef CAS.
- K. Shikinaka, Y. Otsuka, R. R. Navarro, M. Nakamura, T. Shimokawa, M. Nojiri, R. Tanigawa and K. Shigehara, Green Chem., 2016, 18, 5962–5966 RSC.
- J. Yu, N. Paterson, J. Blamey and M. Millan, Fuel, 2017, 191, 140–149 CrossRef CAS.
- K. Chen, S. Hao, H. Lyu, G. Luo, S. Zhang and J. Chen, Sep. Purif. Technol., 2017, 172, 100–106 CrossRef CAS.
- D. Chiaramonti, M. Prussi, S. Ferrero, L. Oriani, P. Ottonello, P. Torre and F. Cherchi, Biomass Bioenergy, 2012, 46, 25–35 CrossRef CAS.
- S. Haghighi Mood, A. Hossein Golfeshan, M. Tabatabaei, G. Salehi Jouzani, G. H. Najafi, M. Gholami and M. Ardjmand, Renewable Sustainable Energy Rev., 2013, 27, 77–93 CrossRef CAS.
- B. Cheng, X. Zhang, Q. Lin, F. Xin, R. Sun, X. Wang and J. Ren, Biotechnol. Biofuels, 2018, 11, 324 CrossRef CAS PubMed.
- T. M. Lacerda, M. D. Zambon and E. Frollini, Ind. Crops Prod., 2015, 71, 163–172 CrossRef CAS.
- Q. Yu, X. Zhuang, W. Wang, W. Qi, Q. Wang, X. Tan, X. Kong and Z. Yuan, Biomass Bioenergy, 2016, 94, 105–109 CrossRef CAS.
- S. Yao, S. Nie, H. Zhu, S. Wang, X. Song and C. Qin, Ind. Crops Prod., 2017, 96, 178–185 CrossRef CAS.
- S. Chatterjee and T. Saito, ChemSusChem, 2015, 8, 3941–3958 CrossRef CAS PubMed.
- L.-P. Xiao, S. Wang, H. Li, Z. Li, Z.-J. Shi, L. Xiao, R.-C. Sun, Y. Fang and G. Song, ACS Catal., 2017, 7, 7535–7542 CrossRef CAS.
- J. C. Carvajal, A. Gomez and C. A. Cardona, Bioresour. Technol., 2016, 214, 468–476 CrossRef CAS PubMed.
- L. Zhang, H. Lu, J. Yu, Z. Wang, Y. Fan and X. Zhou, J. Agric. Food Chem., 2017, 65, 9587–9594 CrossRef CAS PubMed.
- H. Q. Lê, Y. Ma, M. Borrega and H. Sixta, Green Chem., 2016, 18, 5466–5476 RSC.
- J. S. Luterbacher, J. M. Rand, D. M. Alonso, J. Han, J. T. Youngquist, C. T. Maravelias, B. F. Pfleger and J. A. Dumesic, Science, 2014, 343, 277–280 CrossRef CAS PubMed.
- X. Zhou, D. Ding, T. You, X. Zhang, K. Takabe and F. Xu, J. Agric. Food Chem., 2018, 66, 3449–3456 CrossRef CAS PubMed.
- W. Schutyser, T. Renders, S. Van den Bosch, S. F. Koelewijn, G. T. Beckham and B. F. Sels, Chem. Soc. Rev., 2018, 47, 852–908 RSC.
- H. Li, X. Chen, J. Ren, H. Deng, F. Peng and R. Sun, Biotechnol. Biofuels, 2015, 8, 127 CrossRef PubMed.
- H.-S. Kim, S. Kim, H.-J. Kim and H.-S. Yang, Thermochim. Acta, 2006, 451, 181–188 CrossRef CAS.
- M. Poletto, A. J. Zattera, M. M. Forte and R. M. Santana, Bioresour. Technol., 2012, 109, 148–153 CrossRef CAS PubMed.
- S. Chen, M. Pudukudy, Z. Yue, H. Zhang, Y. Zhi, Y. Ni, S. Shan and Q. Jia, Ind. Eng. Chem. Res., 2019, 58, 17255–17265 CrossRef CAS.
- I. Santoni, E. Callone, A. Sandak, J. Sandak and S. Dire, Carbohydr. Polym., 2015, 117, 710–721 CrossRef CAS PubMed.
- X. Kang, A. Kirui, M. C. Dickwella Widanage, F. Mentink-Vigier, D. J. Cosgrove and T. Wang, Nat. Commun., 2019, 10, 347 CrossRef CAS PubMed.
- Y. Luo, J. Fan, V. L. Budarin, C. Hu and J. H. Clark, Green Chem., 2017, 19, 4889–4899 RSC.
- Q. Zhai, F. Li, F. Long, F. Wang, J. Jiang, C.-y. Hse and J. Xu, ACS Sustainable Chem. Eng., 2018, 7, 526–536 CrossRef.
- T. Q. Yuan, S. N. Sun, F. Xu and R. C. Sun, J. Agric. Food Chem., 2011, 59, 10604–10614 CrossRef CAS PubMed.
- X. Si, F. Lu, J. Chen, R. Lu, Q. Huang, H. Jiang, E. Taarning and J. Xu, Green Chem., 2017, 19, 4849–4857 RSC.
- J.-L. Wen, T.-Q. Yuan, S.-L. Sun, F. Xu and R.-C. Sun, Green Chem., 2014, 16, 181–190 RSC.
- M. Wu, Z. Y. Yan, X. M. Zhang, F. Xu and R. C. Sun, Bioresour. Technol., 2016, 200, 23–28 CrossRef CAS PubMed.
- M. Wu, D. Zhao, J. Pang, X. Zhang, M. Li, F. Xu and R. Sun, Ind. Crops Prod., 2015, 66, 123–130 CrossRef CAS.
|
| This journal is © The Royal Society of Chemistry 2020 |
Click here to see how this site uses Cookies. View our privacy policy here.  Open Access Article
 a,
Ruizhen Wangb,
Jianchun Jiangb,
Junming Xu*b and
Jinsheng Gou*a

![[thin space (1/6-em)]](https://www.rsc.org/images/entities/char_2009.gif) :
:![[thin space (1/6-em)]](https://www.rsc.org/images/entities/char_2009.gif) 10. The reactor was heated (stirring rate: 350 rpm) to the set temperature and maintained at this temperature for the time determined by the experimental design. After the reaction, the reactor was rapidly cooled to room temperature with condensed water and then opened. The reaction mixture (solid residue and water-soluble component) was separated via filtration through a filter paper, and the solid was washed three times with distilled water. After this separation, the liquid components were evaluated by means of high-performance liquid chromatography (HPLC). The solid was dried for 12 h in an oven at 105 °C.
10. The reactor was heated (stirring rate: 350 rpm) to the set temperature and maintained at this temperature for the time determined by the experimental design. After the reaction, the reactor was rapidly cooled to room temperature with condensed water and then opened. The reaction mixture (solid residue and water-soluble component) was separated via filtration through a filter paper, and the solid was washed three times with distilled water. After this separation, the liquid components were evaluated by means of high-performance liquid chromatography (HPLC). The solid was dried for 12 h in an oven at 105 °C.


![[double bond, length as m-dash]](https://www.rsc.org/images/entities/char_e001.gif) O and C–O bonds of the acetyl groups in hemicellulose.35 Moreover, the gradual disappearance of the absorbance peaks was attributed to the removal of hemicellulose with increasing temperature. The characteristic absorbance peaks of cellulose occurred at 2900, 1422, 1161, 1104, 1060, and 897 cm−1. In addition, the spectrum remained almost unchanged with varying temperature, indicating that the pretreatment had little effect on the crystalline cellulose. The absorbance peaks at 1593, 1509, 1454, and 1422 cm−1 are associated with the typical features of lignin. Furthermore, the characteristic peaks of lignin in the solid samples treated at different temperatures after hydrolysis were more pronounced than those of the feedstock, indicating that lignin remained in the solid residues. Fig. 3(b) shows the changes in the crystal structure and crystallinity of cellulose at different temperatures. A CrI of 52.26% was determined for the poplar feedstock, and the CrI of the pretreatment sample increased by 5.03% when the temperature was increased from 140 °C to 180 °C. These results showed that the removal of hemicellulose and amorphous cellulose resulted in increased crystallinity, as confirmed by the compositional analysis of the sample.
O and C–O bonds of the acetyl groups in hemicellulose.35 Moreover, the gradual disappearance of the absorbance peaks was attributed to the removal of hemicellulose with increasing temperature. The characteristic absorbance peaks of cellulose occurred at 2900, 1422, 1161, 1104, 1060, and 897 cm−1. In addition, the spectrum remained almost unchanged with varying temperature, indicating that the pretreatment had little effect on the crystalline cellulose. The absorbance peaks at 1593, 1509, 1454, and 1422 cm−1 are associated with the typical features of lignin. Furthermore, the characteristic peaks of lignin in the solid samples treated at different temperatures after hydrolysis were more pronounced than those of the feedstock, indicating that lignin remained in the solid residues. Fig. 3(b) shows the changes in the crystal structure and crystallinity of cellulose at different temperatures. A CrI of 52.26% was determined for the poplar feedstock, and the CrI of the pretreatment sample increased by 5.03% when the temperature was increased from 140 °C to 180 °C. These results showed that the removal of hemicellulose and amorphous cellulose resulted in increased crystallinity, as confirmed by the compositional analysis of the sample.
![[thin space (1/6-em)]](https://www.rsc.org/images/entities/char_2009.gif) 414
414![[thin space (1/6-em)]](https://www.rsc.org/images/entities/char_2009.gif) 981
981![[thin space (1/6-em)]](https://www.rsc.org/images/entities/char_2009.gif) 604
604![[thin space (1/6-em)]](https://www.rsc.org/images/entities/char_2009.gif) 298
298![[thin space (1/6-em)]](https://www.rsc.org/images/entities/char_2009.gif) 739
739


