
 Open Access Article
 This Open Access Article is licensed under a Creative Commons Attribution-Non Commercial 3.0 Unported Licence
The effect of graphitized carbon on the adsorption and photocatalytic degradation of methylene blue over TiO2/C composites
Jinlu Cai,
Shenghua Hu*,
Junhuai Xiang *,
Honghua Zhang and
Dandan Men
*,
Honghua Zhang and
Dandan Men
Jiangxi Key Laboratory of Surface Engineering, School of Materials and Mechanical & Electrical Engineering, Jiangxi Science and Technology Normal University, Xuefu Road 589, Nanchang 330038, China. E-mail: shenghuahu@jxstnu.edu.cn; xiangjunhuai@163.com
First published on 9th November 2020
Abstract
The TiO2/C composites with approximately 40 wt% of carbon were prepared by calcination of precursors, formed from a one-pot liquid phase reaction between Ti(SO4)2 and flour. All TiO2/C composites displayed mesoporous structures with high BET surface areas (117–138 m2 g−1) and small crystal sizes of TiO2 (8–27 nm). The contents of graphitic carbon and rutile TiO2 increased, while the surface area and TiO2 crystal size decreased for the TiO2/C composite on increasing the calcination temperature from 650 to 800 °C; when calcinated at 800 °C, the anatase TiO2 completely changed into rutile TiO2 in the TiO2/C composite. The TiO2/C composite calcinated at higher temperatures exhibited better adsorptive and photocatalytic degradation performance in the removal of methylene blue (MB). For the entire rutile TiO2/C-800 composite, the adsorption process of MB can be well described by the pseudo-second-order kinetic model and is governed by chemical adsorption with the maximum adsorption capacity value equal to about 15 mg g−1. Under continuous illumination with a 254 nm UV lamp (15 W) for 3 h, the percentage of MB (14 mg l−1) photocatalytic degradation on 50 mg of TiO2/C-800 was 25.1% higher than that of the maximum adsorption removal. These results suggest that the graphitized carbon has a significant effect on the adsorptivity and photocatalytic activity of the TiO2/C composite.
1. Introduction
Dyes are critical materials in many industries such as textile, leather, paper, foods, pharmaceuticals, ceramics, paint, and pigment.1–4 A lot of dyes become major water contaminants because they are discarded into watercourses as waste liquid in these industrial processes. Most dyes possess some elements or functional groups (such as metals or aromatics) that are highly toxic, mutagenic and even carcinogenic to aquatic life and human beings. Moreover, they are chemically inert and have little biodegradability under natural conditions. Therefore, it is essential to treat dye waste liquids to ensure their safe discharge into watercourses.Dye contaminants from aqueous solutions can be treated by many methods, which fall into three categories, namely, physical, chemical and biological. The advantages and shortcomings of these methods are compared and summarized by Yagub et al.1 Among them, adsorption is considered as a globally acclaimed method due to its simple process and low cost. However, the conventional adsorbents are limited by low adsorption capacity and kinetics, high regeneration cost, and column fouling. Photocatalytic oxidation is widely studied as the most promising method.3,4 Some photocatalysts also exhibit high adsorption capacity for the removal of dyes. Within 25 min, the percentage of MB removal from a 120 mg l−1 aqueous solution was 99.47% for the Fe3O4/activated montmorillonite (Fe3O4/Mt) nanocomposite (0.5 g) at 293 K.5 The maximum adsorption amounts of malachite green, acid fuchsin and Congo red are 2963, 3307 and 1554 mg g−1 for ZnO nanoparticles, respectively.6 Therefore, for organic pollutants, the integration of adsorption and photocatalytic degradation has attracted the interest of researchers and is considered a promising method.3,7
TiO2 is widely investigated as a photocatalyst in the degradation of organic pollutants due to its strong oxidation, non-toxicity and good chemical stability.8–14 However, pure TiO2 has some drawbacks for its efficient degradation. TiO2 has no affinity for hydrophobic organics due to its surface polarity.15 It is often a tedious process to separate powdered TiO2 with small particle size from liquids.16 TiO2 nanoparticles are prone to aggregation and have high photogenerated electron–hole pair recombination, leading to their lower efficiency and activity.17,18 Thus, the combination of some adsorbents and TiO2 nanoparticles has attracted much attention for enhancing photocatalytic activity in the degradation of organic contaminants.19–25
TiO2 composites obtained by adding a co-adsorbent, doping, or depositing on other material are helpful for solving these problems. Supporting the TiO2 nanoparticles on adsorbents such as activated carbon,19 clay minerals21,22 and calcium silicate23 is not only beneficial for improving the efficiency of photocatalysis, but also favors the separation and recovery of these catalysts from aqueous solution. These adsorbents usually have some excellent physicochemical properties such as high surface area, porous structure, large adsorption capacity, fast adsorption kinetics, good chemical and thermal stability, and low cost.21,25 TiO2 coupling with g-C3N4,24 hybridizing with graphene-like carbon26 or depositing on graphene25,27 can promote the separation of photogenerated charge carriers (electrons and holes).
As promoters or supports of catalysts, carbon-based materials exhibit excellent synergistic effects due to their structural characteristics. For example, compared with pure titania, TiO2 nanoparticles supported on active carbon,28 graphitized carbon,29 and carbon nanotubes30 have higher photocatalytic performance in the degradation of dyes. The TiO2–C composites can usually be prepared by different methods such as dip coating,31 impregnation,32 solvothermal/hydrothermal,33–36 sol–gel,28,37,38 chemical vapor deposition,39,40 templating agent41 and precipitation.42 Usually, it is difficult to obtain the TiO2–C composites containing highly dispersive TiO2 with high concentrations due to the direct carbon adsorbents as initial materials in most of these methods. This problem can be resolved when TiO2 and carbon are simultaneously formed by a one-step method.
In this work, TiO2/C composites with approximately 40 wt% carbon were prepared by the calcination of precursors, formed from a one-pot liquid phase reaction between Ti(SO4)2 and flour. The obtained TiO2/C composites displayed typical mesopores and had high surface areas. The anatase and rutile formed at high calcination temperatures are highly dispersed in the TiO2/C composites. To evaluate their adsorption capacities and photocatalytic performance, MB was used as a probe molecule. The synergistic effects of adsorption-enrichment and photocatalytic degradation were correlated with surface properties such as pore structure, crystal phase-type and size, and graphitized carbon.
2. Experimental
2.1 Preparation of TiO2/C composites
The TiO2/C composites with approximately 40 wt% of carbon were prepared by combining the method of calcination with a one-pot liquid phase reaction. Specifically, 20 g of flour was slowly added to 40 ml Ti(SO4)2 aqueous solution (50 wt%) in a 250 ml beaker, and mixed well under stirring. The mixture was heated to 85 °C in a water bath and allowed to react at this temperature for about 3 h at a 130 rpm stirring rate. The obtained pasty mass (precursor) was dried for 2 h in an electrically heated drying oven at 130 °C and then transferred into a tube furnace filled with several small corundum boats. The precursor was heated at the flow rate of 5 °C min−1 to the desired temperature, and treated at that temperature for 2 h, with a nitrogen flow rate of 60 ml min−1. The obtained solid product was filtered and washed thoroughly with boiling deionized water until no SO42− was detected in the filtrate. Finally, the product was dried in an oven at 120 °C for 12 h and denoted as TiO2/C-x, where x represents the numerical value of the calcination temperature. Pure TiO2 was obtained by heating the corresponding composite in air at the desired temperature and was similarly denoted as TiO2-y, where y represents the numerical value of the calcination temperature.2.2 Characterization of TiO2/C composites
The TiO2 and carbon contents in the TiO2/C composite were determined by combustion in air at 850 °C, since all carbon can be oxidized into carbon oxides.Powder X-ray diffraction (XRD) patterns were collected on an XRD-6000 Shimadzu X-ray diffractometer using Ni-filtered Cu Kα radiation (Cu Kα, λ = 0.15406 nm) equipped with a graphite monochromator. The employed voltage and current were 40 kV and 30 mA, respectively. The diffractograms were recorded in the 2θ range of 10–80° at a speed of 4° min−1.
Nitrogen adsorption/desorption isotherms were measured at −196 °C on a Quantachrome Autosorb-iQ2 auto-sorption analyzer. All TiO2/C composites were outgassed in a high vacuum at 180 °C for 6 h prior to the measurements. The specific surface areas were calculated using the Brunauer–Emmett–Teller (BET) method. The pore size distributions were obtained from the desorption branch of the nitrogen adsorption/desorption isotherms by the Barrett–Joyner–Halenda (BJH) method. The micropore/mesopore volume was obtained according to the DFT (density functional theory) method.
The morphology and microstructure of the TiO2/C composites were characterized by a field emission scanning electron microscope with an acceleration voltage of 20 kV (FE-SEM, Carl Zeiss Supra 55VP). TEM images of samples were observed on a high-resolution transmission electron microscope at an accelerating voltage of 200 kV (TEM, JEM-2100).
Photocurrent-time curves were measured on an Electrochemical Workstation (660E, Shanghai Chenhua Instruments Co. Ltd., China) using a conventional three-electrode quartz cell system with 0.5 mol l−1 Na2SO4 electrolyte solution. In this system, the platinum electrode, saturated calomel electrode and TiO2/C composite/ITO glass electrode were used as the counter electrode, reference electrode and working electrode, respectively. The same 15 W UV lamp as in the photocatalytic degradation of MB was used as the light source in the photoelectrochemical experiment and was about 6 cm away from the working electrode. The procedure for fabricating the TiO2/C composite/ITO glass electrode was as follows: first, the suspension of the appropriate TiO2/C composite powder was dispersed in 10 ml of anhydrous ethanol and ultrasonicated for 1 h. The suspension was slowly dropped onto an ITO glass support using a dropper, then the TiO2/C composite/ITO glass electrode was dried in air at room temperature for 3 days.
Raman spectra were obtained with a Raman spectrometer (Accuman (SR-510 Pro), Ocean Optics, American) using a 785 nm laser. The laser was focused on a spot with diameter of 0.2–2 mm at a power of less than 8 mW. Spectra were collected in the range of 200–2400 cm−1 at an interval of about 4 cm−1.
2.3 Adsorption experiments
The adsorption amount at equilibrium (qe), adsorption amount (qt) and percentage of adsorption removal (photocatalytic degradation) at any time t were calculated as follows:
 | (1) |
 | (2) |
 | (3) |
2.4 Photocatalytic degradation of methylene blue
The photocatalytic performance of the TiO2/C composite was evaluated in a self-made photocatalytic device by the photodegradation of MB in aqueous solution under the irradiation of ultraviolet (UV) light with a wavelength of 254 nm. A 15 W UV lamp (light intensity of 0.4 W m−2) served as the light source. Typically, 50 mg of TiO2/C composite was evenly dispersed in a 100 ml MB aqueous solution with an initial concentration of 14 mg l−1 in a self-designed quartz reactor. The mixture was magnetically stirred at a speed of 250 rpm in the dark for a certain time to achieve the equilibrium of adsorption/desorption between the TiO2/C composite and the substrate. Subsequently, the light source was switched on, and the reactor was cooled by circulating water throughout the experiment. Then, aliquots were sampled at the given irradiation time intervals as in the adsorption experiments. Similarly, the photocatalytic activity was also measured by the photodegradation of MB in aqueous solution on the TiO2/C composite under the irradiation of visible light with a wavelength of more than 420 nm and power of 140 W. The light intensity of the simulated solar spectrum was ca. 925 W m−2 (as measured with a digital power meter). The concentration of MB was determined by measuring the absorbance at 664 nm (λmax for MB), using a UV-vis spectrophotometer (Lambda 35, PerkinElmer, American). The percentage of photocatalytic degradation is described by eqn (3): (1 − Ct/C0) × 100%, where C0 and Ct are respectively the MB concentrations initially and at time t.3. Results and discussion
3.1 Textural and structural properties of TiO2/C composites
The chemical compositions, specific surface areas and pore structural parameters of the TiO2/C composites are summarized in Table 1. The content of TiO2 was 61.1%, 65.0%, 65.3% and 67.0% for the TiO2/C-650, TiO2/C-700, TiO2/C-750 and TiO2/C-800, respectively. Thus, the content of TiO2 in the TiO2/C composite was higher than the desired value and increased with the increase in the calcination temperature, indicating that the higher the calcination temperature, the more the carbon oxides formed. Although all TiO2/C composites showed typical mesopores for the pore size distributions by the BJH method (see Fig. 1(b) below), as seen in Table 1, there were varying degrees of micropores and macropores, and the proportion of mesopores varied from 62% to 73% for these samples.| Sample | Chemical composition (wt%) | BET area (m2 g−1) | Most probable pore size (nm) | Vtotal (cm3 g−1) | Vmicro (cm3 g−1) | Rmicro (%) | Vmeso (cm3 g−1) | Rmeso (%) | |
|---|---|---|---|---|---|---|---|---|---|
| TiO2 | C | ||||||||
| a Vtotal: total pore volume; Vmicro: micropore volume; Vmeso: mesopore volume; Rmicro: Vmicro/Vtotal × 100%; Rmeso: Vmeso/Vtotal × 100%. | |||||||||
| TiO2/C-650 | 61.1 | 38.9 | 138 | 3.9 | 0.12 | 0.021 | 17.5 | 0.087 | 72.5 |
| TiO2/C-700 | 65.0 | 35.0 | 134 | 3.9 | 0.12 | 0.036 | 30.0 | 0.074 | 61.7 |
| TiO2/C-750 | 65.3 | 34.7 | 124 | 3.9 | 0.12 | 0.029 | 24.2 | 0.089 | 74.2 |
| TiO2/C-800 | 67.0 | 33.0 | 117 | 6.8 | 0.078 | 0.027 | 34.6 | 0.049 | 62.8 |
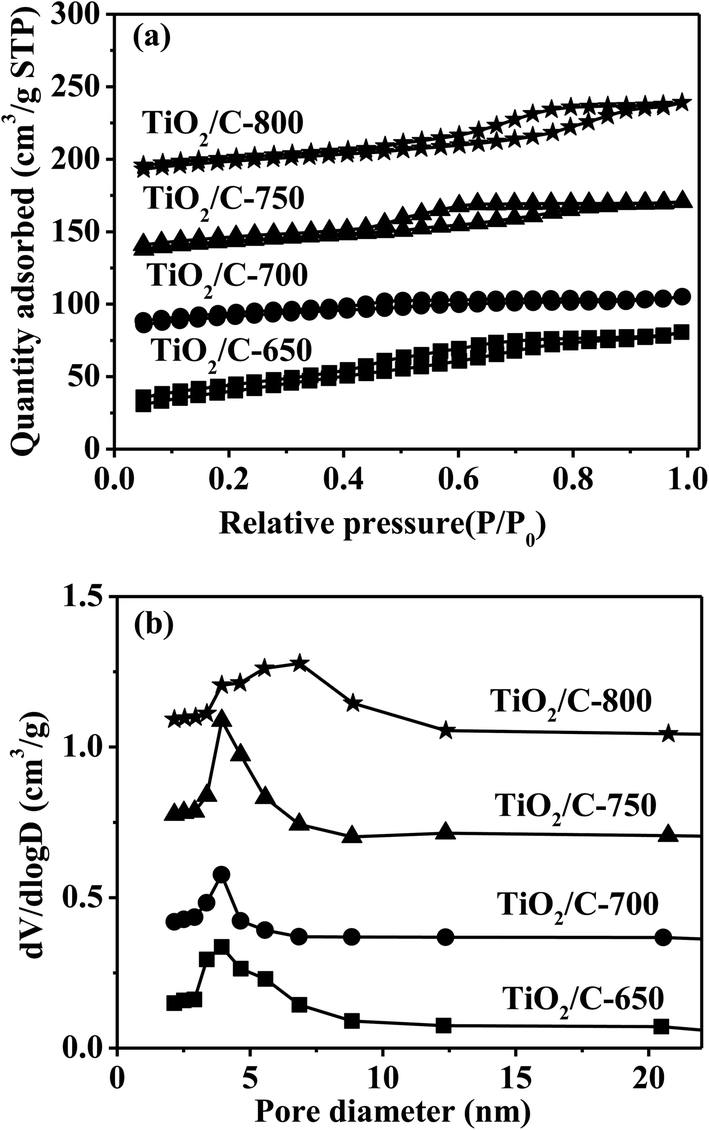 | ||
| Fig. 1 N2 adsorption/desorption isotherms (a) and pore size distributions (b) of the TiO2/C composites. | ||
The above-mentioned carbon oxides could be produced by the reaction between carbon and SO3 from flour and Ti(SO4)2 as follows: xSO3 + C → xSO2 + COx. Due to the acidity of the Ti(SO4)2 aqueous solution, by way of dehydration, condensation polymerization, or hydrolysis, flour as a disaccharide can be converted into a polysaccharide, humic acid, or monosaccharide, etc. These carbohydrates were carbonized to form carbon at high temperatures. Ti(SO4)2 can be changed into TiOSO4 and Ti(OH)4, which can be dispersed in the polymers formed from flour. These hydrolyzates and unreacted Ti(SO4)2 can be decomposed according to the following reactions at high calcination temperature:
| (1) TiOSO4 → TiO2 + SO3; |
| (2) Ti(OH)4 → TiO2 + 2H2O; |
| (3) Ti(SO4)2 → TiO2 + 2SO3. |
The TiO2/C composite is produced by all these reactions.
N2 adsorption/desorption isotherms and pore size distributions for the TiO2/C composites calcinated at different temperatures are shown in Fig. 1. The nitrogen adsorption/desorption isotherms for all TiO2/C composites displayed similar hysteresis loops at relative pressures ranging from 0.4 to 0.9, which belong to the type IV isotherms with H2 (b) hysteresis loops, typical of mesopores according to the IUPAC classification.43 A single peak was observed for the pore size distribution of every sample. The peaks were weak and narrow for the TiO2/C-650 and TiO2/C-700, while strong and broad for the TiO2/C-750 and TiO2/C-800. Table 1 shows that all TiO2/C composites possessed high surface areas (138–117 m2 g−1), which decreased slowly with the increase of the calcination temperature due to the sintering. The pore diameters and pore volumes derived from the nitrogen adsorption/desorption isotherms of the TiO2/C composites are also listed in Table 1. The most probable pore sizes and pore volumes (about 3.9 nm and 0.12 cm3 g−1, respectively) were almost the same for the TiO2/C-650, TiO2/C-700 and TiO2/C-750, while the most probable pore size increased to ca. 6.8 nm, and the pore volume decreased to around 0.078 cm3 g−1 for the TiO2/C-800. This means that more carbon oxides were formed for the TiO2/C-800 obtained at the highest calcination temperature.
XRD patterns of four TiO2/C composites obtained at different calcination temperatures are shown in Fig. 2. No diffraction peaks of graphite crystals were observed in all TiO2/C composites, indicating the presence of highly dispersed or amorphous carbon in the TiO2/C composites. The diffraction peaks at 25.1, 37.9, 48.1, 55.1, 62.7 and 75.7° correspond to (101), (004), (200), (211), (204) and (215) planes of anatase TiO2 (JCPDS 21-1272), respectively. The diffraction peaks at 27.5, 36.1, 39.2, 41.3, 44.1, 56.7, 62.8, 64.1, 69.1 and 69.7° are ascribed to the reflections of the (110), (101), (200), (111), (210), (211), (220), (002), (310), (301) and (112) planes of rutile TiO2 (JCPDS 21-1276), respectively. Only the broad and weak peaks of anatase TiO2 appeared for the TiO2/C-650 composite. The peaks of anatase TiO2 became stronger and the very weak peaks of a little rutile TiO2 appeared at the same time for the TiO2/C-700 composite. Only the peaks of a little anatase TiO2 were present and the narrow and strong peaks of more rutile TiO2 appeared due to the transformation of most of the anatase to rutile for the TiO2/C-750 composite obtained at higher calcination temperature. With the calcination temperature further increased to 800 °C, all anatase TiO2 disappeared and completely transformed into rutile TiO2 for the TiO2/C-800 composite. Therefore, with increasing calcination temperature from 650 to 800 °C for the TiO2/C composite, the anatase TiO2 gradually changed into the rutile TiO2, whose corresponding characteristic peaks also became stronger, indicating the gradual increase of the crystal size. The most intense peaks of anatase TiO2 (101) and rutile TiO2 (110) were used to calculate the crystalline size of TiO2 in the TiO2/C composites by the Scherrer equation.44 The calculated average crystalline sizes of TiO2 are respectively 8.6, 13.9, 20.2 and 27.0 nm for the TiO2/C-650, TiO2/C-700, TiO2/C-750 and TiO2/C-800.
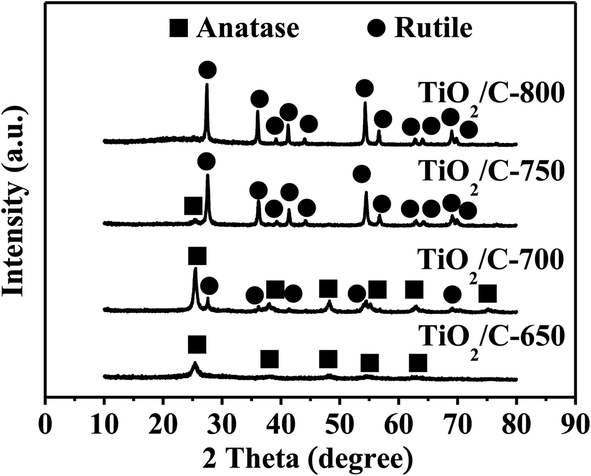 | ||
| Fig. 2 XRD patterns of the TiO2/C composites. | ||
The morphology and structure of the TiO2/C composites were characterized by SEM, as shown in Fig. 3. It can be seen that all TiO2/C composites were composed of spherical nanoparticles or agglomerates with many pores or gaps among them. The sizes of the pores or gaps were nearly the same for the TiO2/C-650, TiO2/C-700 and TiO2/C-750, while they became bigger for the TiO2/C-800, in line with the results in pore size distributions. However, the agglomeration of the spherical particles became more and more serious with the increase in the calcination temperature, resulting in the formation of larger particles, in accordance with the XRD results.
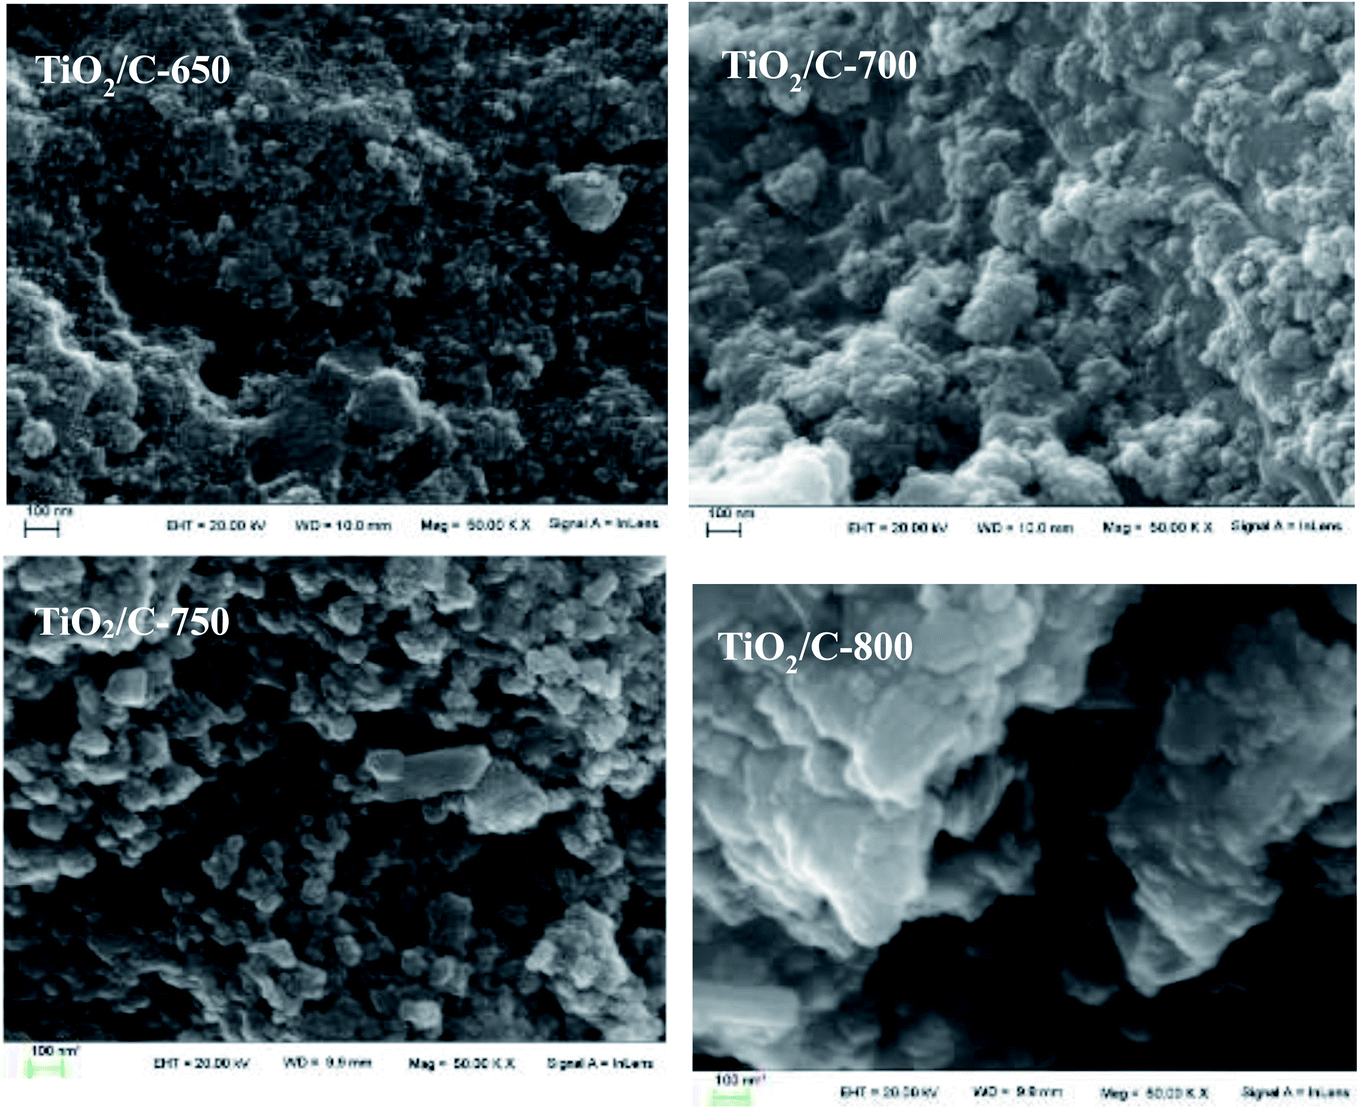 | ||
| Fig. 3 SEM images of the TiO2/C composites. | ||
To distinguish TiO2 from carbon and estimate its crystal size, TiO2/C-800 as a representative with the best photocatalytic activity (see Fig. 9) was characterized using high-resolution transmission electron microscopy. As shown in Fig. 4, the images suggest that spherical TiO2 nanoparticles or agglomerates were dispersed in the TiO2/C-800. The sizes of these particles were mainly in the range of 22–35 nm, which is consistent with the XRD results.
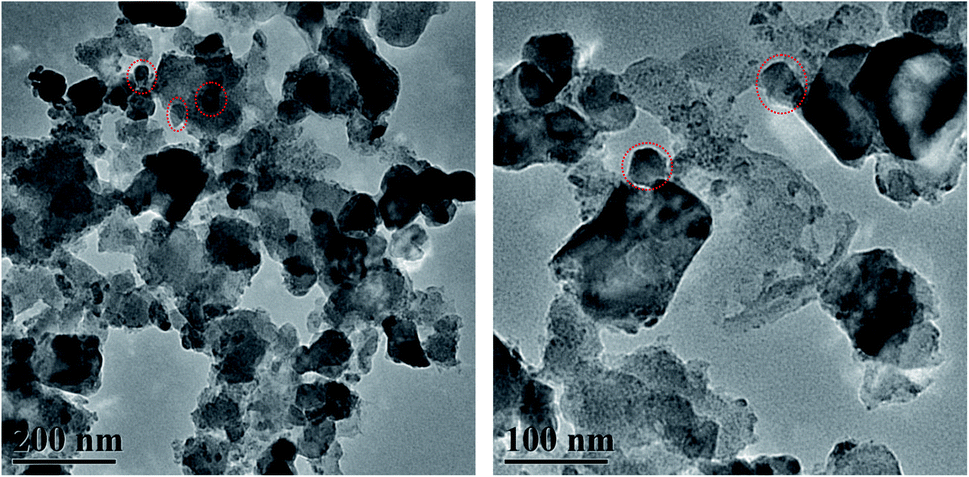 | ||
| Fig. 4 TEM images of the TiO2/C-800 composite. | ||
It was very easy to detect Raman spectroscopy signals for the material's crystallinity and microstructure. The nature of carbon present in the TiO2/C composite was also investigated by Raman spectroscopy since no peaks of carbon existed in the XRD patterns, as shown in Fig. 5. All TiO2/C composites showed two broad and weak peaks at around 1342 and 1590 cm−1, namely the D-band and G-band, except that the G-band peak in the TiO2/C-650 was at about 1560 cm−1. The G-band is assigned to graphitic carbon with sp2 hybrid while the D-band is ascribed to the defects present in the hexagonal graphitic structure. Compared with pure graphite, some imperfect structures of carbon caused the shift in the maximum wavenumbers for G-band peaks in the TiO2/C composites.45 The intensity ratios of the G-band and D-band (IG/ID) were respectively 0.62, 0.69, 0.77 and 0.87 for the TiO2/C-650, TiO2/C-700, TiO2/C-750 and TiO2/C-800, indicative of the enhanced carbon graphitization as a result of the increased calcination temperature.
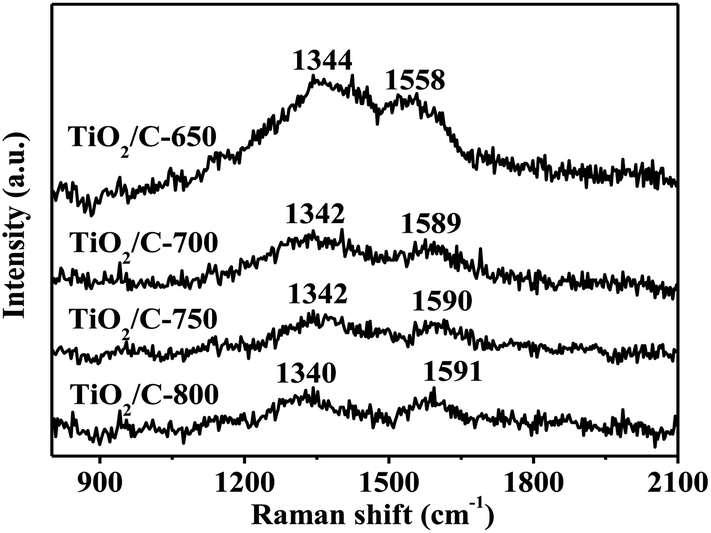 | ||
| Fig. 5 Raman spectra of the TiO2/C composites. | ||
3.2 Adsorption kinetics and equilibrium adsorption
To determine the time to reach the equilibrium adsorption, the effect of the contact time on the adsorption of MB onto the TiO2/C composite was studied. The amount of adsorbed MB on the TiO2/C-650, TiO2/C-700, and TiO2/C-750 had a little change after 2 h, while the one on the TiO2/C-800 did after 6 h. Therefore, to ensure that absolute equilibrium was established, 24 h was selected as the equilibrium time to determine the adsorption amount at equilibrium (qe) for all TiO2/C composites, as shown in Table 2. Both the amount of adsorption and percentage removal of MB increased with the increase in the calcination temperature for all TiO2/C composites. This was consistent with the decrease in the BET surface area and the increase in the crystal size, meaning that the graphitized carbon played a key role and had a significant effect on the adsorption of MB for these TiO2/C composites since the adsorptivity of TiO2 is very poor.46,47| Sample | Adsorption removal (%) | qe (mg g−1) |
|---|---|---|
| TiO2/C-650 | 7.6 | 1.4 |
| TiO2/C-700 | 26.4 | 4.8 |
| TiO2/C-750 | 55.9 | 10.2 |
| TiO2/C-800 | 80.1 | 14.6 |
The variations in the amount of adsorbed MB over contact time are shown in Fig. 6. The MB adsorption rate was very small and the concentration of MB had no change in 2 h for the TiO2/C-650. The MB adsorption rates in the initial 15 min were quick and then became slow for the TiO2/C-700, TiO2/C-750 and TiO2/C-800. It was observed that the higher the calcination temperature, the better the TiO2/C composite performance for MB adsorption. Thus, the adsorption capacities of MB on these TiO2/C composites followed the sequence: TiO2/C-650 < TiO2/C-700 < TiO2/C-750 < TiO2/C-800.
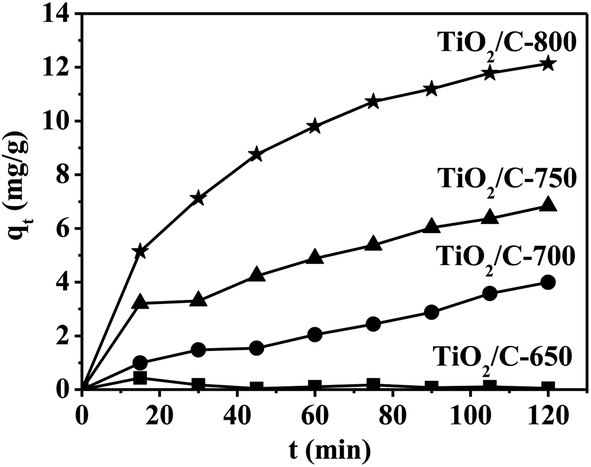 | ||
| Fig. 6 Adsorption capacity versus contact time for the adsorption of MB on the TiO2/C composite; (m(TiO2/C) = 80 mg, C0(MB) = 14 mg l−1). | ||
Generally, the process of liquid adsorption on a solid includes three steps: (I) film diffusion, (II) intraparticle diffusion or pore diffusion on the surface, (III) sorption onto interior sites.48 To investigate the mechanism of sorption and potential rate-controlling steps such as mass transport, and chemical reaction processes, four commonly accepted kinetic models were used to fit the present experimental data, which are as follows:49–54
Pseudo-first-order model:
ln(qe − qt) = ln![[thin space (1/6-em)]](https://www.rsc.org/images/entities/char_2009.gif) qe − k1t qe − k1t
| (4) |
Pseudo-second-order model:
| t/qt = 1/(k2qe2) + t/qe | (5) |
Weber intraparticle diffusion model:
| qt = kidt0.5 + C | (6) |
Elovich model:
|
qt = 1/βln(αβ) + 1/βlnt
| (7) |
The four models were used to investigate the MB adsorption kinetics only for the TiO2/C-700, TiO2/C-750 and TiO2/C-800, since almost no MB could be adsorbed on the TiO2/C-650. The fitted plots of these adsorption kinetic models are shown in Fig. 7(a–d) and the corresponding model fitting parameters are summarized in Table 3. The validity of each model was checked by the corresponding correlation coefficients (R2). As seen in Table 3, for the TiO2/C-700, the values of R2 from the pseudo-first-order, pseudo-second-order, and Elovich models were 0.869, 0.539 and 0.774, respectively. The calculated amount of MB equilibrium adsorption qe, cal (5.4 mg g−1) by the pseudo-first-order model was also closest to that from experiment qe, exp (4.8 mg g−1) for the TiO2/C-700. Similarly, the same rule as for the TiO2/C-700 existed for the TiO2/C-750. However, for the TiO2/C-800, the value of R2 (0.998) from the pseudo-second-order model was the largest, and there was a minimal difference between qe, cal and qe, exp; the fitted plot was also in good agreement with the Elovich model. Therefore, according to the qe, cal and R2, the pseudo-first-order model was considered as the best-fit in describing the MB adsorption kinetics for the TiO2/C-700 and TiO2/C-750, while the pseudo-second-order model, controlled by chemical adsorption, was the best for the TiO2/C-800.
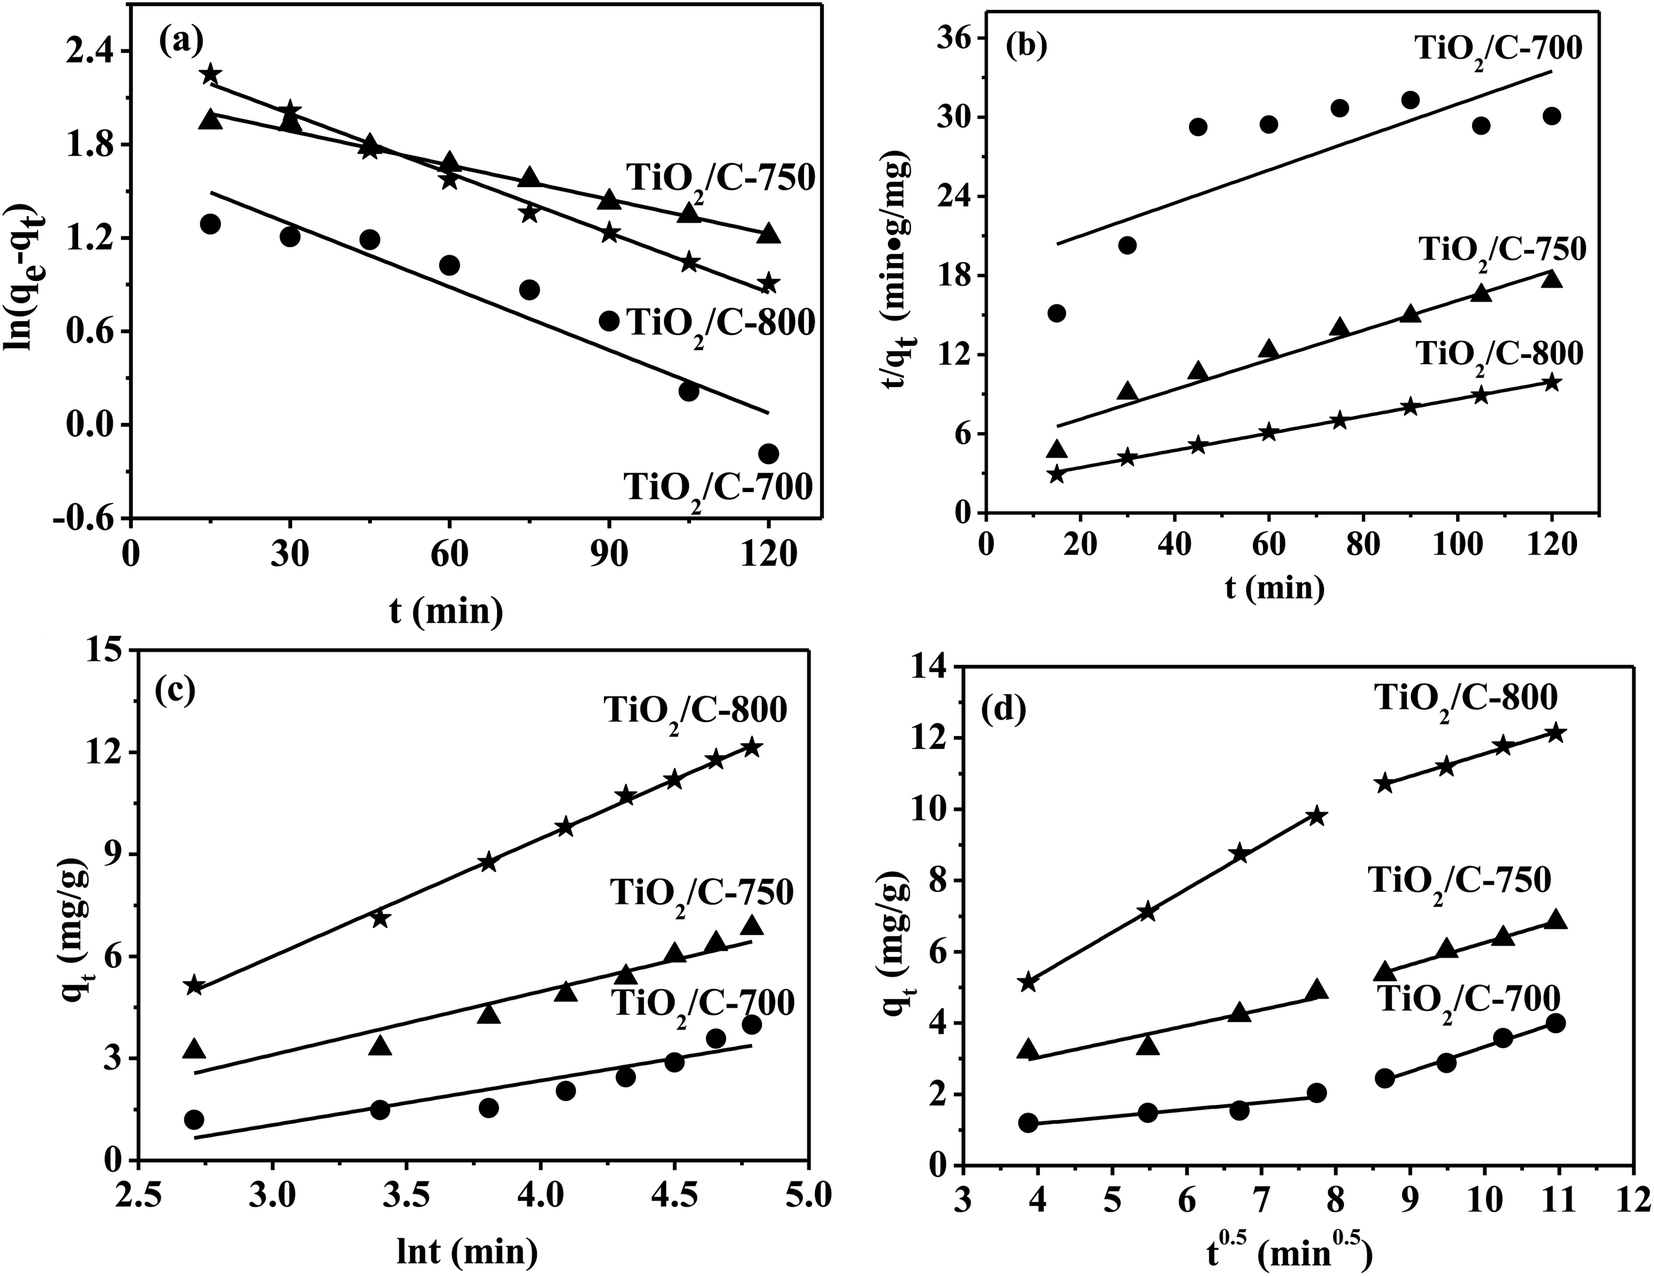 | ||
| Fig. 7 Fitted plots of (a) pseudo-first-order, (b) pseudo-second-order, (c) Elovich and (d) intraparticle diffusion kinetic models for the adsorption of MB on the TiO2/C composites. (m(TiO2/C) = 80 mg, C0(MB) = 14 mg l−1). | ||
| Models | Parameters | TiO2/C-700 | TiO2/C-750 | TiO2/C-800 |
|---|---|---|---|---|
| Pseudo-first-order equation: ln(qe − qt) = lnqe − k1t |
k1 | 0.013 | 0.0073 | 0.013 |
| qe, cal | 5.4 | 8.2 | 10.8 | |
| R2 | 0.869 | 0.987 | 0.989 | |
| Pseudo-second-order equation: t/qt = 1/(k2qe2) + t/qe | k2 | 0.0010 | 0.0026 | 0.0020 |
| qe, cal | 8.0 | 8.9 | 15.4 | |
| R2 | 0.539 | 0.941 | 0.998 | |
| Elovich equation: qt = 1/βln(αβ) + 1/βlnt |
α | 0.14 | 0.49 | 0.97 |
| β | 0.77 | 0.54 | 0.29 | |
| R2 | 0.774 | 0.895 | 0.996 | |
| The Weber intraparticle diffusion equation: qt = kidt0.5 + C | kid | 0.20 | 0.45 | 1.22 |
| C | 0.39 | 1.24 | 0.45 | |
| R2 | 0.812 | 0.812 | 0.996 | |
| Experimental data | qe, exp | 4.8 | 10.2 | 14.6 |
The Weber intraparticle diffusion model was used to analyze the kinetic data in order to investigate whether intraparticle diffusion was the rate-limiting step in the adsorption process, as shown in Fig. 7(d). A plot of the amount of MB adsorbed (qt) versus t1/2 should be linear, and if the line passes through the origin, then intraparticle diffusion is the only rate-controlling step.53 The plots presented two linear parts, which indicate that the intraparticle diffusion was not the sole rate-controlling step for the TiO2/C-700, TiO2/C-750 and TiO2/C-800.
The results of the transient photocurrent measurements for the TiO2/C composites are shown in Fig. 8. Each TiO2/C composite/ITO glass electrode exhibited a current response to UV light, and the current rapidly decreased as soon as they were in the dark. The photogenerated current densities remained stable during the irradiation, due to the presence of a contact potential between the TiO2/C composite particles and ITO glass. This photo-responsive behaviour was completely reversible. It was observed that the photocurrent density was 0.3, 2.5, 8.7 and 11.0 μA cm−2 for the TiO2/C-650, TiO2/C-700, TiO2/C-750 and TiO2/C-800 under the irradiation of UV light, respectively. These results indicated that the separation efficiency of the photoinduced electrons and holes in the TiO2/C composites increased with the increase in the calcination temperature, ascribed to the formation of more graphitized carbon.
 | ||
| Fig. 8 Transient photocurrent responses of the TiO2/C composites under UV light irradiation at 0 V vs. SCE; the inset is an enlarged view of the plot for TiO2/C-650. | ||
3.3 Photocatalytic activity
At room temperature and atmospheric pressure, the UV light photocatalytic degradation activity of MB on 50 mg of the TiO2/C composite is shown in Fig. 8. Compared with the photocatalytic degradation of MB, the removal of MB adsorption on the TiO2/C composite was measured under the same conditions except for no light irradiation, as shown in Fig. 9(a). The adsorption equilibrium approximately reached the adsorption in the dark since the concentration of MB remained almost unchanged after 2.5 h. Therefore, in the photocatalytic degradation of MB, 2.5 h was selected for MB adsorption on the TiO2/C composites in the dark, and then the mixture was irradiated for 3 h again under a 15 W UV light source, as shown in Fig. 9(b). The concentration of MB did not change with contact time in the absence of the TiO2/C composite, indicating no self-degradation of MB. The percentages of photocatalytic degradation of MB were 11.0%, 16.4%, 38.1% and 60.5%, while those of adsorption removal of MB are respectively 4.6%, 13.7%, 26.1% and 35.4% for the TiO2/C-650, TiO2/C-700, TiO2/C-750 and TiO2/C-800, respectively. The difference between the percentage of photocatalytic degradation and that of adsorption removal was both very small (less than 7%) for the TiO2/C-650 and TiO2/C-700, indicating the low activity of the photocatalytic degradation of MB. The differences between the percentage of photocatalytic degradation and that of adsorption removal were 12.0% and 25.1% for the TiO2/C-750 and TiO2/C-800, respectively, suggesting enhanced activity with the increase in the calcination temperature. The kinetics of MB photodegradation over the TiO2/C composite was delineated using the pseudo-first-order kinetics model according to the method in the literature.55 The results are presented in Fig. 9(c). The reaction rate constants for the TiO2/C-650, TiO2/C-700, TiO2/C-750 and TiO2/C-800 were 6.8 × 10⁻⁴, 5.5 × 10⁻⁴, 1.3 × 10⁻³ and 3.4 × 10⁻³ min−1, respectively. The difference in rate constants for the TiO2/C-650 and TiO2/C-700 was very small. The rate constants for the TiO2/C-750 and TiO2/C-800 were about 2 and 5 times that for the TiO2/C-650, respectively. Thus, the performance of UV light photocatalytic degradation of MB on the four TiO2/C composites followed the sequence: TiO2/C-800 > TiO2/C-750 > TiO2/C-700 > TiO2/C-650.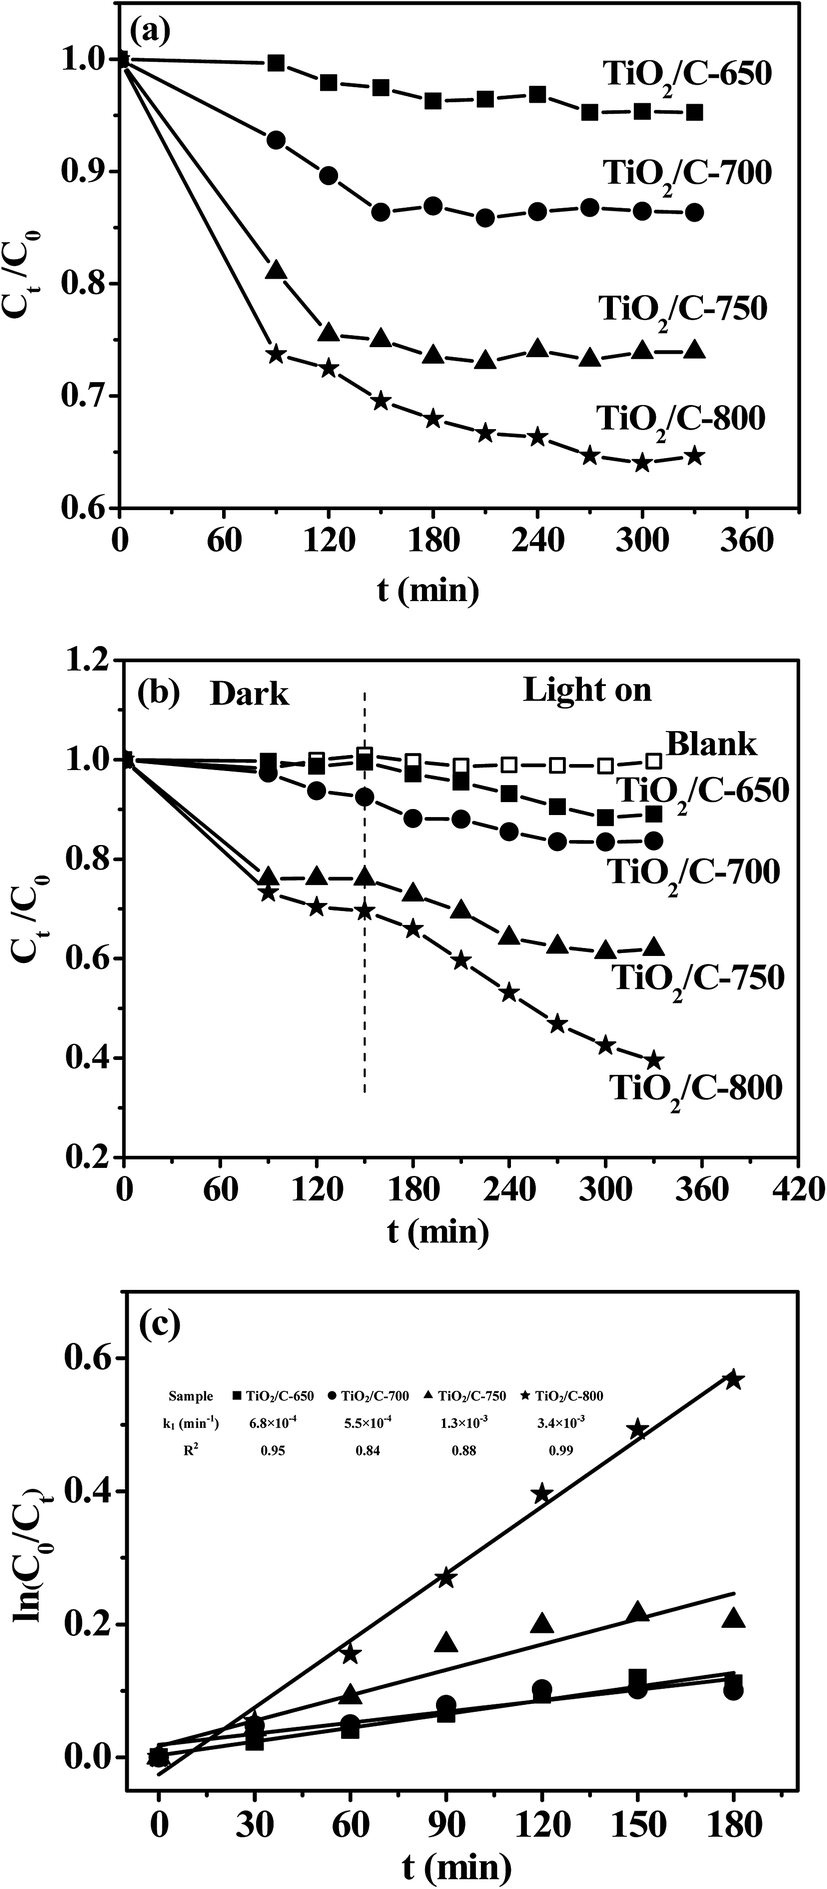 | ||
| Fig. 9 MB concentration versus contact time for adsorption removal (a), UV light photocatalytic degradation (b) and fitted plots of pseudo first order kinetic model for photocatalytic degradation (c) of MB on the TiO2/C composites. (m(TiO2/C) = 50 mg, C0(MB) = 14 mg l−1). | ||
In the photocatalysis reaction, the performance of the photocatalyst is mainly determined by the following three properties: the adsorption of reactant, the light absorbance, and the transport and separation of photogenerated carriers.46,56 These properties are greatly influenced by the surface characterization, such as specific surface area, crystal phase-type, crystallite size and dispersed surface-active species.56
High specific surface area and small crystal size are beneficial for providing more active sites for adsorption and reaction, leading to higher photocatalytic activity.17 However, the present TiO2/C composite with higher BET surface area and smaller crystal TiO2 did not exhibit the better adsorptivity, indicating that the adsorptivity could not be caused only by single physical adsorption and highly dispersed crystal TiO2. Although the pseudo-first-order model was the best-fitting model in describing the MB adsorption kinetics for the TiO2/C-700 and TiO2/C-750, and the pseudo-second-order model for the TiO2/C-800, the corresponding correlation coefficients (R2) from the pseudo-second-order model increased with the increase in the calcination temperature for these TiO2/C composites. This means that the enhanced adsorptivity should be largely attributed to selective chemical adsorption by the π–π stacking between the aromatics of MB and graphitic carbon in the TiO2/C composite.45,46
The formed encapsulation of the carbon layers can suppress the phase transformation and crystal growth of TiO2 at the calcination temperature of 800 °C.46 The anatase gradually became rutile in the TiO2/C composites on increasing the calcination temperature from 650 to 800 °C. This means that less encapsulation of carbon layers existed in the present TiO2/C composites. The anatase had higher photoactivity due to its faster rate of diffusion and a lower recombination of charge carriers as compared with rutile for TiO2; furthermore, a rutile component along with anatase can also enhance the photocatalytic activity.57 However, the TiO2/C-700 did not exhibit the highest photocatalytic activity of MB degradation despite having a high BET surface area, small crystal size of TiO2, and high anatase/rutile ratio; interestingly, the entire rutile TiO2/C-800 exhibited the highest photocatalytic activity. It was inferred that the graphitic carbon may have a significant effect on not only the adsorptivity, but the light absorbance and the efficiency of transport and the separation of photogenerated carriers. The photocurrent results confirmed the higher efficiency of transport and separation of photogenerated carriers for the TiO2/C composite with more graphitic carbon. We attempted to measure the absorbance of TiO2 in the TiO2/C composites by UV-vis diffuse reflectance spectroscopy but no signals could be detected, probably because the excess carbon absorbed most of the light. Thus, the photocatalytic activities of the TiO2/C composites were also investigated in the visible light range of the spectrum (λ > 420 nm), as shown in Fig. 10. Compared with the adsorption removal (in Fig. 9), the percentages of photocatalytic degradation did not change, indicative of no visible light photocatalytic activities for the TiO2/C-650 and TiO2/C-700. The differences between the percentage of photocatalytic degradation and that of adsorption removal were 5.9% and 10.6% for the TiO2/C-750 and TiO2/C-800, respectively. Therefore, both TiO2/C-750 and TiO2/C-800 exhibited lower photocatalytic activity under visible light as compared to under UV light. The results indirectly indicate that graphitic carbon promoted the absorbance of visible light by the formation of the Ti–O–C bond, similar to the case of the P25–GR composites.46
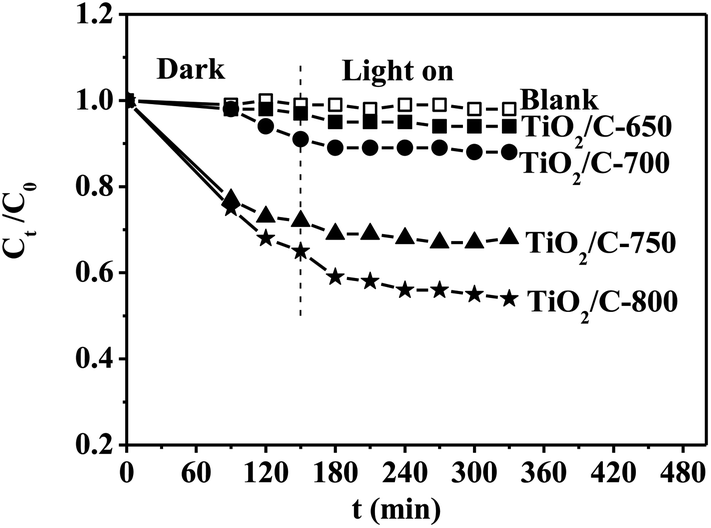 | ||
| Fig. 10 MB concentration versus contact time for the photocatalytic degradation of MB on the TiO2/C composites under the irradiation of a visible light source with a power of 140 W. (m(TiO2/C) = 50 mg, C0(MB) = 14 mg l−1). | ||
To explain the role that carbon plays in the TiO2/C composite, the photocatalytic performances of three TiO2 crystalline structures (anatase, the mixture of anatase/rutile, and rutile, see the inset of Fig. 11(a)) were investigated for comparison by heating the corresponding TiO2/C composites at different temperatures in air. However, the phase of TiO2 obtained by calcination in air was different from that in an inert gas at the same temperature; e.g., the mixture of anatase/rutile existed in TiO2 obtained by calcination of the TiO2/C-650 in air at 650 °C (data not given). Therefore, 550, 700 and 800 °C were respectively selected as calcination temperatures to obtain three TiO2 crystals (anatase, the mixture of anatase/rutile, and rutile), namely TiO2-550, TiO2-700 and TiO2-800. The results of their XRD patterns can be seen in the inset of Fig. 11(a).
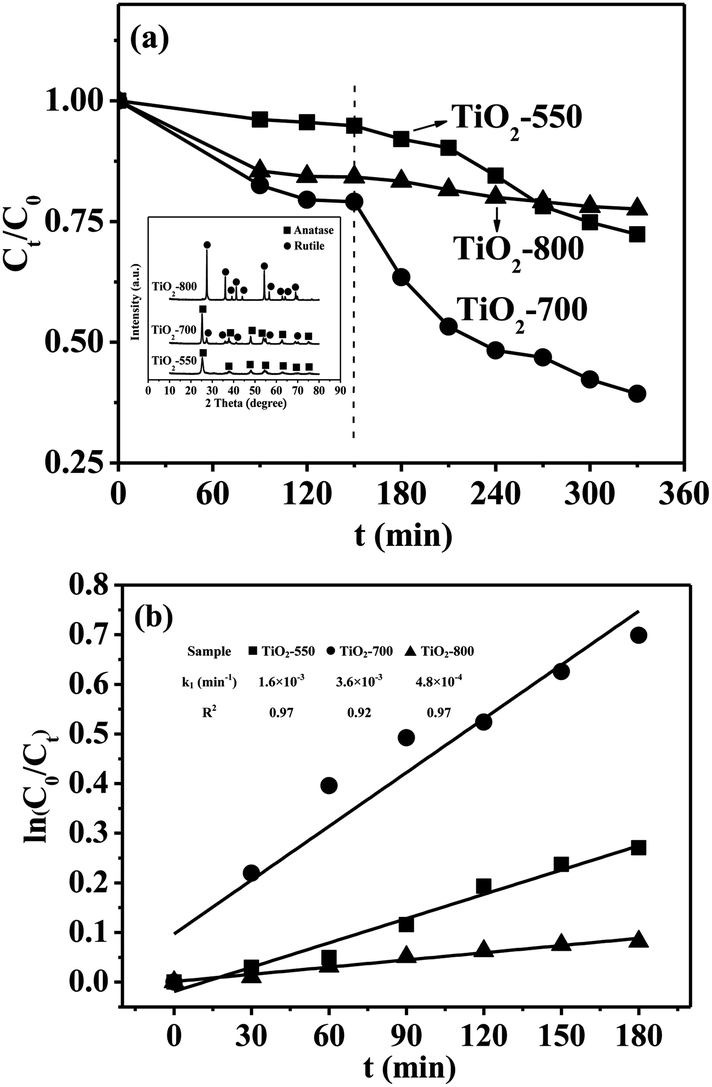 | ||
| Fig. 11 (a) MB concentration versus contact time for UV light photocatalytic degradation. Fitted plots of the pseudo-first-order kinetic model for photocatalytic degradation (b) of MB on the different phases of TiO2; XRD patterns of these TiO2 are shown in the inset of (a). (m(TiO2) = 30 mg, C0(MB) = 14 mg l−1). | ||
At room temperature and atmospheric pressure, the UV light photocatalytic degradation activity of MB on 30 mg of TiO2 (about equal to the mass of TiO2 in the composites) is shown in Fig. 11(a). The differences in the percentage of photocatalytic degradation and that of adsorption removal were 22.5%, 39.7% and 6.7% for the TiO2-550, TiO2-700 and TiO2-800, respectively. As seen in Fig. 11(b), the rate constants of the pseudo-first-order reaction for the TiO2-550, TiO2-700 and TiO2-800 were 1.6 × 10⁻³, 3.6 × 10⁻³ and 4.8 × 10⁻⁴ min−1, respectively. Therefore, the TiO2-550 and TiO2-700 had higher photocatalytic activities than the TiO2/C-650 and TiO2/C-700 with the same phases of TiO2, while the TiO2-800 had lower photocatalytic activity than the TiO2/C-800. Thus, TiO2/C-800 had higher photocatalytic activity than pure TiO2 (anatase or rutile). These results show that carbon nanoparticles could screen the UV light reaching the surface of TiO2, leading to lower activity.58 The TiO2/C-800 had enhanced photocatalytic performance due to the formation of more graphite carbon, which can decrease the recombination of electron/hole pairs and increase the adsorptivity on MB.59
To illustrate more clearly what role carbon plays, photocatalytic activities for MB degradation over the TiO2 composites with different carbon materials are summarized in Table 4. As seen in Table 4, the rate contants of the pseudo-first-order reaction for MB photocatalytic degradation on the same TiO2 (P25) catalysts were greatly different due to the variety of UV light sources and initial concentrations of MB, etc. Doping carbon or the combination with graphite-like carbon can improve the adsorptivity of MB or/and the efficiency of transportation and separation for the photogenerated holes and electrons on the TiO2, resulting in the significant enhancement of photocatalytic activity; excessive carbon would lead to lower photocatalytic performance. Despite the high carbon content, TiO2/C-800 with only rutile TiO2 crystal particles in this work still showed higher photocatalytic activity than pure anatase TiO2, indicating that the promotion of graphitized carbon was dominant, as compared with its inhibition from the shielding effect.
| Catalyst | Preparation method | Light source | C0(MB) (mg l−1) | Catalyst dose (mg l−1) | Rate constant (min−1) | Reference |
|---|---|---|---|---|---|---|
| TiO2 (P25) | In situ graphitization method | UV (254 nm, 11 W, 0.9 W m−2) | 10 | 500 | 0.1 | 26 |
| 3% graphene-like carbon/TiO2 | 0.25 | |||||
| TiO2 (P25) | Solvothermal method | UV (320–390 nm, 70.2 W m−2) + UV (400–780 nm, 452.5 W m−2) | 25 | 500 | 4.60 × 10⁻³ | 35 |
| 13.5% carbon-doped TiO2 | 8.26 × 10⁻³ | |||||
| TiO2 (P25) | Hydrothermal method | UV (365 nm, 100 W, 0.3 W m−2) | 10 | 750 | 4.06 × 10⁻³ | 46 |
| P25–graphene | 3.45 × 10⁻² | |||||
| TiO2-550 | Liquid phase reaction combined with calcination | UV (254 nm, 15 W, 0.4 W m−2) | 14 | 500 | 1.6 × 10⁻³ | This work |
| TiO2/C-800 | 3.4 × 10⁻³ |
The graphitic carbon formed has a significant effect on the adsorption of reactant, the light absorbance, and the transport and separation of photogenerated carriers, leading to the enhanced photocatalytic activity for the TiO2/C composite.
4. Conclusions
(1) The TiO2/C composite containing approximately 40 wt% carbon was successfully prepared by a method of calcination combined with a one-pot liquid phase reaction. The composite predominantly presented a mesoporous structure with high surface area, highly dispersed TiO2 and partly graphitized carbon.(2) No obvious adsorption of MB occurred for the entire anatase TiO2/C-650; the pseudo-first-order model was the best fit for describing the MB adsorption kinetics for the TiO2/C-700 and TiO2/C-750 with the mixture of anatase and rutile, while the pseudo-second-order model, controlled by chemical adsorption, was for the entire rutile TiO2/C-800.
(3) With the increase in the calcination temperature from 650 to 800 °C for the TiO2/C composite, the BET surface area decreased, together with the increase in the rutile of TiO2 and crystal size. However, the TiO2/C composite with more rutile TiO2 and graphitic carbon exhibited better adsorption capacity, due to the presence of the graphitic carbon, strongly interacting with MB by offset face-to-face stacking via π–π conjugation.
(4) Besides the adsorption of MB, the graphitized carbon can also promote the light absorbance and the efficiency of the transport and separation of photoinduced electrons and holes. Thus, the synergistic effect of adsorption-enrichment and the photocatalytic degradation of MB on the TiO2/C composite was realized, and the photocatalytic activity of the TiO2/C composite increased with increasing the calcination temperature from 650 to 800 °C.
(5) Notably, all the intensity ratios of the G-band and D-band (IG/ID) in the TiO2/C composites were less than 1. Thus, with further enhancement of the content of graphitized carbon in the TiO2/C composite by optimization of the parameters such as calcination temperature, carbon content and other aspects of the preparation procedure, the photocatalytic performance of the TiO2/C composite is expected to be remarkably improved.
Conflicts of interest
We declare that we do not have any commercial or associative interest that represents a conflict of interest in connection with the work submitted.Acknowledgements
This work was supported by Scientific & Technological Project of Education Department of Jiangxi Province (GJJ13567, GJJ170664 and GJJ180597), Scientific Research Foundation for Doctor of Jiangxi Science and Technology Normal University, P. R. China (00001369), Natural Science Foundation of Jiangxi Province (20181BAB206004), and National Natural Science Foundation of China (51861008).References
- M. T. Yagub, T. K. Sen, S. Afroze and H. M. Ang, Dye and its removal from aqueous solution by adsorption: a review, Adv. Colloid Interface Sci., 2014, 209, 172–184 CrossRef CAS.
- K. B. Tan, M. Vakili, B. A. Horri, P. E. Poh, A. Z. Abdullah and B. Salamatinia, Adsorption of dyes by nanomaterials: recent developments and adsorption mechanisms, Sep. Purif. Technol., 2015, 150, 229–242 CrossRef CAS.
- C. Santhosh, V. Velmurugan, G. Jacob, S. K. Jeong, A. N. Grace and A. Bhatnagar, Role of nanomaterials in water treatment applications: a review, Chem. Eng. J., 2016, 306, 1116–1137 CrossRef CAS.
- Z. Cai, Y. Sun, W. Liu, F. Pan, P. Sun and J. Fu, An overview of nanomaterials applied for removing dyes from wastewater, Environ. Sci. Pollut. Res., 2017, 24(19), 15882–15904 CrossRef CAS.
- J. Chang, J. Ma, Q. Ma, D. Zhang, N. Qiao and M. Hu, et al., Adsorption of methylene blue onto Fe3O4/activated montmorillonite nanocomposite, Appl. Clay Sci., 2016, 119, 132–140 CrossRef CAS.
- F. Zhang, X. Chen, F. Wu and Y. Ji, High adsorption capability and selectivity of ZnO nanoparticles for dye removal, Colloids Surf., A, 2016, 509, 474–483 CrossRef CAS.
- W. Zou, B. Gao, Y. S. Ok and L. Dong, Integrated adsorption and photocatalytic degradation of volatile organic compounds (VOCs) using carbon-based nanocomposites: a critical review, Chemosphere, 2019, 218, 845–859 CrossRef CAS.
- D. Sud and P. Kaur, Heterogeneous photocatalytic degradation of selected organophosphate pesticides: a review, Crit. Rev. Environ. Sci. Technol., 2012, 42(22), 2365–2407 CrossRef CAS.
- K. Nakata and A. Fujishima, TiO2 photocatalysis: design and applications, J. Photochem. Photobiol., C, 2012, 13(3), 169–189 CrossRef CAS.
- N. A. Ab Aziz, P. Palaniandy, H. A. Aziz and I. Dahlan, Review of the mechanism and operational factors influencing the degradation process of contaminants in heterogenous photocatalysis, J. Chem. Res., 2016, 40(11), 704–712 CrossRef CAS.
- X. Bian and R. Ji, Photocatalytic degradation of methyl blue by tourmaline-coated TiO2 nanoparticles, Desalin. Water Treat., 2016, 57(41), 19292–19300 CrossRef CAS.
- A. Kumar, V. Sharma, S. Kumar, A. Kumar and V. Krishnan, Towards utilization of full solar light spectrum using green plasmonic Au–TiOx photocatalyst at ambient conditions, Surf. Interfaces, 2018, 11, 98–106 CrossRef CAS.
- V. Sharma, R. Balaji, A. Kumar, N. Kumari and V. Krishnan, Bioinspired 3 D Surface-Enhanced Raman Spectroscopy Substrates for Surface Plasmon Driven Photoxidation Reactions: Role of Catalyst and Substrate in Controlling the Selectivity of Product Formation, ChemCatChem, 2018, 10(5), 975–979 CrossRef CAS.
- A. Kumar, K. Kumar and V. Krishnan, Sunlight driven methanol oxidation by anisotropic plasmonic Au nanostructures supported on amorphous titania: influence of morphology on photocatalytic activity, Mater. Lett., 2019, 245, 45–48 CrossRef CAS.
- Y. Kuwahara and H. Yamashita, Efficient photocatalytic degradation of organics diluted in water and air using TiO2 designed with zeolites and mesoporous silica materials, J. Mater. Chem., 2011, 21(8), 2407–2416 RSC.
- S. A. Lee, K. H. Choo, C. H. Lee, H. I. Lee, T. Hyeon and W. Choi, et al., Use of ultrafiltration membranes for the separation of TiO2 photocatalysts in drinking water treatment, Ind. Eng. Chem. Res., 2001, 40(7), 1712–1719 CrossRef CAS.
- A. Bhattacharyya, S. Kawi and M. B. Ray, Photocatalytic degradation of orange II by TiO2 catalysts supported on adsorbents, Catal. Today, 2004, 98(3), 431–439 CrossRef CAS.
- S. Kalikeri, N. Kamath, D. J. Gadgil and V. S. Kodialbail, Visible light-induced photocatalytic degradation of Reactive Blue-19 over highly efficient polyaniline-TiO2 nanocomposite: a comparative study with solar and UV photocatalysis, Environ. Sci. Pollut. Res., 2018, 25(4), 3731–3744 CrossRef CAS.
- P. Benjwal and K. K. Kar, Simultaneous photocatalysis and adsorption based removal of inorganic and organic impurities from water by titania/activated carbon/carbonized epoxy nanocomposite, J. Environ. Chem. Eng., 2015, 3(3), 2076–2083 CrossRef CAS.
- W. Li, C. Shang and X. Li, A one-step thermal decomposition method to prepare anatase TiO2 nanosheets with improved adsorption capacities and enhanced photocatalytic activities, Appl. Surf. Sci., 2015, 357, 2223–2233 CrossRef CAS.
- G. Zhang, B. Wang, Z. Sun, S. Zheng and S. Liu, A comparative study of different diatomite-supported TiO2 composites and their photocatalytic performance for dye degradation, Desalin. Water Treat., 2016, 57(37), 17512–17522 CrossRef CAS.
- L. Laysandra, M. W. M. K. Sari, F. E. Soetaredjo, K. Foe, J. N. Putro and A. Kurniawan, et al., Adsorption and photocatalytic performance of bentonite-titanium dioxide composites for methylene blue and rhodamine B decoloration, Heliyon, 2017, 3(12), e00488 CrossRef.
- J. Shi, Y. Kuwahara, T. An and H. Yamashita, The fabrication of TiO2 supported on slag-made calcium silicate as low-cost photocatalyst with high adsorption ability for the degradation of dye pollutants in water, Catal. Today, 2017, 281, 21–28 CrossRef CAS.
- B. Zhang, Q. Wang, J. Zhuang, S. Guan and B. Li, Molten salt assisted in situ synthesis of TiO2/g-C3N4 composites with enhanced visible-light-driven photocatalytic activity and adsorption ability, J. Photochem. Photobiol., A, 2018, 362, 1–13 CrossRef CAS.
- X. Zhou, S. Zhou, F. Ma and Y. Xu, Synergistic effects and kinetics of rGO-modified TiO2 nanocomposite on adsorption and photocatalytic degradation of humic acid, J. Environ. Manage., 2019, 235, 293–302 CrossRef CAS.
- Y. Wang, R. Shi, J. Lin and Y. Zhu, Significant photocatalytic enhancement in methylene blue degradation of TiO2 photocatalysts via graphene-like carbon in situ hybridization, Appl. Catal., B, 2010, 100(1–2), 179–183 CrossRef CAS.
- R. Giovannetti, E. Rommozzi, M. Zannotti and C. A. D'Amato, Recent advances in graphene based TiO2 nanocomposites (GTiO2Ns) for photocatalytic degradation of synthetic dyes, Catalysts, 2017, 7(10), 305 CrossRef.
- Y. Li, S. Zhang, Q. Yu and W. Yin, The effects of activated carbon supports on the structure and properties of TiO2 nanoparticles prepared by a sol-gel method, Appl. Surf. Sci., 2007, 253(23), 9254–9258 CrossRef CAS.
- Z. Lei, Y. Xiao, L. Dang, W. You, G. Hu and J. Zhang, Nickel-catalyzed fabrication of SiO2, TiO2/graphitized carbon, and the resultant graphitized carbon with periodically macroporous structure, Chem. Mater., 2007, 19(3), 477–484 CrossRef CAS.
- Y. Yao, G. Li, S. Ciston, R. M. Lueptow and K. A. Gray, Photoreactive TiO2/carbon nanotube composites: synthesis and reactivity, Environ. Sci. Technol., 2008, 42(13), 4952–4957 CrossRef CAS.
- Y. Liu, S. Yang, J. Hong and C. Sun, Low-temperature preparation and microwave photocatalytic activity study of TiO2-mounted activated carbon, J. Hazard. Mater., 2007, 142(1–2), 208–215 CrossRef CAS.
- Y. Tao, S. Schwartz, C. Wu and D. W. Mazyck, Development of a TiO2/AC composite photocatalyst by dry impregnation for the treatment of methanol in humid air streams, Ind. Eng. Chem. Res., 2005, 44(19), 7366–7372 CrossRef CAS.
- X. Wang, Z. Hu, Y. Chen, G. Zhao, Y. Liu and Z. Wen, A novel approach towards high-performance composite photocatalyst of TiO2 deposited on activated carbon, Appl. Surf. Sci., 2009, 255(7), 3953–3958 CrossRef CAS.
- F. Dong, H. Wang and Z. Wu, One-step “green” synthetic approach for mesoporous C-doped titanium dioxide with efficient visible light photocatalytic activity, J. Phys. Chem. C, 2009, 113(38), 16717–16723 CrossRef CAS.
- J. Matos, A. Garcia, L. Zhao and M. M. Titirici, Solvothermal carbon-doped TiO2 photocatalyst for the enhanced methylene blue degradation under visible light, Appl. Catal., A, 2010, 390(1–2), 175–182 CrossRef CAS.
- F. Dong, S. Guo, H. Wang, X. Li and Z. Wu, Enhancement of the visible light photocatalytic activity of C-doped TiO2 nanomaterials prepared by a green synthetic approach, J. Phys. Chem. C, 2011, 115(27), 13285–13292 CrossRef CAS.
- X. Yan, B. K. Tay and Y. Yang, Dispersing and functionalizing multiwalled carbon nanotubes in TiO2 sol, J. Phys. Chem. B, 2006, 110(51), 25844–25849 CrossRef CAS.
- Q. Xiao, J. Zhang, C. Xiao, Z. Si and X. Tan, Solar photocatalytic degradation of methylene blue in carbon-doped TiO2 nanoparticles suspension, Sol. Energy, 2008, 82(8), 706–713 CrossRef CAS.
- H. Yu, X. Quan, S. Chen and H. Zhao, TiO2-multiwalled carbon nanotube heterojunction arrays and their charge separation capability, J. Phys. Chem. C, 2007, 111(35), 12987–12991 CrossRef CAS.
- C. S. Kuo, Y. H. Tseng, C. H. Huang and Y. Y. Li, Carbon-containing nano-titania prepared by chemical vapor deposition and its visible-light-responsive photocatalytic activity, J. Mol. Catal. A: Chem., 2007, 270(1–2), 93–100 CrossRef CAS.
- R. Liu, Y. Ren, Y. Shi, F. Zhang, L. Zhang and B. Tu, et al., Controlled synthesis of ordered mesoporous C-TiO2 nanocomposites with crystalline titania frameworks from organic-inorganic-amphiphilic coassembly, Chem. Mater., 2008, 20(3), 1140–1146 CrossRef CAS.
- Y. Gu, W. Wen and J. Wu, Simple air calcination affords commercial carbon cloth with high areal specific capacitance for symmetrical supercapacitors, J. Mater. Chem. A, 2018, 6(42), 21078–21086 RSC.
- M. Thommes, K. Kaneko, A. V. Neimark, J. P. divier, F. Rodriguez-Reinoso and J. Rouquerol, et al., Physisorption of gases, with special reference to the evaluation of surface area and pore size distribution (IUPAC Technical Report), Pure Appl. Chem., 2015, 87(9–10), 1051–1069 CAS.
- W. N. Schreiner and R. Jenkins, Profile fitting for quantitative analysis in X-Ray powder diffraction, Adv. X-Ray Anal., 1983, 26, 141–147 CrossRef CAS.
- L. Zhang, H. Fu and Y. Zhu, Efficient TiO2 photocatalysts from surface hybridization of TiO2 particles with graphite-like carbon, Adv. Funct. Mater., 2008, 18(15), 2180–2189 CrossRef CAS.
- H. Zhang, X. Lv, Y. Li, Y. Wang and J. Li, P25-graphene composite as a high performance photocatalyst, ACS Nano, 2010, 4(1), 380–386 CrossRef CAS.
- C. Hu, F. Chen, T. Lu, C. Lian, S. Zheng and Q. Hu, et al., Water-phase strategy for synthesis of TiO2-graphene composites with tunable structure for high performance photocatalysts, Appl. Surf. Sci., 2014, 317, 648–656 CrossRef CAS.
- X. Peng, D. Huang, T. Odoom-Wubah, D. Fu, J. Huang and Q. Qin, Adsorption of anionic and cationic dyes on ferromagnetic ordered mesoporous carbon from aqueous solution: equilibrium, thermodynamic and kinetics, J. Colloid Interface Sci., 2014, 430, 272–282 CrossRef CAS.
- Y. S. Ho and G. Mckay, A comparison of chemisorption kinetic models applied to pollutant removal on various sorbents, Trans. IChemE, 1998, 76(4), 332–340 CrossRef CAS.
- Y. S. Ho and G. Mckay, Pseudo-second order model for sorption processes, Process Biochem., 1999, 34(5), 451–465 CrossRef CAS.
- G. F. Malash and M. I. El-Khaiary, Piecewise linear regression: a statistical method for the analysis of experimental adsorption data by the intraparticle diffusion models, Chem. Eng. J., 2010, 163(3), 256–263 CrossRef CAS.
- M. Ghaedi, A. M. Ghaedi, B. Mirtamizdoust, S. Agarwal and V. K. Gupta, Simple and facile sonochemical synthesis of lead oxide nanoparticles loaded activated carbon and its application for methyl orange removal from aqueous phase, J. Mol. Liq., 2016, 213, 48–57 CrossRef CAS.
- Z. Ezzeddine, I. Batonneau-Gener, Y. Pouilloux and H. Hamad, Removal of methylene blue by mesoporous CMK-3: kinetics, isotherms and thermodynamics, J. Mol. Liq., 2016, 223, 763–770 CrossRef CAS.
- B. Wang, B. Gao and Y. Wan, Comparative study of calcium alginate, ball-milled biochar, and their composites on aqueous methylene blue adsorption, Environ. Sci. Pollut. Res., 2019, 26(12), 11535–11541 CrossRef CAS.
- Y. Xu, W. Wen and J. Wu, Titania nanowires functionalized polyester fabrics with enhancedphotocatalytic and antibacterial performances, J. Hazard. Mater., 2018, 343, 285–297 CrossRef CAS.
- J. Kou, C. Lu, J. Wang, Y. Chen, Z. Xu and R. S. Varma, Selectivity enhancement in heterogeneous photocatalytic transformations, Chem. Rev., 2017, 117(3), 1445–1514 CrossRef CAS.
- J. H. Johnston and A. C. Small, Photoactivity of nano-structured calcium silicate-titanium dioxide composite materials, J. Mater. Chem., 2011, 21(4), 1240–1245 RSC.
- V. Vaiano, O. Sacco and M. Matarangolo, Photocatalytic degradation of paracetamol under UV irradiation using TiO2-grahite composites, Catal. Today, 2018, 315, 230–236 CrossRef CAS.
- D. Awfa, M. Ateia, M. Fujii, M. S. Johnson and C. Yoshimura, Photodegradation of pharmaceuticals and personal care products in water treatment using carbonaceous-TiO2 composites: a critical review of recent literature, Water Res., 2018, 142, 26–45 CrossRef CAS.
| This journal is © The Royal Society of Chemistry 2020 |