 Open Access Article
Creative Commons Attribution 3.0 Unported Licence
Microwave-assisted pyrolysis of Pachira aquatica leaves as a catalyst for the oxygen reduction reaction
Sun-Tang Chang a,
Huan-Ping Jhonga,
Yu-Chung Changa,
Chia-Chi Liua,
Tai-Chin Chianga,
Hsin-Chih Huang*ab and
Chen-Hao Wang
 *a
*a
aDepartment of Materials Science and Engineering, National Taiwan University of Science and Technology, Taipei 10607, Taiwan. E-mail: chwang@mail.ntust.edu.tw
bGlobal Development Engineering Program, National Taiwan University of Science and Technology, Taipei 10607, Taiwan. E-mail: hchuang@mail.ntust.edu.tw
First published on 20th March 2020
Abstract
In this study, biomimetic Mg–Nx–Cy from Pachira aquatica leaves were mixed with carbon black (L/C catalyst), in which the mixture was treated by a conventional microwave oven at 700 W and 2 min, exhibiting high catalytic activity for the oxygen reduction reaction (ORR). By using a microwave-assisted process, it not only offers a cheaper and faster way to synthesize the catalyst compared to the conventional furnace process but also avoids the decomposition of the N4-structure. Using the optimized conditions, the L/C catalyst exhibits an electron transfer number of 3.90 and an HO2− yield of only 5% at 0.25 V vs. RHE, which is close to the perfect four electron-transfer pathway. Besides, the L/C catalyst offers superior performance and long-term stability up to 20![[thin space (1/6-em)]](https://www.rsc.org/images/entities/char_2009.gif) 000 s. The L/C catalyst contains a high proportion of quaternary-type nitrogen, Mg–Nx–Cy, and –C–S–C– which can be the active sites for the ORR.
000 s. The L/C catalyst contains a high proportion of quaternary-type nitrogen, Mg–Nx–Cy, and –C–S–C– which can be the active sites for the ORR.
Introduction
Fuel cells, and especially proton exchange membrane fuel cells (PEMFCs) and alkaline anion exchange membrane fuel cells (AAEMFCs), are widely utilized in stationary power plants and transportation power sources. The only product of fuel cells is water, so fuel cells are “eco-friendly” and provide “green energy”. However, fuel cells are expensive because the used catalysts need a large amount of Pt and Pt-alloy. Furthermore, the sluggish kinetics of the oxygen reduction reaction (ORR) at the cathode greatly limits the energy conversion efficiency of fuel cells.1–6 In 1964, Jasinski et al. became the first group to report on the use of a non-precious metal catalyst for the ORR.7 In the subsequent 40 years, more scientists have started to investigate and discover new non-precious metal catalysts.8–12 In the last decade, Dodelet's group had developed a metal–organic-framework-derived electrocatalyst for the ORR, which exhibited a high power performance.13,14 With the improved mass-transfer properties, the volumetric activity is further enhanced. Zelenay's group had developed non-precious metal catalysts of the ORR derived from polyaniline–metal-carbon with long-term stability and high activity.15,16 The uniform distribution of nitrogen sites and the presence of the graphitized carbon phase play a role in activity for the ORR. Additionally, due to the electron density of the low-symmetry N4 structure being high, it may interact with O2 easily and strongly. These kinds of low-symmetry N4 structures have been utilized as non-precious metal catalysts with high output performance,17–19 as well.Recently, transition metal-based compounds, such as oxides, sulfides, and nitrides, have been used as catalysts or supports for electrocatalytic applications.20–22 Dai's group examined cobalt oxide-based nanocrystals on graphene or carbon nanotubes as non-precious metal catalysts in alkaline media.23–25 With the strongly coupled property, the electrocatalysts exhibited good ORR activity. Wang et al. used Fe3+ doped Co3O4 to form the octahedral Co–Fe spinel oxides and grew it on N-doped carbon nanotubes as a bifunctional electrode for zinc–air batteries.26 According to the structural characterization and theoretical calculation, the obtained catalyst had the effect of spin and charge, resulting in the enhanced oxygen catalytic activity. Additionally, transition metal catalyst-based materials as a non-precious metal catalyst in AAEMFC have been developed in our previous studies. With the effects of the nanostructure, heteroatoms doping, and surface property, the non-precious metal catalysts showed remarkable ORR activity.27–31 However, there are lots of preparation methods involved in toxic solvents. Waste biomass contains a high amount of carbon, oxygen and nitrogen elements, and it can be used as an inexpensive precursor of carbon to lower down the environmental impact of the procedure. Natural leaves are one of the biomass-derived materials which contain the inherent chlorophyll; the central structure is Mg–N4, one of the N4-macrocyclic structures. Hence, scientists try to use waste leaves as the non-precious metal catalysts for ORR. Ginkgo leaves were used as precursors to fabricate non-precious metal catalysts by the pyrolysis and acid leaching; Pan et al. were synthesized nitrogen-doped porous carbon nanosheets by carbonization of ginkgo leaves and then followed by ammonia post-treatment which exhibited high surface area and excellent ORR performance;32 Gao et al. presented nitrogen-doped carbon shell structure for ORR and the experimental result was consistent with the quantum mechanics calculations. Additionally, the fullerene-like carbon shell was also used for lithium-ion batteries;33 Razmjooei et al. prepared a porous network carbon catalyst with multi heteroatom-doping, not only yellowish but also greenish ginkgo leaves were compared the activity of ORR. Based on the original property, the yellow leaves could maintain a more stable structure than the green one, resulting in the superior surface properties and catalytic activity.34 On the other hand, Gao et al. also used amaranthus waste to synthesize nitrogen-doped carbon catalyst, which showed superior surface area, conductivity, and ORR performance.35 London plane leaves,36 bamboo leaves,37 and Euonymus japonicus leaves38 were also used to prepare nitrogen-doped porous carbons as electrocatalysts for ORR.
In this work, Pachira aquatica leaves are utilized as precursors, because the inherent chlorophyll is known to possess an N4-macrocyclic structure. To overcome the time-consuming of the traditional furnace for pyrolysis, a microwave oven replaces the traditional furnace to pyrolyze the leaves quickly without decomposing the N4-macrocyclic structure. The microwave oven has the advantages of non-toxic, fast, simple, and cheap which is beneficial to the process. Also, Pachira aquatica leaves are taken from natural and zero cost, which are biomass-derived eco-friendly catalysts for the fuel cell.
Experimental
Preparation of catalysts
Pachira aquatica leaves (the courtyard of our department) and carbon black (XC-72R) mixtures were immersed in 10 mL ethanol (96%, technical, Acros) and agitated for 30 min using an ultrasonicator. This is followed by removing the solvent using a rotary evaporator (Eyela, N1100). The mixture was put in a crucible, which was then placed in a conventional microwave oven (Panasonic, ST557). The powers of the microwave oven and treatment times were varied as required. The powers were set to the medium value of 700 W and a medium-low value of 400 W.To prepare the pyrolyzed leaves that were mixed with carbon support (L/C catalyst), the leaves were washed several times using DI water and introduced into a juicer machine. 300 mg of mashed leaves were mixed with 200 mg of XC-72R and 10 mL of ethanol, to form L/C mash. Rotary evaporator removed the residual solvent from the L/C mash. The dry L/C mash was then placed in the microwave oven on two powers, 400 W and 700 W, for three treatment times, 1, 2, and 3 min, to yield the L/C catalysts. The L/C catalysts are denoted as L/C catalyst-700 W-1 min, L/C catalyst-700 W-2 min, L/C catalyst-700 W-3 min, L/C catalyst-400 W-1 min, and L/C catalyst-400 W-2 min.
X-ray diffraction (XRD)
High-resolution X-ray diffraction (XRD) spectra were obtained at room temperature using beamline 01C2 (at the National Synchrotron Radiation Research Center, Hsinchu, Taiwan) with Mo Kα1 radiation (λ = 0.70930 Å) and an energy of 25 keV in a limited range of angles. The 2θ scans were carried out at a scan rate of 10° per minute, in steps of 0.05° from 5° to 45°. All XRD spectra in this work were referenced to Cu Kα1 radiation (λ = 1.54056 Å).Raman spectroscopy
Raman spectroscopy, a He–Ne laser (wavelength: 632.8 nm, Jobin-Yvon LabRAM HR800-Confocal micro-Raman spectroscopy) as the excitation source, was carried out to identify the D- and G-peaks.X-ray photoelectron spectroscopy (XPS)
The XPS were obtained at an end station at NSRRC beamline BL24A1. The photoemission spectra were collected using an analyzer (SPECS PHOIBOS 150). The grating enabled the photon energy to vary from 240 to 840 eV, with a substantial proportion of high-order harmonics. All XPS spectra were obtained using photons with an energy of 700 eV.Electrochemical measurements and preparation of catalyst ink
Electrochemical measurements of a three-compartment cell were made using a potentiostat/galvanostat instrument (Biologic Bi-stat). The counter electrode and the reference electrode were a piece of Pt foil and a saturated calomel electrode (0.242 V vs. NHE), respectively. The working electrode was a rotating-ring disk electrode (RRDE, PINE AFE7R9GCPT) comprised of glassy carbon (GC) disk and a platinum ring. Here, the area of GC disk is 0.238 cm2 and the collection efficiency (N) of the ring is 0.383. All potentials in this work were referenced to the reversible hydrogen electrode (RHE). An oxygen-saturated 0.1 M KOH solution was used as the electrolyte in the ORR test.L/C catalyst ink was prepared by mixing 80 mg of L/C catalyst with 20 mL deionized water. 20 μL of this L/C catalyst ink and 5 μL of 0.1 wt% FAA ionomer (fumion® FAA-3 solution in NMP, FuMA-Tech) were dropped onto the GC disk, which was then left to dry in air at room temperature. Linear scan voltammetry (LSV) was applied to carry out on the catalysts for the ORR. The ORR curves at the GC disk were obtained at a low scan rate of 10 mV s−1 to reduce the otherwise substantial non-faradaic current to be generated by the catalysts. To determine the yield of HO2− in the ORR that was produced on the GC disk, 1.2 V was applied to the ring to generate a current that oxidized the HO2−. For comparison, 20 wt% Pt/C was prepared by dispersing 20 mg of Pt/C in 20 mL of DI water to form a Pt/C catalyst ink. 20 μL of thus Pt/C catalyst ink and 5 μL of 0.1 wt% FAA ionomer were dropped onto the GC disk, which was then left to dry in air at room temperature.
Results and discussion
The pathway of the ORR in alkaline media is as follows.| Reaction 1: O2 + 2H2O + 4e− → 4OH− E0 = 0.401 V |
| Reaction 2: O2 + H2O + 2e− → HO2− + OH− E0 = −0.065 V |
| Reaction 3: HO2− + H2O + 2e− → 3OH− E0 = 0.867 V |
Reaction 1 represents a four-electron transfer, which proceeds by a direct pathway, in which oxygen is directly reduced to water. Reaction 2 proceeds by a two-electron transfer pathway, which allows the formation of an HO2− intermediate, and chemically decomposed or electrochemically reduced to peroxide ions by Reaction 3. Fig. 1a plots the ORR curves of the various L/C catalysts using the RRDE method. The lower part plots the disk current density (Id) while the upper part plots the ring current (Ir). To verify the ORR activity of the catalyst, the electron transfer number (n value) and the HO2− yield (% HO2−) are calculated using eqn (1) and (2), respectively,
 | (1) |
 | (2) |
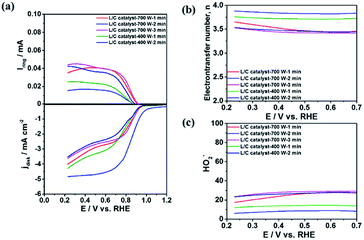 | ||
| Fig. 1 (a) The ORR curves; (b) electron transfer number; (c) HO2− the yield of L/C catalysts with various powers and times. Scan rate: 10 mV s−1; rotation speed: 1600 rpm. | ||
To compare the ORR activity of L/C catalysts, Fig. 2 plots the ORR curves of Pt/C, carbon black that had been treated with 700 W for 2 min (XC-72R-700 W 2 min), pristine leaves that had been treated by 700 W for 2 min (Leaves-700 W-2 min) and L/C catalyst-700 W-2 min. Table 1 lists the calculated electron transfer numbers and the corresponding HO2− yields of various catalysts from Fig. 2. The ORR activity decreases in the order of Pt/C, L/C catalyst-700 W-2 min, Leaves-700 W-2 min, and XC-72R-700 W-2 min, with electron-transfer numbers of 3.99, 3.90, 3.77, and 2.21, respectively, revealing that carbon black improves the ORR activity of the L/C catalyst because it improves the conductivity.
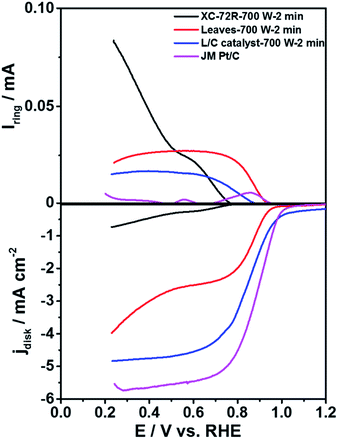 | ||
| Fig. 2 The ORR curves of various catalysts in 0.1 M KOH. Scan rate: 10 mV s−1; rotation speed: 1600 rpm. | ||
| Samples | Electron transfer numbers | HO2− yields |
|---|---|---|
| XC-72R-700 W-2 min | 2.21 | 89.5% |
| Leaves-700 W-2 min | 3.77 | 11.5% |
| L/C catalyst-700 W-2 min | 3.90 | 5.0% |
| JM Pt/C | 3.99 | 0.5% |
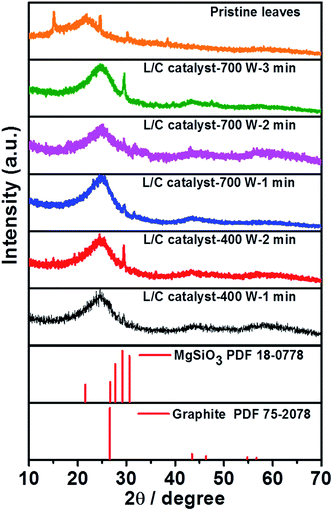
Fig. 3 plots the XRD results for the L/C catalysts. The XRD pattern of the pristine leaves is similar to that obtained by the works of Bajpai and Jain.39 According to their description, the chemical composition of the green tea leaves majorly consists of cellulose, lignin and structure proteins, insoluble proteins, and polyphenols. Several peaks are corresponding to its which locate at approximately 15.0°, 21.9°, 24.4°, 30.0°, and 37.9°, respectively. Moreover, the peak at 29.1° is associated with MgSiO3 and that at 26.4° is associated with the carbon material. When increasing the pyrolysis time, the MgSiO3 peak becomes stronger. It only shows the strongest peak of (221) plane at 29.1° without the peaks of (0–21) plane and (−201) plane at 27.7° and 30.6°, respectively. This might be due to the preferential orientation of the catalyst. The peak of graphite slightly downshifts to 26.7°, which can be associated with the increase of the vertical and lateral sizes of graphitic crystallites, as determined by Ungar et al.40 Table 2 presents the intensity ratio of MgSiO3 to C. The microwave power of 700 W yields IMgSiO3/IC ratios of 1.18, 1.13, and 1.99 after 1, 2, and 3 min, respectively. The microwave power of 400 W yields IMgSiO3/ICratios of 1.16 and 1.53 after 1 min and 2 min, respectively. MgSiO3 is a kind of minerals that has a lower conductivity than carbon, so L/C catalyst-700 W-3 min and L/C catalyst-400 W-2 min have a high IMgSiO3/IC ratio, and exhibit poor ORR activities. However, this result is insufficient to explain why the best ORR activity in 700 W-2 min. Thus, Raman spectra and XPS spectra provide more information.
| Samples | IMgSiO3/IC |
|---|---|
| L/C catalyst-700 W-1 min | 1.18 |
| L/C catalyst-700 W-2 min | 1.13 |
| L/C catalyst-700 W-3 min | 1.99 |
| L/C catalyst-400 W-1 min | 1.16 |
| L/C catalyst-400 W-2 min | 1.53 |
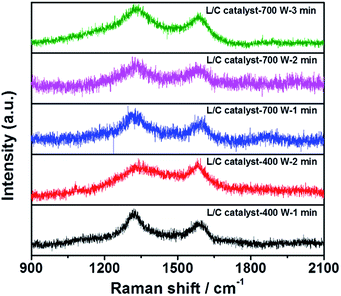
The Raman spectra of all samples in Fig. 4 include two peaks at 1350 cm−1 and 1580 cm−1, which are the D-peak and the G-peak, respectively. The D-peak arises from the disordered structure and, in particular, the disorder of the sp2 hybridized carbon system in a carbon-based material. The high ratio of the D-peak reflects the poor electrical conductivity. The G-peak is associated with the E2g mode in carbon-based materials, arising from the stretching of the C–C bond, which involves sp3 stretching. A high IG/ID ratio is associated with the high electrical conductivity of the catalyst. Table 3 presents the IG/ID ratios of all samples: L/C catalyst-700 W-2 min has the highest IG/ID ratio, followed by L/C catalyst-400 W-1 min and others. Higher ORR activity seems to be associated with a higher IG/ID ratio among the L/C catalysts.
| Samples | IG/ID |
|---|---|
| L/C catalyst-700 W-1 min | 0.59 |
| L/C catalyst-700 W-2 min | 0.67 |
| L/C catalyst-700 W-3 min | 0.32 |
| L/C catalyst-400 W-1 min | 0.61 |
| L/C catalyst-400 W-2 min | 0.48 |
XPS spectra are obtained to elucidate the chemical compositions of L/C catalysts. All samples contain six main elements, which were O, C, Si, Mg, N, and S, as shown in the survey pattern of Fig. 5a. According to other investigations, N and S, when co-doped in catalysts, can provide active sites for the ORR.41–43 In L/C catalyst-700 W-2 min, the N and S proportions are 16.8% and 4.34%, respectively, which is the highest among all of the catalysts herein, and this catalyst, therefore, exhibits the best ORR activity. The carbon–nitrogen structure is an important factor that influences ORR activity.44 Table 4 presents the results of the convolution of the XPS peaks in Fig. 5b–f, which can be divided into components associated with quaternary-type nitrogen (401.4 eV), pyrrolic-type nitrogen (400.3 eV), and cyanide-type nitrogen (399.3 eV). This table demonstrates that the proportion of quaternary-type nitrogen of L/C catalyst-700 W-2 min is 36.1%, which exceeds those in the other samples. Wu et al. reported that quaternary-type nitrogen increased ORR activity.16 Deak et al. found that a high ORR activity depended on a high proportion of quaternary-type nitrogen or graphitic-type nitrogen.45 Moreover, S is doped in the catalyst strongly affects ORR activity, as determined by Park et al.43,46–48 In this work, L/C catalyst-700 W-2 min presents the most S content among other samples.
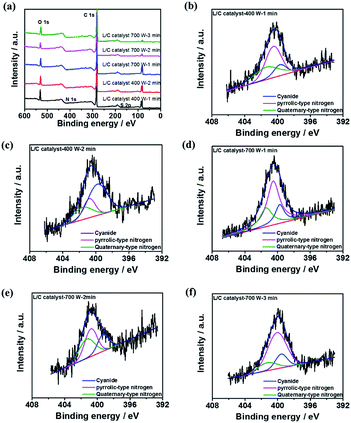 | ||
| Fig. 5 The XPS results of (a) all samples' survey pattern; N 1s spectra of L/C catalysts at: (b) 400 W-1 min, (c) 400 W-2 min, (d) 700 W-1 min, (e) 700 W-2 min, (f) 700 W-3 min. | ||
| Samples | Quaternary-type nitrogen (401.4 eV) | Pyrrolic-type nitrogen (400.3 eV) | Cyanide (399.3 eV) |
|---|---|---|---|
| L/C catalyst-400 W-1 min | 35.6 | 48.9 | 21.8 |
| L/C catalyst-400 W-2 min | 21.9 | 56.3 | 19.5 |
| L/C catalyst-700 W-1 min | 24.6 | 57.2 | 18.2 |
| L/C catalyst-700 W-2 min | 36.1 | 41.2 | 22.7 |
| L/C catalyst-700 W-3 min | 15.2 | 68.2 | 18.2 |
Besides, the Mg–Nx–Cy structure can be associated with the activity of ORR. It also can be demonstrated by XPS analysis. Here, Fig. 6a to e show the deconvolution of XPS in Mg 2p. It denotes the area ratios of Mg–Nx–Cy and MgSiO3. The results can be summarized in Table 5. It indicates the highest ratio of Mg–Nx–Cy in L/C catalyst-700 W-2 min among other catalysts. It means that most amount of Nx-structure is kept and is not destroyed by microwave-assisted in this power and treated time. The N4 structure is destroyed and converted to MgSiO3 by high power and long-time treatment. However, the 700 W-3 min has the lowest ratio of Mg–Nx–Cy.
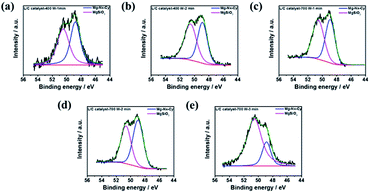 | ||
| Fig. 6 The XPS results of Mg 2p spectra of L/C catalysts at: (a) 400 W-1 min, (b) 400 W-2 min, (c) 700 W-1 min, (d) 700 W-2 min, (e) 700 W-3 min. | ||
| Samples | Mg–Nx–Cy (48.9 eV) | MgSiO3 (50.4 eV) |
|---|---|---|
| L/C catalyst-400 W-1 min | 50.4 | 49.6 |
| L/C catalyst-400 W-2 min | 46.9 | 53.1 |
| L/C catalyst-700 W-1 min | 47.2 | 52.8 |
| L/C catalyst-700 W-2 min | 54.9 | 45.1 |
| L/C catalyst-700 W-3 min | 22.1 | 77.9 |
The results are consistent with XRD, which is shown in Fig. 3. The complete Nx-structure has been proved that it can improve the ORR activity from our previous results.17–19,44,49–51 These results can offer powerful evidence to explain why the best ORR activity was observed in L/C catalyst-700 W-2 min.
To discuss the effect of sulfur-containing structure, the XPS S 2p spectra of several L/C catalysts are shown in Fig. 7, in which the deconvolution results are shown in Table 6. L/C catalyst-700 W-2 min almost shows 100% of –C–S–C– but no –C–SOx–C–. Yang et al. reported sulfur-doped graphene has good oxygen reduction activity because of sulfur-doped carbon materials, breaking the electroneutrality of graphitic materials owing to the different electroneutrality between carbon and the dopant would create favorable positive charged sites for the side-on O2 surface adsorption. This parallel diatomic adsorption could effectively weaken the O–O bonding and facilitate the direct reduction of oxygen to OH− via a four-electron process.52 Moreover, Wang et al. indicated the cell performance improvement of Fe/N/C after doping of S. The –C–S–C– enhance the ORR activity sites of the catalyst.53 Li et al. mentioned that –C–SOx–C– is inactive for ORR but –C–S–C– not only enhances the ORR activity but also improves the ORR stability of the catalyst.54 Moreover, –C–SOx–C– inhibits the ability of ORR in the catalyst. According to these reasons, it can be explained why L/C catalyst-700 W-2 min shows the excellent ORR ability than other conditions due to the highest ratio –C–S–C– structure.
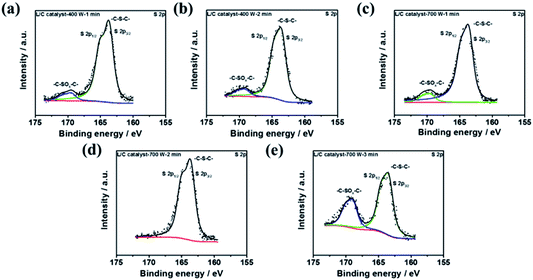 | ||
| Fig. 7 The XPS results of S 2p spectra of L/C catalysts at: (a) 400 W-1 min, (b) 400 W-2 min, (c) 700 W-1 min, (d) 700 W-2 min, (e) 700 W-3 min. | ||
| Samples | –C–S–C– (163.8 eV) | –C–SOx–C– (167.5–171.5 eV) |
|---|---|---|
| L/C catalyst-400 W-1 min | 95.3 | 4.7 |
| L/C catalyst-400 W-2 min | 85.8 | 14.2 |
| L/C catalyst-700 W-1 min | 87.3 | 13.7 |
| L/C catalyst-700 W-2 min | 100.0 | — |
| L/C catalyst-700 W-3 min | 69.4 | 30.6 |
L/C catalyst-700 W-2 min and Pt/C in the ORR are used for the chronoamperometric measurements at 0.76 V, as shown in Fig. 8. The plots show the current retentions of L/C catalyst-700 W-2 min and Pt/C normalized to the initial current. The L/C catalyst-700 W-2 min almost shows no decay after 20![[thin space (1/6-em)]](https://www.rsc.org/images/entities/char_2009.gif) 000 s – exceeding that of Pt/C. Pt/C is degraded by the blocking effect of the OHads species that are adsorbed on the Pt surface.55 However, the OHads species have almost no effect on L/C catalyst-700 W-2 min, leading to the excellent stability of L/C catalyst-700 W-2 min.
000 s – exceeding that of Pt/C. Pt/C is degraded by the blocking effect of the OHads species that are adsorbed on the Pt surface.55 However, the OHads species have almost no effect on L/C catalyst-700 W-2 min, leading to the excellent stability of L/C catalyst-700 W-2 min.
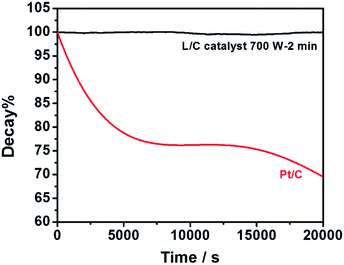 | ||
| Fig. 8 Current retentions of L/C catalyst-700 W-2 min and Pt/C kept by the constant potential of 0.76 V in O2-saturated 0.1 M KOH. | ||
Accordingly, the above electrochemical and structural results are simply demonstrated to elucidate the mechanism of ORR for L/C catalyst. The quaternary-type nitrogen, Mg–Nx–Cy, and –C–S–C– are evaluated to promote the dominant ORR ability.
Conclusions
In this work, microwave treated catalyst composed of Pachira aquatica leaves and carbon black were demonstrated to exhibit high ORR activity. This can be attributed to the combination of the nitrogen-rich Mg–Nx–Cy structure and sulfur-rich containing leaves. XPS, Raman spectra and XRD results show that the ORR activity is related to the constituent elements of the leaves, including N, S, C, and Si. Superior ORR activity and long-term stability depend on high ratios of quaternary-type nitrogen and Mg–Nx–Cy/MgSiO3 and –C–S–C– species which are chiefly responsible for improving the ORR ability. However, the –C–SOx–C– is a species to inhibit ORR activity. The L/C catalyst is produced from natural N4-structure materials for a low-waste and non-toxic process; the microwave-assisted method is used for the cheap, facile, and fast process. The energy thus generated can truly be called “green” energy. In the future, this catalyst shall be modified and improved, enabling it to compete with the performance of Pt.Conflicts of interest
There are no conflicts to declare.Acknowledgements
The authors would like to thank the Ministry of Science and Technology of the Republic of China, Taiwan, for financially supporting this research under Contract No. MOST 104-2628-E-011-003-MY3. National Synchrotron Radiation Research Center, Taiwan, Beamline 24A1 and 01C2 support, is acknowledged.Notes and references
- W. Zhang, R. Wang, H. Wang and Z. Lei, Fuel Cells, 2010, 10, 734–739 CrossRef CAS.
- J.-H. Jang, J. Kim, Y.-H. Lee, I. Y. Kim, M.-H. Park, C.-W. Yang, S.-J. Hwang and Y.-U. Kwon, Energy Environ. Sci., 2011, 4, 4947–4953 RSC.
- A. Morozan, B. Jousselme and S. Palacin, Energy Environ. Sci., 2011, 4, 1238–1254 RSC.
- Y. Cai, C. Ma, Y. M. Zhu, J. X. Wang and R. R. Adzic, Langmuir, 2011, 27, 8540–8547 CrossRef CAS PubMed.
- R. Wang, C. Xu, X. Bi and Y. Ding, Energy Environ. Sci., 2012, 5, 5281–5286 RSC.
- S.-Y. Huang, P. Ganesan and B. N. Popov, ACS Catal., 2012, 2, 825–831 CrossRef CAS.
- R. Jasinski, Nature, 1964, 201, 1212–1213 CrossRef CAS.
- S. Pylypenko, S. Mukherjee, T. S. Olson and P. Atanassov, Electrochim. Acta, 2008, 53, 7875–7883 CrossRef CAS.
- V. Nallathambi, J.-W. Lee, S. P. Kumaraguru, G. Wu and B. N. Popov, J. Power Sources, 2008, 183, 34–42 CrossRef CAS.
- M. Lefevre and J.-P. Dodelet, Electrochim. Acta, 2008, 53, 8269–8276 CrossRef CAS.
- X. Y. Deng, X. Wang and Z. F. F. Ma, J. Power Sources, 2008, 183, 604–608 CrossRef CAS.
- C. W. B. Bezerra, L. Zhang, K. Lee, H. Liu, A. L. B. Marques, E. P. Marques, H. Wang and J. Zhang, Electrochim. Acta, 2008, 53, 4937–4951 CrossRef CAS.
- M. Lefevre, E. Proietti, F. Jaouen and J. P. Dodelet, Science, 2009, 324, 71–74 CrossRef CAS PubMed.
- E. Proietti, F. Jaouen, M. Lefevre, N. Larouche, J. Tian, J. Herranz and J. P. Dodelet, Nat. Commun., 2011, 2, 416 CrossRef PubMed.
- G. Wu, C. M. Johnston, N. H. Mack, K. Artyushkova, M. Ferrandon, M. Nelson, J. S. Lezama-Pacheco, S. D. Conradson, K. L. More, D. J. Myers and P. Zelenay, J. Mater. Chem., 2011, 21, 11392–11405 RSC.
- G. Wu, K. L. More, C. M. Johnston and P. Zelenay, Science, 2011, 332, 443–447 CrossRef CAS PubMed.
- S.-T. Chang, C.-H. Wang, H.-Y. Du, H.-C. Hsu, C.-M. Kang, C.-C. Chen, J. C. S. Wu, S.-C. Yen, W.-F. Huang, L.-C. Chen, M. C. Lin and K.-H. Chen, Energy Environ. Sci., 2012, 5, 5305–5314 RSC.
- H.-C. Huang, I. Shown, S.-T. Chang, H.-C. Hsu, H.-Y. Du, M.-C. Kuo, K.-T. Wong, S.-F. Wang, C.-H. Wang, L.-C. Chen and K.-H. Chen, Adv. Funct. Mater., 2012, 22, 3500–3508 CrossRef CAS.
- H.-C. Huang, C.-H. Wang, I. Shown, S.-T. Chang, H.-C. Hsu, H.-Y. Du, L.-C. Chen and K.-H. Chen, J. Mater. Chem. A, 2013, 1, 14692–14699 RSC.
- H. Su, X.-T. Wang, J.-X. Hu, T. Ouyang, K. Xiao and Z.-Q. Liu, J. Mater. Chem. A, 2019, 7, 22307–22313 RSC.
- H. Zhang, J. He, C. Zhai and M. Zhu, Chin. Chem. Lett., 2019, 30, 2338–2342 CrossRef CAS.
- Y. Yuan, J. Wang, S. Adimi, H. Shen, T. Thomas, R. Ma, J. P. Attfield and M. Yang, Nat. Mater., 2020, 19, 282–286 CrossRef CAS PubMed.
- Y. Y. Liang, Y. G. Li, H. L. Wang, J. G. Zhou, J. Wang, T. Regier and H. J. Dai, Nat. Mater., 2011, 10, 780–786 CrossRef CAS PubMed.
- Y. Y. Liang, H. L. Wang, J. G. Zhou, Y. G. Li, J. Wang, T. Regier and H. J. Dai, J. Am. Chem. Soc., 2012, 134, 3517–3523 CrossRef CAS PubMed.
- Y. Y. Liang, H. L. Wang, P. Diao, W. Chang, G. S. Hong, Y. G. Li, M. Gong, L. M. Xie, J. G. Zhou, J. Wang, T. Z. Regier, F. Wei and H. J. Dai, J. Am. Chem. Soc., 2012, 134, 15849–15857 CrossRef CAS PubMed.
- X.-T. Wang, T. Ouyang, L. Wang, J.-H. Zhong, T. Ma and Z.-Q. Liu, Angew. Chem., Int. Ed., 2019, 58, 13291–13296 CrossRef CAS PubMed.
- C.-H. Wang, C.-W. Yang, Y.-C. Lin, S.-T. Chang and S. L. Y. Chang, J. Power Sources, 2015, 277, 147–154 CrossRef CAS.
- H.-C. Huang, Y.-C. Lin, S.-T. Chang, C.-C. Liu, K.-C. Wang, H.-P. Jhong, J.-F. Lee and C.-H. Wang, J. Mater. Chem. A, 2017, 5, 19790–19799 RSC.
- H.-C. Huang, C.-Y. Su, K.-C. Wang, H.-Y. Chen, Y.-C. Chang, Y.-L. Chen, K. C. W. Wu and C.-H. Wang, ACS Sustainable Chem. Eng., 2019, 7, 3185–3194 CrossRef CAS.
- H.-P. Jhong, S.-T. Chang, H.-C. Huang, K.-C. Wang, J.-F. Lee, M. Yasuzawa and C.-H. Wang, Catal. Sci. Technol., 2019, 9, 3426–3434 RSC.
- K.-C. Wang, H.-C. Huang, S.-T. Chang, C.-H. Wu, I. Yamanaka, J.-F. Lee and C.-H. Wang, ACS Sustainable Chem. Eng., 2019, 7, 9143–9152 CrossRef CAS.
- F. Pan, Z. Cao, Q. Zhao, H. Liang and J. Zhang, J. Power Sources, 2014, 272, 8–15 CrossRef CAS.
- S. Gao, X. Wei, H. Fan, L. Li, K. Geng and J. Wang, Nano Energy, 2015, 13, 518–526 CrossRef CAS.
- F. Razmjooei, K. P. Singh and J.-S. Yu, Catal. Today, 2016, 260, 148–157 CrossRef CAS.
- S. Gao, K. Geng, H. Liu, X. Wei, M. Zhang, P. Wang and J. Wang, Energy Environ. Sci., 2015, 8, 221–229 RSC.
- B. Zhu, K. Qiu, C. Shang and Z. Guo, J. Mater. Chem. A, 2015, 3, 5212–5222 RSC.
- L. Y. Zhang, Z. Zhou, Z. Liu and C. M. Li, ChemElectroChem, 2016, 3, 1466–1470 CrossRef CAS.
- Y. Huang, D. Wu, D. Cao and D. Cheng, Int. J. Hydrogen Energy, 2018, 43, 8611–8622 CrossRef CAS.
- S. K. Bajpai and A. Jain, Water, 2012, 4, 52–71 Search PubMed.
- T. Ungar, J. Gubicza, G. Ribarik, C. Pantea and T. W. Zerda, Carbon, 2002, 40, 929–937 CrossRef CAS.
- C. You, S. Liao, H. Li, S. Hou, H. Peng, X. Zeng, F. Liu, R. Zheng, Z. Fu and Y. Li, Carbon, 2014, 69, 294–301 CrossRef CAS.
- L. Xu, G. Pan and X. Liang, RSC Adv., 2014, 4, 19756–19765 RSC.
- J. P. Chu, T.-Y. Liu, C.-L. Li, C.-H. Wang, J. S. C. Jang, M.-J. Chen, S.-H. Chang and W.-C. Huang, Thin Solid Films, 2014, 561, 102–107 CrossRef CAS.
- S.-T. Chang, H.-C. Huang, H.-C. Wang, H.-C. Hsu, J.-F. Lee and C.-H. Wang, Int. J. Hydrogen Energy, 2014, 39, 934–941 CrossRef CAS.
- D. von Deak, D. Singh, E. J. Biddinger, J. C. King, B. Bayram, J. T. Miller and U. S. Ozkan, J. Catal., 2012, 285, 145–151 CrossRef CAS.
- L. Xu, G. Pan, X. Liang, G. Luo, C. Zou and G. Chen, J. Energy Chem., 2014, 23, 498–506 CrossRef.
- J. E. Park, Y. J. Jang, Y. J. Kim, M. S. Song, S. Yoon, D. H. Kim and S. J. Kim, Phys. Chem. Chem. Phys., 2014, 16, 103–109 RSC.
- S. Inamdar, H.-S. Choi, P. Wang, M. Y. Song and J.-S. Yu, Electrochem. Commun., 2013, 30, 9–12 CrossRef CAS.
- C.-H. Wang, H.-C. Huang, S.-T. Chang, Y.-C. Lin and M.-F. Huang, RSC Adv., 2014, 4, 4207–4211 RSC.
- S.-T. Chang, H.-C. Hsu, H.-C. Huang, C.-H. Wang, H.-Y. Du, L.-C. Chen, J.-F. Lee and K.-H. Chen, Int. J. Hydrogen Energy, 2012, 37, 13755–13762 CrossRef CAS.
- C.-H. Wang, S.-T. Chang, H.-C. Hsu, H.-Y. Du, J. C.-S. Wu, L.-C. Chen and K.-H. Chen, Diamond Relat. Mater., 2011, 20, 322–329 CrossRef CAS.
- Z. Yang, Z. Yao, G. Li, G. Fang, H. Nie, Z. Liu, X. Zhou, X. a. Chen and S. Huang, ACS Nano, 2012, 6, 205–211 CrossRef CAS PubMed.
- Y. C. Wang, Y. J. Lai, L. Song, Z. Y. Zhou, J. G. Liu, Q. Wang, X. D. Yang, C. Chen, W. Shi, Y. P. Zheng, M. Rauf and S. G. Sun, Angew. Chem., 2015, 54, 9907–9910 CrossRef CAS PubMed.
- J. S. Li, S. L. Li, Y. J. Tang, K. Li, L. Zhou, N. Kong, Y. Q. Lan, J. C. Bao and Z. H. Dai, Sci. Rep., 2014, 4, 5130 CrossRef CAS PubMed.
- N. Ramaswamy and S. Mukerjee, Adv. Phys. Chem., 2012, 2012, 491604 Search PubMed.
| This journal is © The Royal Society of Chemistry 2020 |

