 Open Access Article
Highly selective conversion of CO2 to methanol on the CuZnO–ZrO2 solid solution with the assistance of plasma
Fennv
Han
 a,
Huaiping
Liu
b,
Wenqiang
Cheng
a and
Qi
Xu
*ac
aSchool of Chemistry and Chemical Engineering, Yancheng Institute of Technology, Yancheng 224051, PR China. E-mail: ycxqsteve@163.com; Fax: +86-515-88298655; Tel: +86-515-88298655
bKunYue Interconnection Environmental Technology (JiangSu) Co., LTD, Yancheng 224051, PR China
cKey Laboratory under Construction for Volatile Organic Compounds Controlling of Jiangsu Province, Yancheng 224051, PR China
First published on 11th September 2020
Abstract
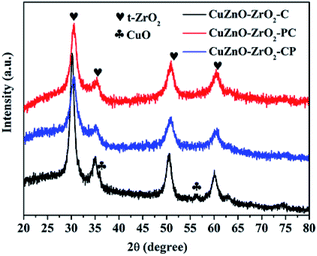
CuZnO–ZrO2–C was prepared by a co-precipitation method. For comparison, CuZnO–ZrO2–PC and CuZnO–ZrO2–CP were prepared by glow discharge plasma. The catalysts were characterized via the XRD, N2 adsorption–desorption, TEM, SEM, EDS, XPS, CO2-TPD and H2-TPR techniques. The catalysts were comparatively investigated for CO2 conversion and methanol selectivity in a fixed-bed reactor under the condition of 2 MPa, 250 °C, H2/CO2 = 3/1 and GHSV = 12![[thin space (1/6-em)]](https://www.rsc.org/images/entities/char_2009.gif) 000 mL g−1 h−1. The results showed that the activities of the catalysts increased in the order of CuZnO–ZrO2–PC > CuZnO–ZrO2–CP > CuZnO–ZrO2–C. Moreover, the CO2 conversion of CuZnO–ZrO2–C increased by 38.9% via treatment with glow discharge plasma. The results are well explained based on the CO2-TPD and H2-TPR characterizations of the catalysts.
000 mL g−1 h−1. The results showed that the activities of the catalysts increased in the order of CuZnO–ZrO2–PC > CuZnO–ZrO2–CP > CuZnO–ZrO2–C. Moreover, the CO2 conversion of CuZnO–ZrO2–C increased by 38.9% via treatment with glow discharge plasma. The results are well explained based on the CO2-TPD and H2-TPR characterizations of the catalysts.
1. Introduction
The excessive consumption of fossil fuels leads to the increase in atmospheric CO2 concentration. CO2 is one of the main greenhouse gases, which causes the global temperature to rise more seriously. Therefore, conversion of CO2 into value-added chemicals has attracted extensive attention of the researchers.1–4 As an excellent C1 resource, CO2 is often used to prepare high value-added chemicals, such as methane, methanol, formic acid, and so on.Methanol from CO2 hydrogenation is one of the most important means of utilization of CO2 resource. Methanol is an important raw material for the synthesis of organic chemicals and can be used to synthesize formaldehyde and other chemical products.5–7 Methanol is also a type of clean fuel, which can be blended into or substituted for gasoline as automobile fuels. Actually, the use of methanol has already been established for different applications such as in cars and fuel cells. In the 1960s, commercial Cu/ZnO/Al2O3 catalysts were used in the production of industrial methanol at operating temperatures of 240–260 °C and reaction pressures of 5–10 MPa. However, at present, the selectivity of copper-based catalysts towards the methanol production from CO2 hydrogenation is low. Therefore, it is urgent to either improve copper-based catalysts or develop new catalysts. Consequently, the research on the process route of methanol production from CO2 hydrogenation is focused on the catalysts. Some studies have shown that conversion of CO2 to methanol reaction is a structure-sensitive reaction. Besides, different preparation methods of catalysts lead to different structures of catalysts, thus affecting the activity of catalysts.8,9 The Cu/ZnO catalytic system is the basic copper-based catalyst, wherein zinc oxide can improve the dispersion and stability of copper, and lattice oxygen vacancies and paired electrons in zinc oxide can promote the methanol synthesis. Other catalysts, such as Cu/ZnO/SiO2, Cu/ZnO/ZrO2, Cu/ZnO/Al2O3 and Cu/ZnO/TiO2, are generally modified on this basis. ZrO2 is considered as a good carrier of Cu/ZnO as it provides active sites for CO and CO2 for the insertion into Zr–OH, and Cu provides active hydrogen for ZrO2 to hydrogenate formate and hydroxycarbonate to methanol on the ZrO2 surface. Simultaneously, the addition of ZrO2 can also improve the dispersion of active component copper. Moreover, ZrO2 has low hydrophilicity, which can promote the catalytic activity.
Low temperature plasma is also widely used in the field of catalysis, including for catalysts used to synthesize ultrafine particles, surface treatment of catalysts and regeneration of catalysts. Catalysts prepared by a low temperature plasma-assisted synthesis generally have the advantages such as high dispersion, small catalyst particle size, large specific surface area and lattice defects. Bagherzadeh10et al. prepared CuO/ZnO/Al2O3 nanocatalysts by a hydrothermal synthesis and coprecipitation method, and then exposed to glow discharge plasma for 45 min at 1000 V. The results showed that the methanol conversion of CuO/ZnO/Al2O3 catalysts synthesized by plasma-assisted coprecipitation was the highest. Seyedi11et al. synthesised a series of CuO–ZnO–Al2O3–ZrO2 nanocatalysts via hydrothermal, thermo-chemical and coprecipitation-plasma methods. The results showed that the catalysts treated by argon glow discharge plasma had a smaller particle size, better dispersibility and larger specific surface area, which could improve the hydrogen yield and methanol conversion.
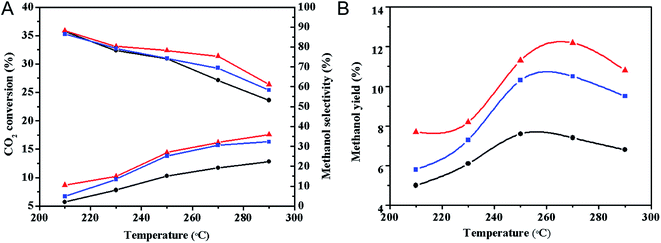
In this study, CuZnO–ZrO2 catalysts were prepared via the plasma-assisted coprecipitation method. The catalysts were characterized and analyzed via the XRD, Nitrogen physical adsorption, TEM, XPS and H2-TPR techniques. The methanol synthesis performance of the catalysts before and after the glow discharge plasma modification was studied. The effects of the reaction temperature and stability of the catalyst were also investigated.
2. Experimental section
2.1 Preparation of catalysts
A mixed solution of metal nitrate was prepared by completely dissolving Zn(NO3)2·6H2O, Zr(NO3)4·5H2O and Cu(NO3)2·3H2O (Cu/Zn/Zr = 1/4/15) in deionized water. The solution with metal nitrates and 0.5 mol L−1 Na2CO3 solution were added into a reaction vessel at 70 °C. The final pH of titration was about 7.5. After the titration, the solution was stirred at 70 °C for 1 h, followed by ageing for 3 h. After cooling to room temperature, the solution was centrifuged and the precipitate was washed three times with deionized water to remove Na+ ions. The precipitate was dried in a vacuum drying chamber for 12 h to obtain the catalyst precursor.The sample was then calcined in muffle furnace at 500 °C for 3 h and was denoted as CuZnO–ZrO2–C. This sample of the catalyst precursor was treated with a glow discharge plasma equipment for 15 min and roasted for 3 h in a muffle furnace at 500 °C and was denoted as CuZnO–ZrO2–PC. Similarly, the sample of the catalyst precursor calcined in the muffle furnace at 500 °C for 3 h and then treated by plasma for 15 min and was denoted as CuZnO–ZrO2–CP.
2.2 Characterization techniques
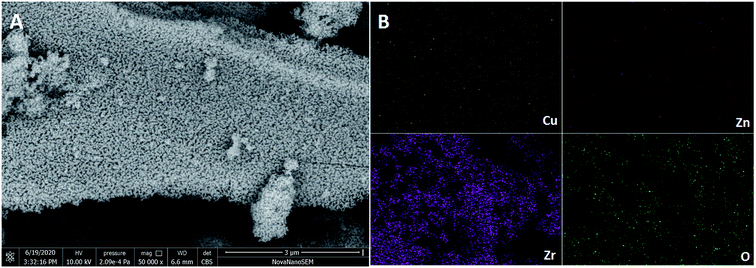
The XRD patterns of the catalysts were obtained at room temperature on a PANalytical X'Pert Pro X-ray diffractometer at 40 kV and 40 mA over 20° to 80° 2θ range with Cu Kα radiation (λ = 0.15416 nm). N2 adsorption–desorption isotherms for the catalysts were recorded on a Beckman coulter SA 3100 type specific surface area and aperture measurement instrument at −196 °C. The size distribution of micropores was determined using the Horvarth–Kawazoe(H–K) equation. The surface areas of the catalysts were calculated by the Brunauer–Emmett–Teller (BET) method. Transmission Electron Microscopy (TEM) images were recorded on a JEOL JEM-2100F TEM instrument at an accelerating voltage of 200 kV. The morphology of the catalyst was analyzed via scanning electron microscopy (SEM 450, Nova nano, Japan). The elemental chemical states of the samples were analyzed via X-ray photoelectron spectroscopy (XPS) using a Thermo Scientific Escalab 250Xi X-ray spectrometer with binding energy corrected by C 1s (284.8 eV). The basicity of the catalyst was measured by temperature-programmed desorption of CO2 (CO2-TPD) techniques on an AutoChem II 2910 instrument (Micromeritics, USA). The reduction behavior of the catalysts was studied via hydrogen programmed temperature-reduction (H2-TPR) using a Micromeritics AutoChemII 2920 instrument equipped with a thermal conductivity detector (TCD).2.3 Photocatalytic conversion of CO2
The photocatalytic conversion of CO2 to methanol was performed in an HP-WF51 fixed bed reactor (the inner diameter of a stainless steel reaction tube was 10 mm). Typically, 0.5 g of each catalyst (40–80 mesh) diluted with 0.5 g quartz sands was pre-treated at a pressure of 0.2 MPa in a flow of 50% H2/N2 stream (20 mL min−1) at 280 °C for 4 h. Then, syngas (V(H2)![[thin space (1/6-em)]](https://www.rsc.org/images/entities/char_2009.gif) :
:![[thin space (1/6-em)]](https://www.rsc.org/images/entities/char_2009.gif) V(CO2)
V(CO2)![[thin space (1/6-em)]](https://www.rsc.org/images/entities/char_2009.gif) :
:![[thin space (1/6-em)]](https://www.rsc.org/images/entities/char_2009.gif) V(N2) = 72
V(N2) = 72![[thin space (1/6-em)]](https://www.rsc.org/images/entities/char_2009.gif) :
:![[thin space (1/6-em)]](https://www.rsc.org/images/entities/char_2009.gif) 24
24![[thin space (1/6-em)]](https://www.rsc.org/images/entities/char_2009.gif) :
:![[thin space (1/6-em)]](https://www.rsc.org/images/entities/char_2009.gif) 4) was applied, and the reaction was began with the desired reaction parameters.
4) was applied, and the reaction was began with the desired reaction parameters.
CO2, N2 and CO were analyzed via gas chromatography (6820, Agilent) with a thermal conductivity detector (TCD) equipped with a TDX-01 carbon molecular sieve column. Methanol and other hydrocarbons were analyzed using a flame ionization detector (FID) equipped with a Porapak Q column.
Conversion of CO2, product selectivity and yield of methanol were calculated by the following eqn (1)–(4).
| X(CO2) = (fCOACO + fCH3OHACH3OH)/(fCOACO + fCH3OHACH3OH + fCO2ACO2) | (1) |
| S(CH3OH) = (fCH3OHACH3OH)/(fCH3OHACH3OH + fCOACO) | (2) |
| S(CO) = fCOACO/(fCOACO + fCH3OHACH3OH) | (3) |
| Y(CH3OH) = X(CO2) × S(CH3OH) | (4) |
3. Results and discussion
3.1 Catalyst characterization
| Specific surface area (m2 g−1) | Pore volume (cm3 g−1) | Mean pore size (nm) | |
|---|---|---|---|
| CuZnO–ZrO2–C | 24.48 | 0.055 | 9.05 |
| CuZnO–ZrO2–PC | 24.57 | 0.035 | 5.98 |
| CuZnO–ZrO2–CP | 25.38 | 0.056 | 8.90 |
 | ||
| Fig. 3 TEM images (A) of CuZnO–ZrO2–C, (B) of CuZnO–ZrO2–PC, (C) of CuZnO–ZrO2–CP. HRTEM images (D) of CuZnO–ZrO2–C, (E) of CuZnO–ZrO2–PC, (F) of CuZnO–ZrO2–CP. | ||
3.2 Catalytic performance
![[thin space (1/6-em)]](https://www.rsc.org/images/entities/char_2009.gif) 000 mL g−1 h−1 are shown in Table 2. Compared with the CuZnO–ZrO2–C catalyst, the CO2 conversion rate of the plasma-treated catalysts significantly increased; the CO2 conversion of CuZnO–ZrO2–PC and CuZnO–ZrO2–CP catalysts increased by 39.8% and 33.9%, respectively, while methanol selectivity changes were not obvious. The results showed that the CO2 conversion over the plasma-modified catalyst significantly increased, and the catalytic activity of the catalyst effectively improved, but the selectivity of methanol did not significantly improve.
000 mL g−1 h−1 are shown in Table 2. Compared with the CuZnO–ZrO2–C catalyst, the CO2 conversion rate of the plasma-treated catalysts significantly increased; the CO2 conversion of CuZnO–ZrO2–PC and CuZnO–ZrO2–CP catalysts increased by 39.8% and 33.9%, respectively, while methanol selectivity changes were not obvious. The results showed that the CO2 conversion over the plasma-modified catalyst significantly increased, and the catalytic activity of the catalyst effectively improved, but the selectivity of methanol did not significantly improve.
| Catalysts | X(CO2)/% | S(CH3OH)/% | S(CO)/% | Y(CH3OH)/% |
|---|---|---|---|---|
a Condition: P = 2 MPa, T = 250 °C, H2/CO2 = 3/1 and GHSV = 12![[thin space (1/6-em)]](https://www.rsc.org/images/entities/char_2009.gif) 000 mL g−1 h−1. 000 mL g−1 h−1.
|
||||
| CuZnO–ZrO2–C | 10.3 | 74.1 | 25.9 | 7.6 |
| CuZnO–ZrO2–PC | 14.4 | 78.2 | 21.8 | 11.3 |
| CuZnO–ZrO2–CP | 13.8 | 74.2 | 25.8 | 10.2 |
![[thin space (1/6-em)]](https://www.rsc.org/images/entities/char_2009.gif) 000 mL g−1 h−1. As shown in Fig. 9, after the catalysts were used in a fixed bed reactor for a long time of 100 h, the CO2 conversion of the CuZnO–ZrO2–C catalyst decreased by 7.8% (from 10.3% to 9.5%), and the methanol selectivity decreased by 5.8% (from 74.1% to 69.8%). However, the CO2 conversion of the CuZnO–ZrO2–PC catalyst decreased by 6.3% (from 14.4% to 13.5%), and the methanol selectivity decreased by 3.8% (from 78.2% to 75.2%).
000 mL g−1 h−1. As shown in Fig. 9, after the catalysts were used in a fixed bed reactor for a long time of 100 h, the CO2 conversion of the CuZnO–ZrO2–C catalyst decreased by 7.8% (from 10.3% to 9.5%), and the methanol selectivity decreased by 5.8% (from 74.1% to 69.8%). However, the CO2 conversion of the CuZnO–ZrO2–PC catalyst decreased by 6.3% (from 14.4% to 13.5%), and the methanol selectivity decreased by 3.8% (from 78.2% to 75.2%).
4. Conclusions
The CuZnO–ZrO2 catalysts were pretreated by the glow discharge plasma before and after calcination. Compared with the CuZnO–ZrO2–C catalyst, the performance of the catalyst modified by plasma was better, the CO2 conversion of CuZnO–ZrO2–PC increased by 39.8%, and the methanol yield increased by 48.7%. The XRD characterization showed that the plasma-modified catalyst had a lower crystallinity and a better dispersion, and the characterization of CO2-TPD and H2-TPR provided a basis for the better catalytic performance of plasma-modified catalysts.Conflicts of interest
There are no conflicts to declare.Acknowledgements
The work was supported by the joint open fund of the Jiangsu Collaborative Innovation Center for Ecological Building Material and Environmental Protection Equipments and Key Laboratory for Advanced Technology in Environmental of Jiangsu Province (No. JH201806).References
- M. Kumar, S. Sundaram and E. Gnansounou, et al., Carbon dioxide capture, storage and production of biofuel and biomaterials by bacteria: a review, Bioresour. Technol., 2018, 247, 1059–1068 CrossRef CAS PubMed.
- L. V. Alexander, X. Zhang and T. C. Peterson, et al., Global observed changes in daily climate extremes of temperature and precipitation, J. Geophys. Res.: Atmos., 2006, 111(D5), 1042–1063 CrossRef.
- P. Zhang, J. He and X. Hong, et al., Carbon sources/sinks analysis of land use changes in China based on data envelopment analysis, J. Cleaner Prod., 2018, 204, 702–711 CrossRef.
- K. Samson, M. Śliwa and R. P. Socha, et al., Influence of ZrO2 Structure and Copper Electronic State on Activity of Cu/ZrO2 Catalysts in Methanol Synthesis from CO2, ACS Catal., 2016, 4(10), 3730–3741 CrossRef.
- K. Saravanan, H. Ham and N. Tsubaki, et al., Recent progress for direct synthesis of dimethyl ether from syngas on the heterogeneous bifunctional hybrid catalysts, Appl. Catal., B, 2017, 217, 494–522 CrossRef CAS.
- X. Zhou, T. Su and Y. Jiang, et al., CuO–Fe2O3–CeO2/HZSM-5 bifunctional catalyst Hydrogenated CO2 for enhanced dimethyl ether synthesis, Chem. Eng. Sci., 2016, 153, 10–20 CrossRef CAS.
- C. A. Huff and M. S. Sanford, Cascade Catalysis for the Homogeneous Hydrogenation of CO2 to Methanol, J. Am. Chem. Soc., 2011, 133(45), 18122–18125 CrossRef CAS PubMed.
- C. Liu, M. Li and J. Wang, et al., Plasma methods for preparing green catalysts: current status and perspective, Chin. J. Catal., 2016, 37(3), 340–348 CrossRef CAS.
- J. Ye, C. Liu and D. Mei, et al., Active oxygen vacancy site for methanol synthesis from CO2 hydrogenation on In2O3 (110): a DFT study, ACS Catal., 2013, 3(6), 1296–1306 CrossRef CAS.
- S. B. Bagherzadeh and M. Haghighi, Plasma-enhanced comparative hydrothermal and coprecipitation preparation of CuO/ZnO/Al2O3 nanocatalyst used in hydrogen production via methanol steam reforming, Energy Convers. Manage., 2017, 142, 452–465 CrossRef CAS.
- A. M. Seyedi, M. Haghighi and N. Rahemi, Significant influence of cutting-edge plasma technology on catalytic properties and performance of CuO–ZnO–Al2O3–ZrO2 nanocatalyst used in methanol steam reforming for fuel cell grade hydrogen production, Ceram. Int., 2017, 43(8), 6201–6213 CrossRef.
- J. Wang, G. Li and Z. Li, et al., A highly selective and stable ZnO–ZrO2 solid solution catalyst for CO2 hydrogenation to methanol, Sci. Adv., 2017, 3(10), e1701290 CrossRef PubMed.
- K. Cheng, B. Gu and X. Liu, et al., Direct and highly selective conversion of synthesis gas into lower olefins: design of a bifunctional catalyst combining methanol synthesis and carbon–carbon coupling, Angew. Chem., 2016, 55(15), 4725–4728 CrossRef CAS PubMed.
- W. Shan, W. Shen and C. Li, Structural Characteristics and Redox Behaviors of Ce1−xCuxOy Solid Solutions, Chem. Mater., 2003, 15(25), 4761–4767 CrossRef CAS.
- W. T. Yao, S. H. Yu and Y. Zhou, et al., Formation of uniform CuO nanorods by spontaneous aggregation: Selective synthesis of CuO, Cu2O, and Cu nanoparticles by a solid–liquid phase arc discharge process, J. Phys. Chem. B, 2005, 109(29), 14011–14016 CrossRef CAS PubMed.
- J. Y. LuO, M. Meng and X. Li, et al., Mesoporous Co3O4–CeO2 and Pd/Co3O4–CeO2 catalysts: synthesis, characterization and mechanistic study of their catalytic properties for low-temperature CO oxidation, J. Catal., 2008, 254(2), 310–324 CrossRef CAS.
- Y. Yu, Y. M. Chan and Z. Bian, et al., Enhanced performance and selectivity of CO2 methanation over g-C3N4 assisted synthesis of NiCeO2 catalyst: kinetics and DRIFTS studies, Int. J. Hydrogen Energy, 2018, 43(32), 15191–15204 CrossRef CAS.
- Y. Yu, Z. Bian and F. Song, et al., Influence of Calcination Temperature on Activity and Selectivity of Ni–CeO2 and Ni–Ce0.8Zr0.2O2 Catalysts for CO2 Methanation, Top. Catal., 2018, 61(15–17), 1514–1527 CrossRef CAS.
- J. Xiao, D. Mao and X. Guo, et al., Effect of TiO2, ZrO2, and TiO2–ZrO2 on the performance of CuO–ZnO catalyst for CO2 hydrogenation to methanol, Appl. Surf. Sci., 2015, 338, 146–153 CrossRef CAS.
- S. T. Hossain, E. Azeeva and K. Zhang, et al., A comparative study of CO oxidation over Cu–O–Ce solid solutions and CuO/CeO2 nanorods catalysts, Appl. Surf. Sci., 2018, 455, 132–143 CrossRef CAS.
- H. Zhu, R. Razzaq and C. Li, et al., Catalytic Methanation of Carbon Dioxide by Active Oxygen Material CexZr1−xO2 Supported Ni–Co Bimetallic Nanocatalysts, AIChE J., 2013, 59, 2567–2576 CrossRef CAS.
- T. Witoon, N. Kachaban and W. Donphai, et al., Tuning of catalytic CO2 hydrogenation by changing composition of CuO–ZnO–ZrO2 catalysts, Energy Convers. Manage., 2016, 118, 21–31 CrossRef CAS.
- H. Lei, R. Nie, G. Wu and Z. Hou, Hydrogenation of CO2 to CH3OH over Cu/ZnO catalysts with different ZnO morphology, Fuel, 2015, 154, 161–166 CrossRef CAS.
- G. Wang, D. Mao and X. Guo, et al., Enhanced performance of the CuO–ZnO–ZrO2 catalyst for CO2 hydrogenation to methanol by WO3 modification, Appl. Surf. Sci., 2018, 456, 403–409 CrossRef CAS.
- E. Moretti, L. Storaro and A. Talon, et al., Effect of thermal treatments on the catalytic behaviour in the CO preferential oxidation of a CuO–CeO2–ZrO2 catalyst with a flower-like morphology, Appl. Catal., B, 2011, 102(3–4), 627–637 CrossRef CAS.
| This journal is © The Royal Society of Chemistry 2020 |


