
 Open Access Article
 This Open Access Article is licensed under a Creative Commons Attribution-Non Commercial 3.0 Unported Licence
CO2 photoreduction to CO/CH4 over Bi2W0.5Mo0.5O6 solid solution nanotubes under visible light
Yang Wanga,
Jiaxu Liua,
Ye Wanga and
Mingyi Zhang *ab
*ab
aKey Laboratory for Photonic and Electronic Bandgap Materials, Ministry of Education, School of Physics and Electronic Engineering, Harbin Normal University, Harbin 150025, PR China. E-mail: zhangmingyi@hrbnu.edu.cn; mysci@foxmail.com
bSchool of Materials Science and Engineering, Zhengzhou University, Zhengzhou, 45001, PR China
First published on 28th February 2020
Abstract
In this work, Bi2W0.5Mo0.5O6 solid solution nanotubes have been synthesized through a structure-directing hard template approach, which demonstrated greatly enhanced CO2 photoreduction to CO/CH4. The crystalline phase, components and morphologies of the as-prepared composites were investigated by X-ray diffraction (XRD), scanning electron microscopy (SEM) and transmission electron microscopy (TEM). The present design of Bi2W0.5Mo0.5O6 solid solution nanotubes leads to remarkably enhanced photocatalytic activities with a peak CO/CH4 production rate of 6.55/3.75 mmol g−1 h−1 under visible light irradiation at room temperature, which was about 7 times that on pure Bi2WO6 and Bi2MoO6 nanotubes, respectively. Hollow nanotubular structures and synergistic electronic effects of various elements contribute to the enhanced visible light photocatalytic activity of Bi2W0.5Mo0.5O6 solid solution nanotubes.
1. Introduction
As a major greenhouse gas causing global warming, the carbon dioxide (CO2) level in the atmosphere has been increasing steadily over the past centuries as a result of human activities, and therefore the fixation and conversion of CO2 into C1/C2 energy compounds (such as CO, CH4, CH3OH, and/or C2H5OH) is an increasingly important issue, and it holds the promise of solving both energy and environmental problems.1–4Oxide semiconductors with Aurivillius structures are of immense importance due to their layered structures and unique properties.5–16 Among these semiconductors, Bi2WO6 is significant because of its excellent intrinsic physico-chemical properties. In order to further improve the utilization of visible light, Bi2WO6-based heterojunction composites have been developed.17–23 Among the strategies to improve the photocatalytic efficiency of Bi2WO6, it is an effective method to construct the solid solution photocatalyst. Based on the above consideration, the construction of Bi2MoxW1−xO6 solid solutions attracts our interest in particular because of their structural analogy. That is, (1) Bi2MoO6 has a similar Aurivillius layered structure to that of Bi2WO6. Compared with Bi2WO6, Bi2MoO6 with a narrower band gap has the ability to harness more sunlight. (2) The W component can endow the material with high photocatalytic activity, whereas the Mo constituent contributes to the narrow band gap, it is reasonable to postulate that the Bi2MoxW1−xO6 solid solutions may provide a suitable option.
In addition, many works show that the hollow structure has many useful functions: (1) the hollow structure is conducive to the rapid transfer of substances in its internal space; (2) to make its high surface volume ratio to absorb a large number of chemical substances; (3) the unique structure can make light in its internal space for multiple reflections, thus improving the utilization rate of light. To the best of our knowledge, the fabrication and photocatalytic property of tubes-structured Bi2MoxW1−xO6 solid solutions has not yet been reported.
In this paper, we report the synthesis of the Bi2Mo0.5W0.5O6 solid solution nanotubes using PAN nanofibers as the hard template through solvothermal method. Photocatalytic experiments showed that, compared with Bi2MoO6 and Bi2WO6 nanotubes, the Bi2Mo0.5W0.5O6 solid solution nanotubes exhibited excellent photocatalytic activity, which significantly improved the catalytic activity of CO2 photoreduction.
2. Experimental section
2.1. Fabrication of polyacrylonitrile (PAN) nanofibers
Electrospun polyacrylonitrile nanofibers were fabricated as previously reported.24 In a typical procedure, 3 g of polyacrylonitrile (PAN) (Mw ca. 60![[thin space (1/6-em)]](https://www.rsc.org/images/entities/char_2009.gif) 000) powders were dissolved in 20 mL of N,N-dimethylformamide (DMF) solution. After stirring at room temperature for 15 hours to form a uniform solution, the precursor solution was pumped into a hypodermic syringe for electrospinning. A piece of copper pin connected to a high voltage generator was put into the solution. The positive voltage applied to the tip was 10 kV and the distance between the needle tip and the collector was 12 cm. The spinning PAN nanofibers are collected on the aluminum foil.
000) powders were dissolved in 20 mL of N,N-dimethylformamide (DMF) solution. After stirring at room temperature for 15 hours to form a uniform solution, the precursor solution was pumped into a hypodermic syringe for electrospinning. A piece of copper pin connected to a high voltage generator was put into the solution. The positive voltage applied to the tip was 10 kV and the distance between the needle tip and the collector was 12 cm. The spinning PAN nanofibers are collected on the aluminum foil.
2.2. Fabrication of Bi2Mo0.5W0.5O6 solid solution nanotubes
In a typical case, 0.125 mmol Na2MoO4·2H2O, 0.125 mmol Na2WO4·2H2O and 0.5 mmol Bi(NO3)3·5H2O, were dissolved in 40 mL of ethylene glycol (EG) under magnetic stirring for 10 min. The resulting transparent solution was transferred to a 50 mL teflon-lined stainless steel autoclave and PAN nanofibers (15 mg) were added. The autoclave is then heated to 160 °C and maintained for 24 hours. The obtained polyacrylonitrile/Bi2W0.5Mo0.5O6 hybrid nanofibers were washed with deionized water and ethanol to remove any ionic residual. And, it was denoted as PAN/BWMO. By heating the obtained PAN/BWMO hybrid nanofibers in oven at 500 °C at a ramp rate of 2 °C min−1 and maintained for 2 h, the Bi2W0.5Mo0.5O6 solid solution nanotubes (named as BWMO NTs) were prepared. For comparison, Bi2MoO6 and Bi2WO6 nanotubes were also synthesized through this method (Na2WO4·2H2O or Na2MoO4·2H2O just choose one) and were denoted as BWO NTs and BMO NTs.2.3. Characterization
The phase purity of the products was characterized by X-ray diffraction (XRD; D/max2600, Rigaku, Japan). Field emission scanning electron microscope (FESEM) images were performed using a SU70 microscope (Hitachi, Japan). Transmission electron microscopy (TEM) images were obtained on a JEOL JEM-2010 instrument. An energy dispersive X-ray (EDX) spectroscope coupled to a TEM was used to analyze the composition of the samples. The UV-Vis diffuse reflectance (DR) spectroscopy of the samples was recorded on a Cary 500 UV-Vis-NIR spectrophotometer.2.4. Photocatalytic test
The photocatalytic CO2 reduction experiment was conducted under 300 W xenon lamp. Quartz plates are provided on the top of the airtight reactor and sampling ports are provided on both sides, with a volume of 500 mL. In a typical process, 0.1 g catalyst was uniformly dispersed onto the watch-glass with an area of ∼20 cm2, which then put in the reactor cell. After that, the photocatalysts was sealed in the reactor. Before the irradiation, high purity CO2 was bubbled through deionized water and then flowed into the reactor for 30 min to remove the residual air. During irradiation, 2 mL gas was taken from the reactor at regular intervals (1 h) for subsequent gas concentration analysis using a gas chromatograph (Agilent 7890A GC) equipped with a flame ionized detector (FID) and methanizer. The produced gases were calibrated with a standard gas mixture and their identity determined using the retention time.3. Results and discussions
The SEM images (Fig. 1a) reveal that all the as-electrospun PAN nanofibers with diameters of 150–200 nm has a smooth surface without secondary structure. After solvothermal treatment, the Bi2W0.5Mo0.5O6 solid solution with high coverage density is vertically grown on the PAN nanofibers surfaces, indicating the formation of polyacrylonitrile/Bi2W0.5Mo0.5O6 hybrid nanofibers (Fig. 1b). Through heat treatment of the as-prepared PAN/BWMO hybrid nanofibers to remove the PAN core, Bi2W0.5Mo0.5O6 solid solution with tubes-structured are obtained. From the Fig. 1c, we can see that the outer diameter of the BWMO NTs channel is estimated at 400 nm, the wall thickness is estimated at around 80 nm, and the average diameter of the BWMO NTs channel is estimated at 240 nm. From the TEM images (Fig. 1d), A clear contrast between the dark edges and the pale center can be observed, this further confirms that the BWMO NTs have a hollow interior.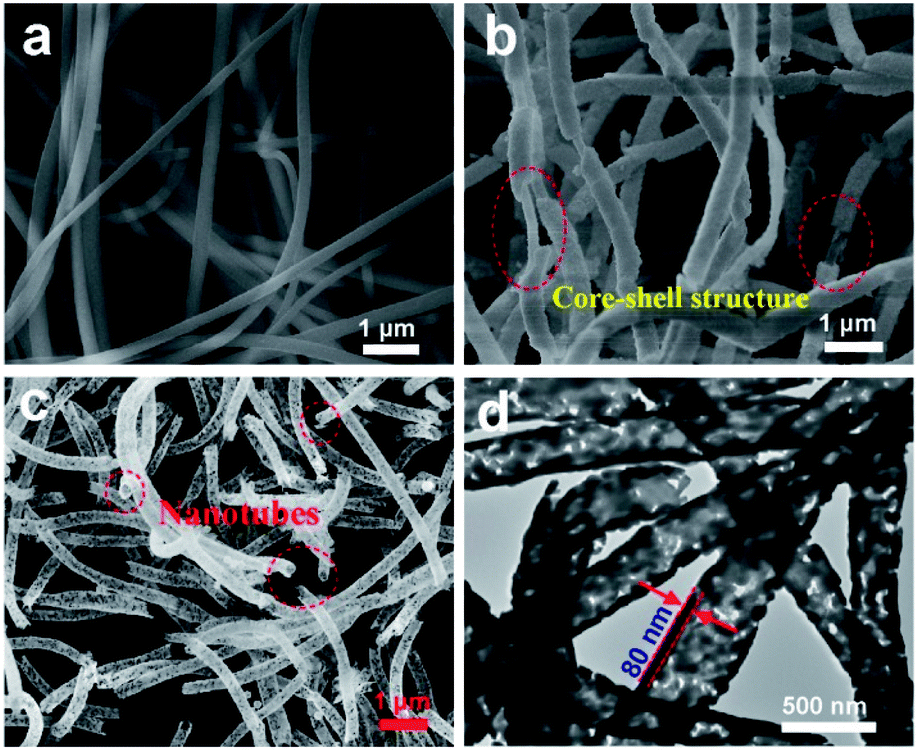 | ||
| Fig. 1 (a) SEM image of PAN nanofibers. (b) SEM image of the PAN/BWMO nanofibers. (c) SEM image of the BWMO NTs. (d) TEM image of the BWMO NTs. | ||
In order to further clarify the composition distribution and structural characteristics of the product, TEM-EDX scanning along the BWMO NTs radial direction (red line in the inset of Fig. 2) was used to obtain the spatial distribution of the components of the nanotube structure. Three signal peaks for Bi, W and Mo is found in the wall region. This is consistent with the BWMO NTs configuration observed in the SEM and TEM image. In addition, EDX analysis indicates that the molar ratio of W and Mo is about 1:1.05 for the BWMO NTs.
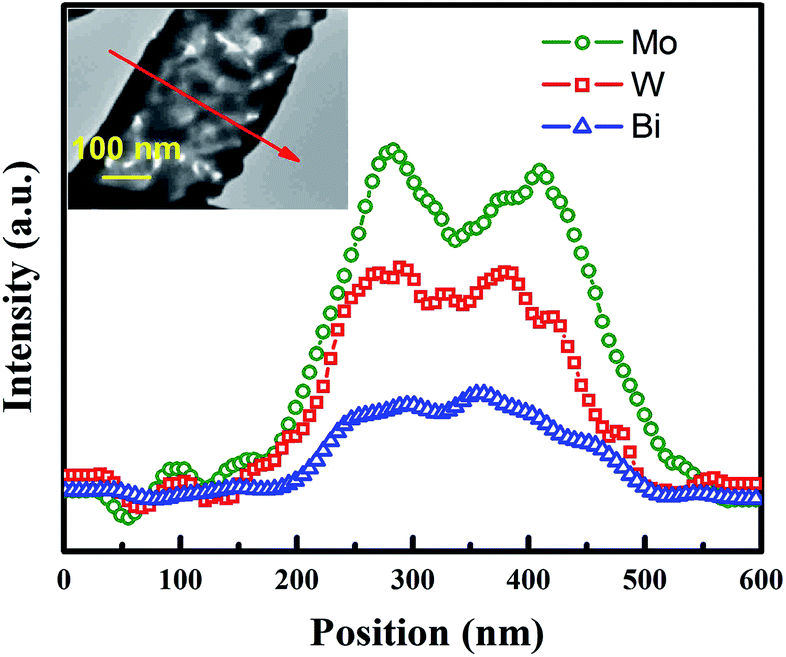 | ||
| Fig. 2 TEM-EDX line scans spectra of BWMO NTs. | ||
From the XRD patterns (Fig. 3), we can see that the PAN nanofibers are poorly crystallized. As aforementioned, Bi2MoO6 and Bi2WO6 are Aurivillius structures so they have same crystal structure in the normal conditions. Therefore, XRD spectra cannot be utilized to distinguish between these two Aurivillius structures since their peaks are obtained at almost the same diffraction angles. As for the pattern of PAN/BWMO hybrid nanofibers, some strong diffraction peaks can be perfectly indexed to Bi2MoO6 or Bi2WO6 (JCPDS 76-2388), indicate the formation of Bi2W0.5Mo0.5O6 solid solution. The XRD pattern of the BWMO NTs shows higher intensity and narrower diffraction peaks, implying the leading role of calcination in the enhancement of crystallization.
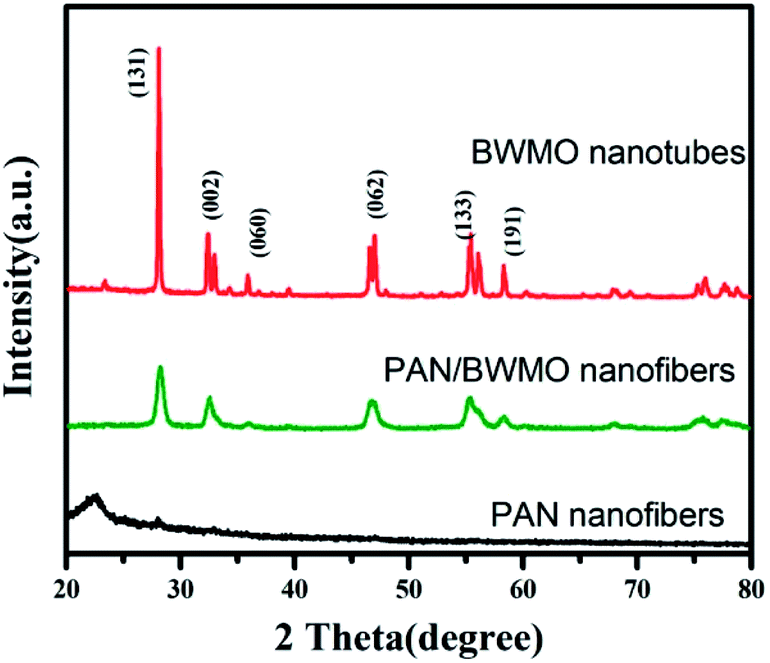 | ||
| Fig. 3 XRD patterns of the samples. | ||
Fig. 4 displays the UV-Vis diffuse reflectance (DR) spectroscopy of the PAN nanofibers, PAN-BWMO and the BWMO-NTs. As observed in Fig. 4 there was no peak of PAN nanofibers, while PAN-BWMO and the BWMO-NTs shows a major absorption band between 370 nm and 510 nm. The steep shape of the absorption edge indicates a band-gap transition rather than the transition from the impurity level. For a crystalline semiconductor, the optical absorption near the band edge follows the equation αhv = A(hv − Eg)n/2, where, α, v, Eg and A are the absorption coefficient, the light frequency, the band gap and a constant, respectively. Among them, n decides the characteristics of the transition in a semiconductor. In this paper, the band gap of BWMO-NTs is calculated as approximately 2.59 eV starting from the absorption edge (inset of Fig. 4), indicating that BWMO-NTs has a suitable band gap for photocatalytic reactions under visible-light irradiation.
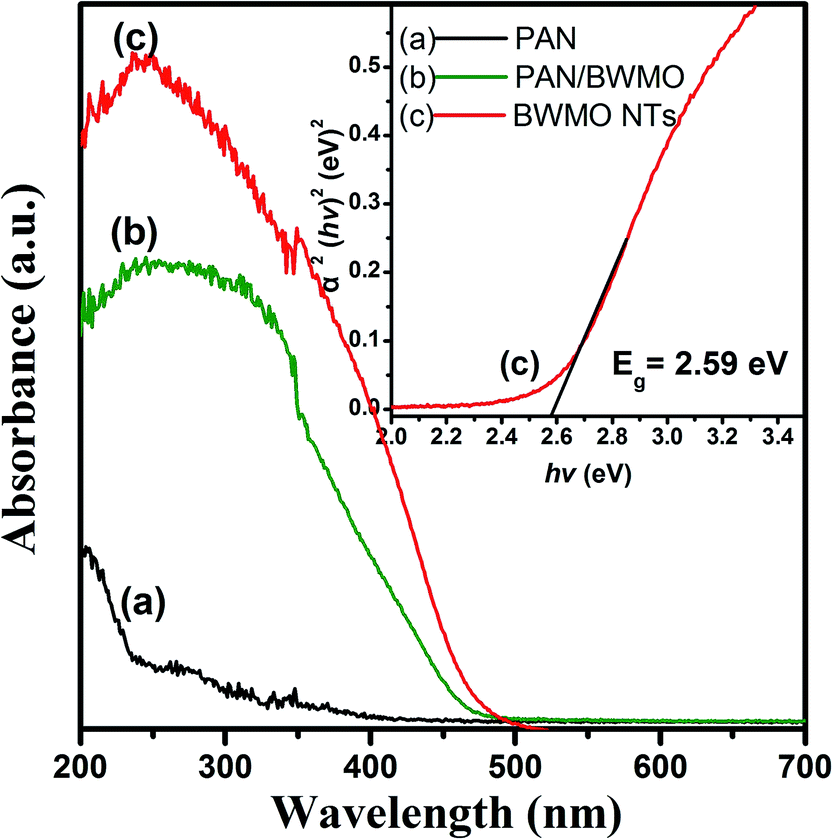 | ||
| Fig. 4 UV-Vis diffuse reflectance spectra of PAN nanofibers (curve a), PAN-BWMO (curve b) and BWMO-NTs (curve c). | ||
As discussed above, the as-prepared BWMO-NTs exhibit one dimensional hollow structure with large surface area, rendering it an excellent candidate for photocatalytic CO2 reduction. The photocatalytic performance of BWMO-NTs photocatalysts was evaluated and compared to that of pure BWO NTs and pure BMO NTs under visible light irradiation. Control experiments showed no CH4 or CO production in the absence of either catalyst or irradiation, implying that both catalyst and irradiation are necessary for the present gaseous CO2 photoreduction system (no show). The primary results showed CO2 can be reduced to CO and CH4 in the presence of H2O vapor and the BWMO NTs, and no other reduced product such as CH3OH, HCHO or HCOOH is detected. In addition, when N2 is used to replace CO2 in the photoreaction system, neither CO/CH4 nor other carbon-based organic compounds can be detected, indicating that the formation of CO/CH4 is caused by the CO2 photoreduction process on the catalyst.
As shown in Fig. 5a–c, under visible light irradiation, CO2 can be reduced to CH4 and CO in the presence of water vapor by using the Bi2W0.5Mo0.5O6 solid solution as the photocatalysts. The pure BWO NTs show poor CO and CH4 production (0.93 μmol g−1 h−1 and 0.13 μmol g−1 h−1), meanwhile, the pure BMO NTs also show poor CO and CH4 production (0.80 μmol g−1 h−1 and 0.12 μmol g−1 h−1) after irradiation for 4 h. In comparison, the BWMO NTs display more than 7 times higher activity for CO production (6.55 μmol g−1 h−1) and CH4 production (3.75 μmol g−1 h−1). The highly enhanced visible-light photocatalytic activity of BWMO NTs can be ascribed to tube structure and the modified band structure, which adapt the balance between adequate redox potentials and effective visible light adsorption. Furthermore, we have tested the stability and reusability of BWMO NTs for the photocatalytic CO2 reduction through a cycling test. As shown in Fig. 5d, the result indicates no obvious decrease of the photocatalytic activity after the three cycles, demonstrating the good stability of the BWMO NTs.
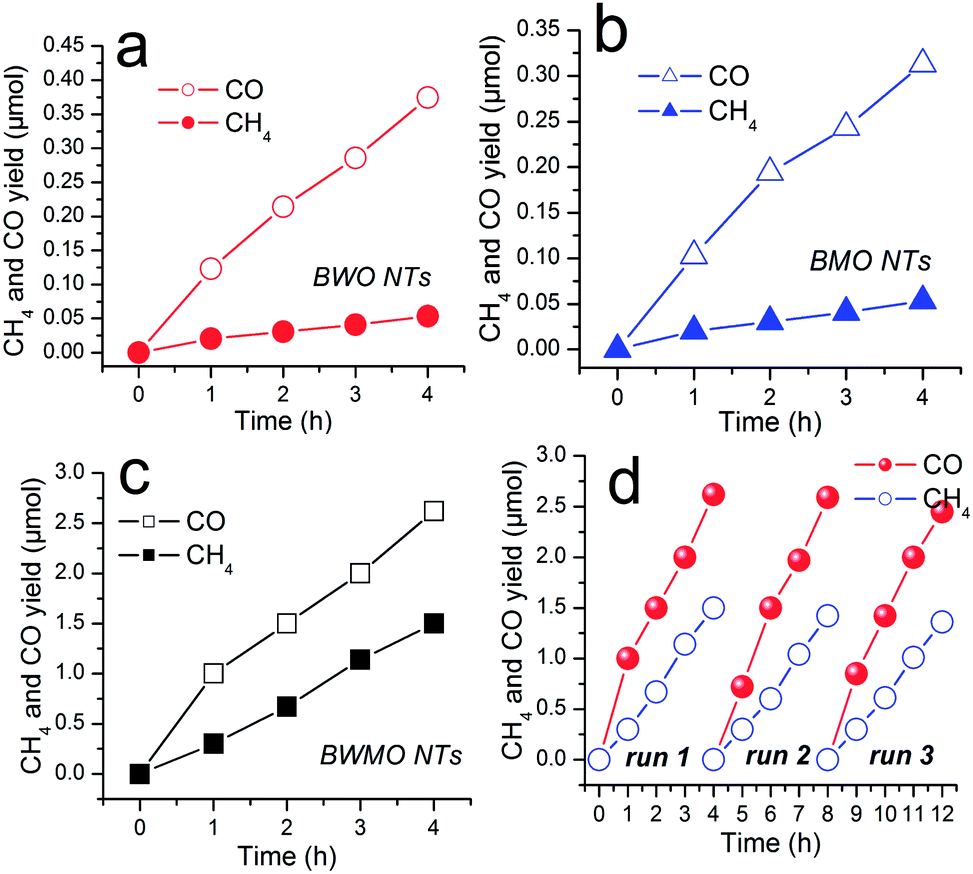 | ||
| Fig. 5 Plots of CO and CH4 production amounts as a function of visible light irradiation time over different samples: (a) BWO NTs, (b) BMO NTs and (c) BWMO NTs. (d) Stability study of photocatalytic CO and CH4 evolution over the BWMO NTs under visible light irradiation. | ||
4. Conclusions
In conclusion, Bi2W0.5Mo0.5O6 solid solution nanotubes were used as catalyst for the CO2 photoreduction. The BWMO NTs exhibit remarkably improved photocatalytic activities for CO2 reduction as compared to the pure BWO NTs and BMO NTs. The photocatalytic stability of the BWMO NTs was not as satisfactory as expected and further studies are under way. This work demonstrates the promise of BWMO NTs as a photocatalyst driven by visible light for CO2 light conversion without the addition of any noble metal assisted catalysts.Conflicts of interest
There are no conflicts to declare.Acknowledgements
This work was supported by the National Natural Science Foundation of China (51872068), Heilongjiang Natural Science Foundation (E2018051).References
- J. Mao, K. Li and T. Peng, Catal. Sci. Technol., 2013, 3, 2481–2498 RSC.
- Y. He, L. Zhang, B. Teng and M. Fan, Environ. Sci. Technol., 2014, 49, 649–656 CrossRef PubMed.
- D. Xu, B. Cheng, W. Wang, C. Jiang and J. Yu, Appl. Catal., B, 2018, 231, 368–380 CrossRef CAS.
- X. Li, J. Yu, M. Jaroniec and X. Chen, Chem. Rev., 2019, 119, 3962–4179 CrossRef CAS PubMed.
- H. B. Yu, L. B. Jiang, H. Wang, B. B. Huang, X. Z. Yuan, J. H. Huang, J. Zhang and G. M. Zeng, Small, 2019, 15, 1901008 CrossRef PubMed.
- J. L. Liang, F. Y. Liu, J. Deng, M. Li and M. P. Tong, Water Res., 2017, 123, 632–641 CrossRef CAS PubMed.
- J. Wu, Y. Y. Sun, C. H. Gu, T. Wang, Y. J. Xin, C. Chai, C. Y. Cui and D. Ma, Appl. Catal., B, 2018, 237, 622–632 CrossRef CAS.
- Q. Yan, M. Sun, T. Yan, M. M. Li, L. G. Yan, D. Wei and B. Du, RSC Adv., 2015, 5, 17245–17252 RSC.
- A. Phuruangrat, A. Maneechote, P. Dumrongrojthanath, N. Ekthammathat, S. Thongtem and T. Thongtem, Mater. Lett., 2015, 159, 289–292 CrossRef CAS.
- Y. Zhao, X. Tan, T. Yu and S. Wang, Mater. Lett., 2016, 164, 243–247 CrossRef CAS.
- H. Huang, X. Li, J. Wang, F. Dong, P. Chu, T. Zhang and Y. Zhang, ACS Catal., 2015, 5, 4094–4103 CrossRef CAS.
- N. Tian, H. Huang, C. Liu, F. Dong, T. Zhang, X. Du, S. Yu and Y. Zhang, J. Mater. Chem. A, 2015, 3, 17120–17129 RSC.
- Y. Tian, B. Chang, J. Lu, J. Fu, F. Xi and X. Dong, ACS Appl. Mater. Interfaces, 2013, 5, 7079–7085 CrossRef CAS PubMed.
- Y. Liu, Z. Zhang, Y. Fang, B. Liu, J. Huang, F. Miao, Y. Bao and B. Dong, Appl. Catal., B, 2019, 252, 164–173 CrossRef CAS.
- K. Wang, Y. Zhang, L. Liu and N. Lu, J. Mater. Sci., 2019, 54, 8426–8435 CrossRef CAS.
- Y. Ma, Z. Chen, D. Qu and J. Shi, Appl. Surf. Sci., 2016, 361, 63–71 CrossRef CAS.
- F. Xu, C. Xu, H. Chen, D. Wu, Z. Gao, X. Ma, Q. Zhang and K. Jiang, J. Alloys Compd., 2019, 780, 634–642 CrossRef CAS.
- Y. Xu, J. Song, F. Chen, X. Wang, H. Yu and J. Yu, RSC Adv., 2016, 6, 65902–65910 RSC.
- H. Zheng, P. Niu and Z. Zhao, RSC Adv., 2017, 7, 26943–26951 RSC.
- Y. Liu, M. Zhang, L. Li and X. Zhang, Appl. Catal., B, 2014, 160–161, 757–766 CrossRef CAS.
- J. Li, H. Hao and Z. Zhu, Mater. Lett., 2016, 168, 180–183 CrossRef CAS.
- Z. Li, L. Zhu, W. Wu, S. Wang and L. Qiang, Appl. Catal., B, 2016, 192, 277–285 CrossRef CAS.
- F. Ma, Q. Yang, Z. Wang, Y. Liu, J. Xin, J. Zhang, Y. Hao and L. Li, RSC Adv., 2018, 8, 15853–15862 RSC.
- M. Zhang, Y. Qi and Z. Zhang, Polymers, 2019, 11, 1718 CrossRef CAS PubMed.
| This journal is © The Royal Society of Chemistry 2020 |