 Open Access Article
Magnetic nanocomposite based on polyacrylic acid and carboxylated cellulose nanocrystal for the removal of cationic dye†
Rajib Samadder ,
Nahida Akter
 ,
Abinash Chandra Roy,
Md. Mosfeq Uddin
 ,
Md. Jahangir Hossen and
Md. Shafiul Azam
 *
*
Department of Chemistry, Bangladesh University of Engineering and Technology (BUET), Dhaka 1000, Bangladesh. E-mail: mdshafiulazam@chem.buet.ac.bd; azam@ualberta.ca
First published on 24th March 2020
Abstract
The development of safe and cost-effective methods for the treatment of dye polluted wastewater has been a great concern among researchers. Herein, we developed a nanocomposite (M3D–PAA–CCN) based on polyacrylic acid (PAA) crosslinked with magnetic 3D crosslinkers (M3D) and carboxylated cellulose nanocrystals (CCN), for the removal of cationic dyes from aqueous solutions. Acrylic-functionalized Fe3O4 nanoparticles were covalently linked to the polymer chains via the form of the 3D crosslinker to introduce magnetic properties into the as-synthesized nanocomposite. The addition of highly dispersive CCN reduced the gel-like properties of the nanocomposite and instead incorporated a diffusive nature, which was more desirable for adsorbents. The surface morphology of the nanocomposite was analyzed by FESEM and the size of the nanocomposite particles was found to be in the range of 60–90 nm. The chemical functionalities and compositions were determined by XPS, FTIR, and EDX analyses whereas TGA confirmed the thermal stability of M3D–PAA–CCN. The maximum adsorption capacity of the M3D–PAA–CCN (332 mg g−1) was measured higher than that of M3D–PAA (114 mg g−1) to a cationic methylene blue (MB) dye indicating the significant contribution of CCN. The adsorption capacity of the as-synthesized M3D–PAA–CCN was found to be highly pH-dependent and the adsorption capacity increased with the increase of pH owing to the greater negative charge as indicated by the higher zeta potential. The adsorption kinetics of MB on the composites was found to follow the pseudo-second-order model. The adsorption capacity was also investigated as a function of concentration to figure out the adsorption mechanism using Langmuir and Freundlich isotherm models. The Langmuir model fitted the adsorption process better as suggested by the relatively smaller nonlinear chi-square value obtained from the fitting parameters.
Introduction
Water pollution has become a serious global problem due to rapid industrialization and various human activities. Dye contaminants are being continuously released into water bodies from various industries like textile, plastic, paper, cosmetics leading to serious environmental issues.1 More than 10![[thin space (1/6-em)]](https://www.rsc.org/images/entities/char_2009.gif) 000 dyes are commercially available worldwide and about 7 × 10⁵ metric tons of dyes are produced per year. About 12 percent of dyes are wasted during the manufacturing and other handling processes whereas 20 percent of these pollute the environment via industrial wastewater.2 About 3 × 10⁵ tons of synthetic dyes are consumed by textile industries per year and a significant portion of the dye contaminated effluents get discharged to the nearby water bodies without any treatment.3 The color caused by the presence of even a trace amount of these dyes in water is undesirable as it hinders the photosynthesis in aquatic plants reducing the sunlight penetration.4 Besides, most of the dyes are toxic to living organisms including fish due to the presence of aromatics, heavy metals, and chloride.5,6 The dye-polluted water may also cause allergic dermatitis, skin problems, and even cancer in humans.1 The treatment of contaminated water is not always easy due to the photo- and thermal stability as well as non-biodegradability of the dyes.7 Therefore, the development of new materials for efficient and economic dye removal is of great importance.
000 dyes are commercially available worldwide and about 7 × 10⁵ metric tons of dyes are produced per year. About 12 percent of dyes are wasted during the manufacturing and other handling processes whereas 20 percent of these pollute the environment via industrial wastewater.2 About 3 × 10⁵ tons of synthetic dyes are consumed by textile industries per year and a significant portion of the dye contaminated effluents get discharged to the nearby water bodies without any treatment.3 The color caused by the presence of even a trace amount of these dyes in water is undesirable as it hinders the photosynthesis in aquatic plants reducing the sunlight penetration.4 Besides, most of the dyes are toxic to living organisms including fish due to the presence of aromatics, heavy metals, and chloride.5,6 The dye-polluted water may also cause allergic dermatitis, skin problems, and even cancer in humans.1 The treatment of contaminated water is not always easy due to the photo- and thermal stability as well as non-biodegradability of the dyes.7 Therefore, the development of new materials for efficient and economic dye removal is of great importance.
Various physical, chemical, and biological treatment techniques have been applied over the past three decades for the treatment of dye contaminated water, such as coagulation, membrane filtration, chemical oxidation, electro-dialysis, photo-degradation, catalytic degradation,8 adsorption, a spectrophotometric method, liquid chromatography method, etc. Among these methods, the adsorption process has gained much popularity due to its simplicity, no secondary pollution, and cost-effectiveness.9–11 Moreover, the adsorption process does not require high operating temperature and can remove several pollutants simultaneously.1,12,13 Although a variety of adsorbents like clay, zeolite, carbonaceous compounds are already available, their use in treating polluted water is often limited because of low efficiency, complex separation process, cost of regeneration, and the difficulties in water treatment.12
Recently composite materials made of biopolymers and other polymeric materials have attracted huge research attention as sustainable and effective adsorbents for wastewater treatment.14,15 Compared to conventional adsorbents, polymeric materials offer simple processing, tailor-made feasibility, and the ability to shape into suitable forms like the sheets, beads, membranes, etc. Moreover, the polymeric composites can desorb the dyes and other organic pollutants under altering conditions and therefore attain regenerability and cost-effectiveness.16,17 The separation of the nanocomposite from the application sites is often complex and time-consuming. Since the magnetic nanocomposites offer easy separation in the presence of an external magnetic field their use in wastewater management has been increasing gradually. Huang et al. synthesized porous organic polymer composites18 and Sun et al. developed xylan/polyacrylic acid nanocomposites19 with the magnetic property which showed high adsorption capacity towards methylene blue. In another work, Chen et al. fabricated magnetically separable cross-linked polyethyleneimine for the removal of organic dyes.20 However, these magnetic nanocomposites were found to contain magnetic particles linked via weak van der Waals forces with the polymer matrix leading to a serious drawback that only the magnetic nanoparticles are attracted to the external magnetic field leaving the polymer chains behind.21
Herein, we fabricated a novel nanocomposite using magnetic 3D crosslinker and cellulosic material via in situ polymerization. We synthesized the magnetic 3D crosslinkers (M3D) by modifying the Fe3O4 nanoparticles with the acrylic groups. Acrylic groups on the Fe3O4 nanoparticles were able to crosslink the polyacrylic acid chains by forming strong and robust covalent bonds.22 Zhang et al. reported the use of polyacrylic acid (PAA) in the adsorbents and showed that PAA exhibited a strong affinity towards positively charged dye molecules due to the presence of abundant carboxyl groups.12 Since 3D crosslinkers with a higher number of reactive sites compared to conventional linear or planar crosslinkers link with many more polymer chains, the nanocomposite becomes mechanically strong as well as very sticky and adhesive.23,24 So our other approach was to reduce the adhesive nature of the nanocomposite using highly dispersive carboxylated cellulose nanocrystal (CCN) in the nanocomposite. The ratio of M3D and CCN was optimized during the synthesis of M3D–PAA–CCN to obtain high dispersion in aqueous systems and adequate magnetic property. The kinetic behaviour and the mechanism of adsorption of MB on the nanocomposite were also studied.
Experimental
Materials and reagents
All reagents were of analytical grade and used without further purification. Ultrapure water was used for all experiments, obtained from a Millipore water purification system (MA, USA). (3-Aminopropyl)triethoxysilane (APTES) (≥98%), tetraethylorthosilicate (TEOS) (≥99%), methacrylic anhydride (assay 94%), 2,2,6,6-tetramethylpiperidine-1-oxyl (TEMPO) (>98%) and acrylic acid (AA) (≥99%, stabilized) were purchased from Sigma Aldrich. N,N-Dimethylformamide (DMF) (>99%), ferrous chloride tetrahydrate (FeCl2·4H2O ≥ 99%), ferric chloride hexahydrate (FeCl3·6H2O ≥ 99%), hydrochloric acid (HCl) (≥99.8%), NaOH (≥ 98%), and toluene (≥99.9%) were obtained from Merck, Germany. Potassium persulfate (KPS) (assay ≥ 98%) and sodium chlorite (NaClO2) (≃80%) were purchased from BDH Chemical Ltd, Poole England while sulfuric acid (H2SO4, 97.5–98.5%) was purchased from RCI Labscan, Thailand.Preparation of Fe3O4 nanoparticles
Magnetic iron oxide (Fe3O4) nanoparticles were prepared by following an easy and widely used chemical co-precipitation method.25–27 Firstly, an iron salt solution was prepared by adding 0.005 mol of FeCl3 (1.351 g) and 0.0025 mol of FeCl2 (0.497 g) to 50 mL of deoxygenated ultrapure water so that the ratio of Fe3+ to Fe2+ was 2. Then 20 mL of NaOH (1.5 M) was rapidly poured into the iron salt solution under vigorous magnetic stirring at room temperature under N2 atmosphere. The orange color of the solution disappeared rapidly and the black precipitate of Fe3O4 nanoparticles was formed. After constant stirring for 20 min, the precipitate was separated in the presence of an external magnet. Fe3O4 nanoparticles were washed several times using deoxygenated water followed by centrifugation for 20 min with relative centrifugal force (RCF) of 1700 g and then dried particles were collected for further use.Preparation of silica-coated magnetic Fe3O4 nanoparticles (Fe3O4@Si)
Silica coating of Fe3O4 nanoparticles was performed according to the modified Stöber process26,28,29 using TEOS as the silicon source.19,21,22 300 mg of Fe3O4 nanoparticles were first dispersed into a mixture of 240 mL of ethanol and 60 mL of distilled water under sonication for 15 min. The pH of the mixture was maintained at ∼9 using a 25% ammonia solution and 4 mL of TEOS was added under vigorous stirring. At room temperature, the magnetic stirring was continued for 10 h and the mixture was then heated at 50 °C for 12 h to carry out complete hydrolysis leading to silica coating on the surface of Fe3O4 nanoparticles. Finally, the particles were separated magnetically, washed several times with anhydrous ethanol, and dried overnight in an oven at 60 °C.Amine (–NH2) functionalization of silica-coated Fe3O4 nanoparticles (Fe3O4@Si–NH2)
Silica coated iron oxide nanoparticles (Fe3O4@Si) were ultrasonically dispersed in 120 mL of toluene and the volume was reduced to two-thirds (80 mL) by heating at 120 °C prior to the complete removal of water. The resultant dispersion was transferred into a double-necked round bottom flask and 10 mL of APTES for amine functionalization was added dropwise followed by magnetic stirring.26 The stirring was continued for 24 h at room temperature. The product was separated by using a magnet, washed several times with toluene, and then dried in an oven at 60 °C.Synthesis of magnetic 3D crosslinker (M3D)
Fe3O4@Si–NH2 (500 mg) was transferred into a 250 mL round bottom flask containing 150 mL of toluene. The mixture was heated at 120 °C until the volume reached to 90 mL. The mixture was then cooled down to room temperature and 6.7 mL (45.2 mmol) of methacrylic anhydride was added and kept under magnetic stirring for about 4 h.26 As-synthesized M3D nanoparticles were then separated and washed three times with toluene, and three times with acetone. Finally, the M3D nanoparticles were transferred into a flask containing 100 mL of water. The complete removal of acetone was then confirmed by heating the mixture at 58 °C until the volume is reduced to 70 mL.Extraction of cellulose nanocrystals (CNCs)
Cellulose nanocrystals (CNCs) were extracted from the environmental waste sawdust by acid hydrolysis method.30–32 Sawdust (4 g) was first dried overnight in an oven at 85 °C and then dewaxed in a Soxhlet apparatus using a 2![[thin space (1/6-em)]](https://www.rsc.org/images/entities/char_2009.gif) :
:![[thin space (1/6-em)]](https://www.rsc.org/images/entities/char_2009.gif) 1 (v/v) mixture of toluene and ethanol at 150 °C for 6 h. Delignification of the dewaxed sawdust was carried out for 1 h using acidified NaOCl2 at 75 °C. This process was repeated for six to seven times until the color of the product was white indicating complete removal of lignin. Delignified cellulose was then treated with 5% KOH at 90 °C for 2 h and this treatment was repeated for three times to completely remove pectin and hemicellulose. The resultant chemically purified cellulose was further blended for 10 min and then subjected to acid hydrolysis with H2SO4 (64%) leading to CNC. The hydrolysis was continued for 60 min at 45 °C and the product was placed in an ice cool water bath. The washing was performed with ultrapure water via centrifugation with RCF of 1700 g for 15 min.
1 (v/v) mixture of toluene and ethanol at 150 °C for 6 h. Delignification of the dewaxed sawdust was carried out for 1 h using acidified NaOCl2 at 75 °C. This process was repeated for six to seven times until the color of the product was white indicating complete removal of lignin. Delignified cellulose was then treated with 5% KOH at 90 °C for 2 h and this treatment was repeated for three times to completely remove pectin and hemicellulose. The resultant chemically purified cellulose was further blended for 10 min and then subjected to acid hydrolysis with H2SO4 (64%) leading to CNC. The hydrolysis was continued for 60 min at 45 °C and the product was placed in an ice cool water bath. The washing was performed with ultrapure water via centrifugation with RCF of 1700 g for 15 min.
Synthesis of carboxylated cellulose nanocrystals (CCNs)
Carboxylated cellulose nanocrystals (CCNs) were prepared by utilizing the primary hydroxyl groups present on the surface of cellulose.33–35 Firstly, 1.0 g of CNC obtained from the previous step was mixed with 100 mL of distilled water followed by sonication in an ice bath for 10 min. Then, 16 mg of TEMPO and 100 mg of NaBr were added to the CNC suspension under magnetic stirring for 10 min at room temperature and also sonicated for 15 min. The TEMPO-mediated oxidation was initiated by adding 3.5 mL of ∼10% NaClO solution dropwise and the pH was maintained at 10 using 0.1 M NaOH solution. After continuous stirring for 12 h the oxidation process was quenched by adding 5 mL of ethanol.35 Finally, the suspension was washed with distilled water for several times, sonicated for 5 min, and was stored at 4 °C for further use.34Synthesis of M3D–PAA–CCN nanocomposite
M3D–PAA–CCN nanocomposite was synthesized via in situ polymerization in water using KPS as an initiator. 36.0 mg of CCN and 14.0 mg of M3D were transferred into a round-bottom flask containing 10 mL of water. The aqueous mixture was sonicated for 5 min in a cold bath, maintaining the temperature at 10–12 °C, while 1 mL of acrylic acid was added dropwise to the mixture under the N2 environment over 15 min. The free-radical polymerization was initiated by adding 25 mg of KPS properly dissolved in 5 mL of distilled water. This mixture was heated at 58 °C under continuous stirring at 1200 rpm for 4 h. It is important to note here that any significant temperature deviation or difference in the relative amount of CCN during the synthesis led to gel-like nanocomposites, which were not ideal for the adsorption experiments. After completion of the reaction, the resulting nanocomposite was washed with ultrapure water for several times and was finally freeze-dried using a lyophilizer.Adsorption and zeta potential study
The adsorption capacity of M3D–PAA–CCN nanocomposite was analyzed using methylene blue (MB) as a reference dye. 8.0 mg of nanocomposite was first dispersed in 1 mL of water and charged into a 50 mL aqueous MB solution (20 mg L−1) under stirring. The pH of the mixture was adjusted to 7.2 and after adsorption; the nanocomposites were separated by applying an external magnetic field. The remaining concentration of MB in the supernatant was determined by a UV-vis spectrophotometer (Shimadzu, UV-1800) at 665 nm corresponding to the maximum absorbance of MB.36,37 The adsorption capacity was monitored at different time intervals i.e. 0 min, 10 min, 20 min, 30 min, 60 min, 180 min, 360 min, 720 min, and 840 min. We also compared the adsorption capacities of M3D–PAA–CCN with M3D–PAA, a composite without CCN to justify the importance of CCN in our nanocomposite. The effects of pH on the adsorption capacities of M3D–PAA and M3D–PAA–CCN nanocomposites were also studied by repeating the same experiment at pH 3.0 and pH 9.0.Recyclability test
The recyclability study was performed using MB as the reference dye. Firstly, 20 ppm aqueous solution of MB of pH 7 was prepared and the desired pH was obtained by adding 0.1 M HCl and 0.1 M NaOH. Then adsorption test was done by adding 0.5 mL of aqueous solutions of M3D–PAA (8 mg) and M3D–PAA–CCN (8 mg) to 25 mL of MB solution under shaking at 210 rpm for 6 h. For the desorption test MB loaded composites were dispersed into 10 mL of ethanol followed by sonication for 12 min and composites were then recovered magnetically. Desorption test was repeated for five times. After every adsorption–desorption cycle, the composites were washed with 5 mL of distilled water and were magnetically separated for reuse.Characterization
The surface morphologies of Fe3O4 nanoparticles, M3D, CCN, and M3D–PAA–CCN nanocomposites were analyzed using a JEOL JSM-6400LA FESEM operated at an accelerating voltage of 5 kV. The elemental compositions of the samples were determined by an EDX spectrometer coupled with the FESEM. The infrared spectra were recorded on a Shimadzu 8400 FTIR spectrometer in the region of 4000–400 cm−1. XPS spectra were recorded using the Al Kα radiation on a Kratos Axis Ultra spectrometer operated at 12 mA and 14 kV. The peak fitting was performed by Igor Pro software. The crystallinity of Fe3O4 nanoparticles and M3D–PAA–CCN nanocomposites was confirmed by XRD analysis performed in Ultima IV X-ray diffractometer. Thermo-gravimetric analysis (TGA) was carried out using a Shimadzu thermos-gravimetric analyzer. The magnetic properties were analyzed with EV-9 Microsense (Germany) using magnetic field strength up to 10 kOe (1 Tesla) at 298 K.Results and discussion
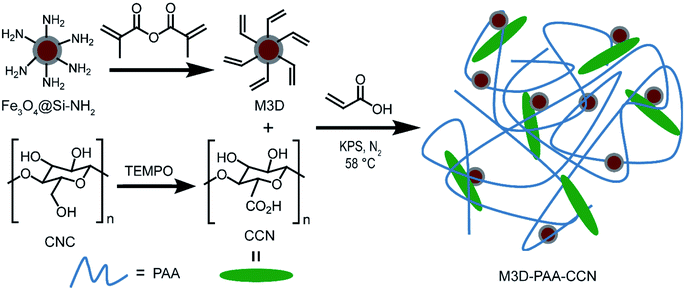
The synthesis strategy for M3D–PAA–CCN nanocomposite is shown in Scheme 1. In order to synthesize crosslinked PAA, we preferred 3D crosslinker over its linear (1D) or planar (2D) counterparts due to the higher surface area and a greater number of reactive sites. With the aim of making the nanocomposite easily separable, we incorporated magnetic property into it by covalently tethering the polymer chains with the acrylic groups of the magnetic nanoparticles, which also acted as templates for the polymer crosslinkers. Firstly, Fe3O4 nanoparticles prepared from FeCl3 and FeCl2 by the chemical co-precipitation method were coated with silica using TEOS as the silica source. The base-catalyzed (pH 9) hydrolysis of TEOS produced silicic acid, which underwent polymerization reaction leading to thin silica coating on the Fe3O4 particles.28,38 This coating prevented aggregation and surface oxidation of bare Fe3O4 nanoparticles as well as offering further surface functionalization via simple silane chemistry. The treatment of Fe3O4@Si with APTES introduced amine (–NH2) functional groups on their surface. Then the reaction of Fe3O4@Si–NH2 with methacrylic anhydride in the presence of toluene led to acrylated Fe3O4 nanoparticles i.e., our desired M3D crosslinker. Nevertheless, the crosslinking of M3D with PAA produced a gel-like composite that was difficult to separate and to use for the adsorption experiments we had aimed for. Therefore, we employed the highly dispersive CCN as fillers in situ polymerization to avoid this problem.Due to impressive mechanical properties, sustainability, low density, wide availability, and biocompatibility CNCs have become a popular constituent of polymer nanocomposites.39,40 We extracted CNCs from sawdust, a cheap and easily available source, by acid hydrolysis method.30–32 Cellulose has both amorphous and crystalline parts and acid hydrolysis of pretreated cellulose effectively breaks the glycosidic bonds of amorphous cellulose leading to the extraction of CNCs. Strong hydrogen bonding between the surface hydroxyl groups of CNCs makes it quite impossible to break the crystalline part and also increases their self-association tendency.41 TEMPO mediated oxidation of CNC to CCN converted the primary hydroxyl groups to carboxyl groups and thereby provided more negatively charged functionalities to the M3D–PAA–CCN, which are responsible for the greater electrostatic interaction required for adsorbing cationic dyes.
To confirm the stepwise surface modifications of Fe3O4 nanoparticles, FTIR spectra were recorded. For Fe3O4 a strong absorption band at around 578 cm−1 appeared due to Fe–O bond vibration,42 which is characteristic of bare Fe3O4 nanoparticles (ESI, Fig. S1†). The peaks at 1627 cm−1 and 3425 cm−1 are attributed to the O–H bending and stretching vibrations respectively arising from adsorbed H2O on the surface of Fe3O4 nanoparticles. The appearance of Si–O–Si asymmetric and symmetric stretching vibrations at 1080 cm−1 and 804 cm−1, respectively, confirms successful silica coating on Fe3O4 nanoparticles after TEOS hydrolysis.26 The appearance of N–H absorption peak at around 1557 cm−1 confirms the amine functionalization of Fe3O4@Si whereas the peak at 1665 cm−1 indicates the successful addition of vinyl group giving rise to M3D crosslinkers (Fig. 1A). In the IR spectrum of CNC (ESI, Fig. S1†), the absorption peaks at 3500, 2905, and 1054 cm−1 correspond to the O–H, C–H, and C–O stretching vibrations, respectively.43,44 The attachment of the sulfate ester group on the surface of CNC was confirmed from the appearance of the peak at 1245 cm−1 whereas the peak at 1634 cm−1 was due to the O–H bending vibration of absorbed water.45,46 The TEMPO mediated oxidation of CNC to CCN was strongly supported by the appearance of a peak at 1727 cm−1 due to –COOH group.47,48 For the M3D–PAA–CCN nanocomposite, C![[double bond, length as m-dash]](https://www.rsc.org/images/entities/char_e001.gif) O stretching vibration appeared at 1740 cm−1 (Fig. 1A) for the carboxylate groups of PAA.49
O stretching vibration appeared at 1740 cm−1 (Fig. 1A) for the carboxylate groups of PAA.49
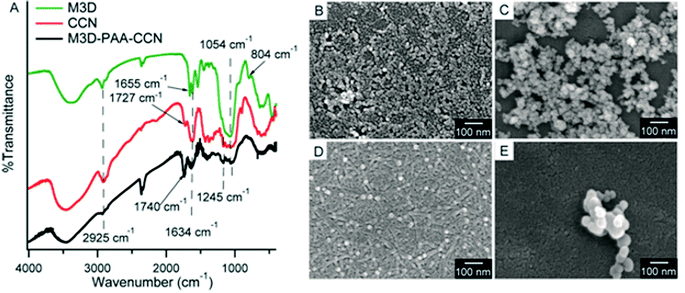 | ||
| Fig. 1 FTIR spectra of M3D (green), CCN (red), and M3D–PAA–CCN (black) (A), FESEM images of Fe3O4 nanoparticles (B), M3D (C), CCN (D), and M3D–PAA–CCN nanocomposite (E). | ||
The surface morphologies of the materials obtained in different steps of the synthesis were analyzed by monitoring the FESEM images (Fig. 1B–E). The SEM image of Fe3O4 nanoparticles revealed the presence of many small particles (∼15 nm),50 which were somewhat aggregated. Slightly greater size (20–30 nm) and less aggregation were observed for the M3D particles which might be attributed to the silica coating of Fe3O4 nanoparticles followed by their amine (–NH2) and subsequent methacrylic functionalization. Fig. 1D shows the presence of randomly arranged CCNs having needle shape with a rough surface. The length of the CCN is in the range 60–90 nm and the diameter is approximately 10–20 nm. Some white spots are also clearly visible in the SEM image of CCN which are actually spherical CCNs formed during TEMPO mediated oxidation of CNC. The appearance of spherical cellulose nanoparticles was reported previously and it was anticipated that they resulted from the self-assembly of nanocrystalline cellulose and their fragments.51,52 The M3D–PAA–CCN nanocomposite particles are spherical in shape with a diameter of 60–90 nm and the particles are clustered. The disappearance of needle-shaped CCN particles and the appearance of comparatively large spherical particles than M3D confirmed the polymerization and formation of the desired nanocomposite. The clustering tendency of the nanocomposite particles could be ascribed to the interfacial hydrogen bonds formed between the –COOH groups of the adjacent particles.52
The crystal structures of Fe3O4 nanoparticles and M3D–PAA–CCN nanocomposite were analyzed by XRD analysis (Fig. 2A). Fe3O4 nanoparticles showed six characteristic diffraction peaks at 2 theta = 30.24°, 35.56°, 43.38°, 53.88°, 57.34°, 62.82° and the peak positions were indexed at (220), (311), (400), (422), (511), (440), respectively (JCPDS card: 019-0629).50,53,54 The face-centered cubic phase of Fe3O4 nanoparticles is confirmed from the XRD spectrum, while no additional peak in the spectrum demonstrated the absence of any secondary phase in the sample. The average crystallite size of Fe3O4 nanoparticles was ∼6 nm calculated by using the Debye–Scherrer equation: Dc = Kλ/β![[thin space (1/6-em)]](https://www.rsc.org/images/entities/char_2009.gif) cos
cos![[thin space (1/6-em)]](https://www.rsc.org/images/entities/char_2009.gif) θ, where K is the space factor which is 0.9 for spherical particles, λ is the wavelength, β is the peak width at half-maximum (FWHM), and θ is the Bragg diffraction angle. The average crystallite size of the particles was calculated by using the most intense peak at 400.25 In the XRD spectrum of M3D–PAA–CCN, along with the Fe3O4 peaks a new peak (200) at 21.3° yet again confirmed the presence of CCN.55,56
θ, where K is the space factor which is 0.9 for spherical particles, λ is the wavelength, β is the peak width at half-maximum (FWHM), and θ is the Bragg diffraction angle. The average crystallite size of the particles was calculated by using the most intense peak at 400.25 In the XRD spectrum of M3D–PAA–CCN, along with the Fe3O4 peaks a new peak (200) at 21.3° yet again confirmed the presence of CCN.55,56
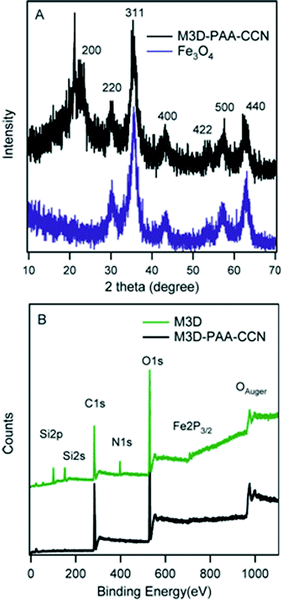 | ||
| Fig. 2 XRD spectra of Fe3O4 nanoparticles (blue) and M3D–PAA–CCN (black) (A), widescan XPS survey of M3D (green) and M3D–PAA–CCN (black) (B). | ||
The elemental compositions of M3D and M3D–PAA–CCN were obtained from both XPS and EDX (ESI, Fig. S2†) analyses. The XPS survey spectrum (Fig. 2B) of M3D shows the peaks for C1s (284.3 eV), O1s (529.6 eV), OAuger (974.0 eV), N1s (397.2 eV), Si2s (150.8 eV), Si2p (100.4 eV), and Fe2p3/2 (710.4 eV) and EDX analysis also confirms the presence of these elements. From XPS and EDX oxygen atomic percentages were 46 and 42 whereas carbon atomic percentages were 29 and 26, respectively (ESI, Table S1†). Although the percentages of N and Si were very close for both techniques, a noticeable difference was observed for Fe% i.e., 8% and 15% according to XPS and EDX, respectively. The lower atomic percentage of Fe obtained by XPS can be attributed to the inherent probing depths of the respective techniques.21 On the other hand, 60% of carbon and 35% of oxygen were found in M3D–PAA–CCN from the widescan XPS analysis. However, the N1s, Si2s, and Si2p peaks on the low-resolution XPS spectrum of M3D–PAA–CCN were barely detectable and no peak for Fe2p was observed since XPS is highly surface sensitive and probe only the top surface of a composite material up to about 10 nm.57
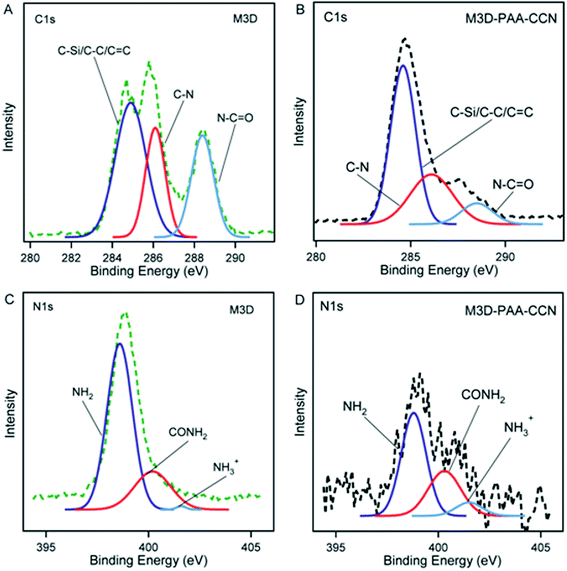
The high resolution C1s and N1s XPS spectra of M3D and M3D–PAA–CCN are shown in Fig. 3. The deconvolution of C1s spectra gave rise to three peaks at 284.9 eV, 286.1 eV, and 288.4 eV which were assigned to C–C/C–Si/C![[double bond, length as m-dash]](https://www.rsc.org/images/entities/char_e001.gif) C, C–N, and N–C
C, C–N, and N–C![[double bond, length as m-dash]](https://www.rsc.org/images/entities/char_e001.gif) O groups, respectively. The appearance of the peaks representing C–Si, C–N bonds confirm silica coating of Fe3O4 nanoparticles followed by amine functionalization with APTES leading to Fe3O4@Si–NH2. The increase in C–C and C–N bond percentages in M3D–PAA–CCN compared to M3D results from the introduction of PAA and CCN. The treatment of Fe3O4@Si–NH2 with methacrylic anhydride led to the formation of amide bond giving rise to XPS peaks for N–C
O groups, respectively. The appearance of the peaks representing C–Si, C–N bonds confirm silica coating of Fe3O4 nanoparticles followed by amine functionalization with APTES leading to Fe3O4@Si–NH2. The increase in C–C and C–N bond percentages in M3D–PAA–CCN compared to M3D results from the introduction of PAA and CCN. The treatment of Fe3O4@Si–NH2 with methacrylic anhydride led to the formation of amide bond giving rise to XPS peaks for N–C![[double bond, length as m-dash]](https://www.rsc.org/images/entities/char_e001.gif) O and also C
O and also C![[double bond, length as m-dash]](https://www.rsc.org/images/entities/char_e001.gif) C. The deconvoluted peak areas of the respective chemical bonds were used to calculate the bond percentages as given in Table 1. The N–C
C. The deconvoluted peak areas of the respective chemical bonds were used to calculate the bond percentages as given in Table 1. The N–C![[double bond, length as m-dash]](https://www.rsc.org/images/entities/char_e001.gif) O bond percentage decreases from 26.6% in M3D to 9.7% in M3D–PAA–CCN since this group is less exposed in the nanocomposite. Again, the N1s XPS spectra of M3D and M3D–PAA–CCN were deconvoluted into three component peaks centered at 398.6 eV, 400.2 eV, 401.6 eV and were assigned to –NH2, –CONH2, and –NH3+ functional groups, respectively. The percentage of –NH2 group decreases from 74.9 to 58.6 for M3D–PAA–CCN compared to M3D since 8.7% –NH2 groups are functionalized to amide (–CONH2) groups and 7.6% –NH2 groups remain as protonated amino groups (NH3+).58
O bond percentage decreases from 26.6% in M3D to 9.7% in M3D–PAA–CCN since this group is less exposed in the nanocomposite. Again, the N1s XPS spectra of M3D and M3D–PAA–CCN were deconvoluted into three component peaks centered at 398.6 eV, 400.2 eV, 401.6 eV and were assigned to –NH2, –CONH2, and –NH3+ functional groups, respectively. The percentage of –NH2 group decreases from 74.9 to 58.6 for M3D–PAA–CCN compared to M3D since 8.7% –NH2 groups are functionalized to amide (–CONH2) groups and 7.6% –NH2 groups remain as protonated amino groups (NH3+).58
| Bonds | C1s | Bonds | N1s | ||||||
|---|---|---|---|---|---|---|---|---|---|
| M3D | M3D–PAA–CCN | M3D | M3D–PAA–CCN | ||||||
| B.E. | % | B.E. | % | B.E. | % | B.E. | % | ||
| C–C | 284.9 | 48.3 | 284.6 | 59.1 | NH2 | 398.6 | 74.9 | 398.8 | 58.6 |
| C–N | 286.1 | 25.1 | 286.1 | 31.2 | CONH2 | 400.2 | 24.5 | 400.3 | 33.2 |
N–C![[double bond, length as m-dash]](https://www.rsc.org/images/entities/char_e001.gif) O O |
288.4 | 26.6 | 288.5 | 9.7 | NH3+ | 401.6 | 0.6 | 401.5 | 8.2 |
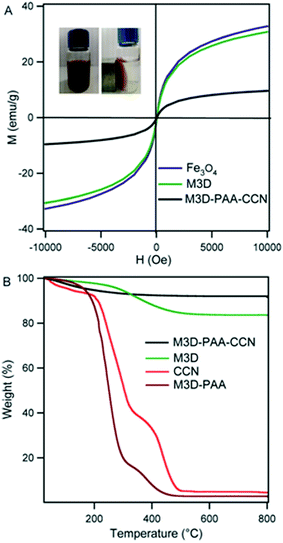
Fig. 4A represents the magnetic behavior of Fe3O4 nanoparticles, M3D, and M3D–PAA–CCN nanocomposite. At room temperature, S-like magnetic hysteresis was obtained and the saturation magnetization (Ms) values of Fe3O4 nanoparticles, M3D, and M3D–PAA–CCN composite were 32, 30, and 9.6 emu g−1, respectively. The decrease in the Ms value of the M3D–PAA–CCN composite compared to bare Fe3O4 nanoparticles and M3D is obviously attributed to the major contribution of polymer to the mass of the composite. However, the aim of introducing magnetic nanoparticles was the easy recovery of the composites from the application sites with the help of an external magnetic field. The measured magnetic response of M3D–PAA–CCN nanocomposite was sufficient enough to recover them completely thus facilitating the reusability. The inset in Fig. 4A shows the aqueous solution of M3D–PAA–CCN nanocomposite (left) and the complete separation of M3D–PAA–CCN from the aqueous solution in the presence of an external magnet (right). When the magnetic bar was removed nanocomposite was dispersed again in aqueous solution after shaking.
Thermo-gravimetric analysis (TGA) was performed to study the thermal stability of CCN, M3D crosslinker, M3D–PAA–CCN nanocomposite and nanocomposite without CCN, i.e., M3D–PAA (Fig. 4B). The weight loss observed for all the samples below 150 °C was due to the evaporation of imbibed water and moisture. In case of M3D 13% weight loss was observed within 221–487 °C due to the degradation of oxygen containing functional groups.12 CCN showed around 7% moisture loss. The onset decomposition temperature for CCN was 186 °C leading to an exotherm around 200–338 °C due to the decarboxylation of surface carboxyl groups. For both CCN and M3D–PAA, an exotherm appeared above 360 °C resulting from the burning of carbon.12 The composite M3D–PAA was found to be less stable compared to M3D crosslinker and CCN whereas the incorporation of CCN into the composite caused significant increase in the thermal stability. The gel like structure of M3D–PAA (ESI, Fig. S3†) caused greater extent of water adsorption leading to significant weight loss during the TGA analysis. The use of CCN changed the gel like composite into highly dispersive one causing much less water adsorption by the nanocomposite and a weight loss of only 6% was observed for M3D–PAA–CCN. No weight loss was observed above 500 °C for any of these samples within the studied range.
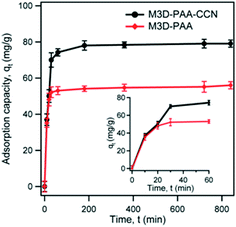
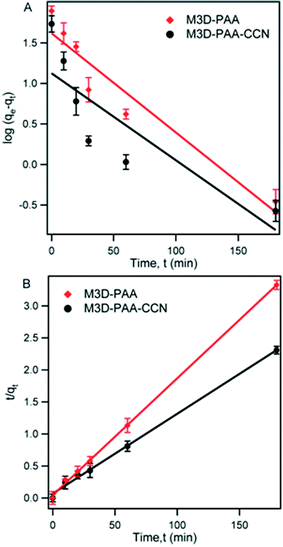
The dye removal ability of synthesized composites was investigated by monitoring the amount of adsorbed MB dye on M3D–PAA–CCN and M3D–PAA composites by batch tests. Fig. 5 shows the plot of adsorption capacity, qt of MB on M3D–PAA–CCN and M3D–PAA as a function of time, t. According to Fig. 5 the adsorption of MB dye on the nanocomposites can be divided into three consecutive steps. During the initial step of the adsorption process the rate of adsorption of MB was very fast and more than 70% adsorption occurred within the first 30 min (see inset of Fig. 5). This was followed by the second step in which gradual adsorption of MB was observed from 30 to 180 min while approaching equilibrium. The initial rapid adsorption rate can be attributed to the availability of vacant adsorption sites. With time the proportion of available adsorption sites decreases and equilibrium is reached.36,37 However, the adsorption capacity (qt) of MB on M3D–PAA–CCN was much higher than on M3D–PAA. For instance, at 30 min, qt = 70 mg g−1 and 52 mg g−1 for M3D–PAA–CCN and M3D–PAA, respectively, strongly suggesting that the incorporation of CCN into the composite significantly improved the dye removal capacity.
The kinetic behavior of MB adsorption onto M3D–PAA–CCN and M3D–PAA was studied following the pseudo-first and pseudo-second order kinetic models. According to pseudo-first-order kinetic model, the adsorption rate is proportional to the number of available adsorption sites whereas the pseudo-second-order kinetic model says that the adsorption rate is proportional to the square of the available number of adsorption sites.12 The linear form of pseudo-first-order kinetic model is:
log(qe − qt) = log![[thin space (1/6-em)]](https://www.rsc.org/images/entities/char_2009.gif) qe − k1t/2.303 qe − k1t/2.303
| (1) |
The rate equation for the pseudo-second-order kinetic model is:
 | (2) |
| Composites | qe,exp (mg g−1) | Pseudo-first-order | Pseudo-second-order | ||||
|---|---|---|---|---|---|---|---|
| k1 (min−1) | qe,cal (mg g−1) | R2 | k2 (g mg−1 min−1) | qe,cal (mg g−1) | R2 | ||
| M3D–PAA | 56.0 | 0.0018 | 17.6 | 0.5402 | 0.0025 | 54.9 | 0.9783 |
| M3D–PAA–CCN | 89.1 | 0.0033 | 24.1 | 0.8652 | 0.00032 | 90.3 | 0.9894 |
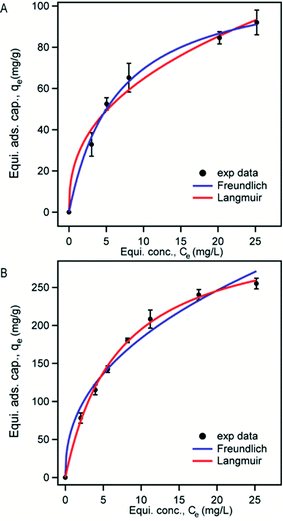
The fitting of experimental data to adsorption isotherms is an important feature of data analysis as these isotherm models provide useful information on the mechanism and the extent of interaction of adsorbates with adsorbents.59 Since Langmuir and Freundlich isotherm models fit to a variety of adsorption data very well and also possess simple isotherm expressions we analyzed our adsorption data using these two models. Langmuir model assumes only a monomolecular layer on the homogeneous adsorbent surface suggesting that there is no stacking of adsorbed molecules. On the other hand, Freundlich isotherm model is an empirical model which refers to multilayer adsorption and heterogeneous adsorbent surface.37
Langmuir isotherm equation:
 | (3) |
Freundlich isotherm equation:
| qe = KFCe1/n | (4) |
| Composites | Langmuir model | Freundlich model | |||||
|---|---|---|---|---|---|---|---|
| qm (mg g−1) | χ2 | b | KF | n | 1/n | χ2 | |
| M3D–PAA | 114 ± 5 | 45 | 0.153 | 26 ± 3 | 2.5 | 0.40 | 203 |
| M3D–PAA–CCN | 332 ± 7 | 86 | 0.131 | 68 ± 4 | 2.4 | 0.42 | 692 |
We also analyzed our data with a nonlinear chi-square test (χ2), which is a statistical tool to identify the most appropriate adsorption isotherm. The mathematical expression for χ2 is:
 | (5) |
Solution pH significantly affects the adsorption capacity of cationic dye molecules and the zeta potential of adsorbents. Therefore, we studied the effects of pH on the adsorption capacity, q, of MB on M3D–PAA and M3D–PAA–CCN within the pH range of 3–11 (Fig. 8A) and the zeta potential (Fig. 8B).36 At pH 3 M3D–PAA–CCN removed only 40% of dye and a dramatic increase in the dye removal efficiency to 80% was observed when the pH was raised to 5. It is clear from Fig. 8A that M3D–PAA–CCN offered much higher dye adsorption capacity compared to M3D–PAA throughout the experimental pH range. Although the adsorption capacity of M3D–PAA increased gradually with increasing pH from 3 to 11, this composite was able to remove only 63% of dye at pH 11 whereas M3D–PAA–CCN removed 90% of dye under the same experimental condition. This can be explained by the presence of CCN which increases the dispersiveness of M3D–PAA–CCN. Fig. 8B shows the plot of zeta potential versus pH of the solution. The magnitude of the zeta potential signifies the stability of the dispersion system. CCN (present in the nanocomposite) and acrylic acid moieties (present in both the crosslinker and the nanocomposite) carry carboxylic acid groups which undergo deprotonation at higher pH leading to negatively charged surfaces. As a result, the zeta potential of both the crosslinker (M3D) and the nanocomposite (M3D–PAA–CCN) decreases with increasing pH from 3 to 11. It should also be noted that the zeta potential of M3D–PAA–CCN is always lower than that of M3D throughout the pH range due to greater number of carboxylic groups in the nanocomposite.12 At higher pH carboxyl groups become deprotonated and therefore remain negatively charged. The adsorption of cationic MB is thus enhanced due to electrostatic interaction with negatively charged carboxyl groups.
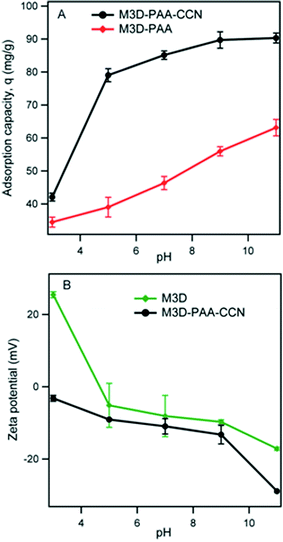 | ||
| Fig. 8 Effect of pH on the MB adsorption capacity, q on M3D–PAA and M3D–PAA–CCN (A) and the zeta potential of M3D and M3D–PAA–CCN (B). | ||
To further investigate the mode of interaction of the adsorbent and the cationic dyes, we performed the adsorption experiments using a mixture of one cationic dye such as MB and one anionic dye such as methyl orange (MO) at ambient pH. We observed that the adsorption of the dyes, MB and MO, by the as-synthesized M3D–PAA–CCN were very different as shown in Fig. 9A. The higher adsorption of MB by M3D–PAA–CCN compared to the MO demonstrated the selective adsorption of a cationic dye (MB) over the anionic dye (MO). This observation yet again confirmed that the adsorption of dyes to the M3D–PAA–CCN takes place primarily due to the electrostatic interaction between the cationic dye and negatively charged M3D–PAA–CCN composite.
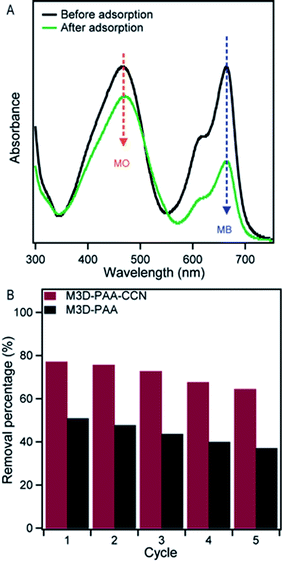 | ||
| Fig. 9 UV-visible spectra demonstrating the competitive adsorption of MB and MO by the M3D–PAA–CCN composite (A), removal percentages by M3D–PAA–CCN and M3D–PAA for 5 cycles (B). | ||
The recyclability of an adsorbent is highly important for the cost effectiveness, efficiency and practical applicability as well. Regenerability and reusability of the composites were confirmed by performing five consecutive cycles of adsorption and desorption as shown in Fig. 9B at pH 7. The UV-vis data for the recyclability at pH 7, 9, and 11 are shown in Fig. S7 (ESI†). Both M3D–PAA–CCN and M3D–PAA exhibited excellent recyclability up to 5 cycles at all pHs. The dye removal efficiency of M3D–PAA–CCN slightly dropped from 75% at first cycle to 68% at the fifth cycle, whereas the efficiency of M3D–PAA decreased from 50% to 37% at pH 7 (Fig. 9B).
Conclusion
In this report, we focused on the development of PAA functionalized magnetic 3D crosslinker and carboxylated cellulose nanocrystal based nanocomposite, M3D–PAA–CCN, for the aqueous phase adsorptive removal of cationic dye. The adsorption behavior of cationic reference dye, methylene blue, on M3D–PAA–CCN and M3D–PAA (composite without CCN) was studied by batch tests. From the kinetic studies it was clear that the adsorption of MB onto these nanocomposites took place following the pseudo-second-order model, and the equilibrium adsorption data fitted well with the Langmuir isotherm model. Both M3D–PAA–CCN and M3D–PAA showed an increase in the dye removal capacity and a decrease in the zeta potential with an increase in pH. One of the greatest findings of this work has been the improvement of the adsorption capacity of M3D–PAA–CCN via the introduction of CCN into the nanocomposite. CCN not only played an important role in improving the dispersive property but also contributed to the enhanced surface charge density of M3D–PAA–CCN owing to the greater number of deprotonated carboxyl groups on CCN. This enhanced surface charge of M3D–PAA–CCN led to notably superior electrostatic interactions with the cationic MB molecules making it more efficient in dye removal compared to M3D–PAA. For instance, M3D–PAA–CCN was able to remove 90% of dye whereas M3D–PAA removed only 65% of MB dye at pH 11. The introduction of magnetic property into the nanocomposite makes it easily separable from the application site using an external magnetic field. Thus the stability, easy magnetic separation, and improved adsorption capacity of M3D–PAA–CCN nanocomposite make it an excellent candidate for the removal of cationic dye from the polluted sites.Conflicts of interest
The authors declare no competing financial interest.Acknowledgements
The authors thank Committee for Advanced Studies and Research (CASR), BUET and Ministry of Science and Technology, the People's Republic of Bangladesh for funding. We also acknowledge the collaboration with Dr Julianne M. Gibbs (University of Alberta) for the XPS analyses.References
- A. Alqadami, M. Naushad, M. Abdalla, M. Khan and Z. Alothman, J. Chem. Eng. Data, 2016, 61, 3806–3813 CrossRef.
- A. A. Essawy, A. E.-H. Ali and M. S. A. Abdel-Mottaleb, J. Hazard. Mater., 2008, 157, 547–552 CrossRef CAS PubMed.
- S. Mani, P. Chowdhary and R. N. Bharagava, in Emerging and Eco-Friendly Approaches for Waste Management, ed. R. N. Bharagava and P. Chowdhary, Springer Nature Singapore Pte Ltd., Singapore, 1st edn, 2018, ch. 11, pp. 219–244 Search PubMed.
- S. Zhu, S. Jiao, Z. Liu, G. Pang and S. Feng, Environ. Sci.: Nano, 2014, 1, 172–180 RSC.
- R. N. Bharagava and S. Mishra, Ecotoxicol. Environ. Saf., 2018, 147, 102–109 CrossRef CAS PubMed.
- A. Yadav, P. Chowdhary, G. Kaithwas and R. N. Bharagava, in Handbook of Metal-Microbe Interactions and Bioremediation, ed. H. R. D. Surajit Das, CRC Press, Taylor & Francis Group, USA, 1st edn, 2017, ch. 9, pp. 128–141 Search PubMed.
- R. Sanghi and P. Verma, Color. Technol., 2013, 129, 85–108 CAS.
- S. Pandey, J. Y. Do, J. Kim and M. Kang, Carbohydr. Polym., 2020, 230, 115597 CrossRef PubMed.
- E. Makhado, S. Pandey and J. Ramontja, Carbohydr. Polym., 2019, 222, 114989 CrossRef CAS PubMed.
- S. Pandey, J. Mol. Liq., 2017, 241, 1091–1113 CrossRef CAS.
- S. Pandey, J. Y. Do, J. Kim and M. Kang, Int. J. Biol. Macromol., 2020, 143, 60–75 CrossRef CAS PubMed.
- J. Zhang, M. S. Azam, C. Shi, J. Huang, B. Yan, Q. Liu and H. Zeng, RSC Adv., 2015, 5, 32272–32282 RSC.
- X. Su, L. Liu, Y. Zhang, Q. Liao, Q. Yu, R. Meng and J. Yao, Bioresources, 2017, 12, 3413–3424 CrossRef CAS.
- S. Thakur, S. Pandey and O. A. Arotiba, Carbohydr. Polym., 2016, 153, 34–46 CrossRef CAS PubMed.
- M. Rana, M. Halim, S. Safiullah, M. Mollah, M. S. Azam, M. A. Gani, M. K. Hossain and M. M. Rana, J. Appl. Sci., 2009, 9, 2762–2769 CrossRef CAS.
- F. Şen, Ö. Demirbaş, M. H. Çalımlı, A. Aygün, M. H. Alma and M. S. Nas, Appl. Water Sci., 2018, 8, 206 CrossRef.
- Y. Li, H. Xiao, Y. Pan and L. Wang, ACS Sustainable Chem. Eng., 2018, 6, 6994–7002 CrossRef CAS.
- L. Huang, M. He, B. Chen, Q. Cheng and B. Hu, ACS Sustainable Chem. Eng., 2017, 5, 4050–4055 CrossRef CAS.
- X. F. Sun, B. Liu, Z. Jing and H. Wang, Carbohydr. Polym., 2015, 118, 16–23 CrossRef CAS PubMed.
- B. Chen, Y. Liu, S. Chen, X. Zhao, X. Meng and X. Pan, J. Taiwan Inst. Chem. Eng., 2016, 67, 191–201 CrossRef CAS.
- M. R. Islam, M. Ferdous, M. I. Sujan, X. Mao, H. Zeng and M. S. Azam, J. Colloid Interface Sci., 2020, 562, 52–62 CrossRef CAS PubMed.
- M. I. Sujan, S. D. Sarkar, S. Sultana, L. Bushra, R. Tareq, C. K. Roy and M. S. Azam, RSC Adv., 2020, 10, 6213–6222 RSC.
- S. S. Labana and R. A. Dickie, Characterization of highly cross-linked polymer, American Chemical Society, Washington, D.C., 1984 Search PubMed.
- J. C. Hernández-Ortiz and E. Vivaldo-Lima, in Handbook of Polymer Synthesis, Characterization, and Processing, ed. E. S. Guerra and E. Vivaldo-Lima, John Wiley & Sons, Inc., United States, 1st edn, 2013, ch. 9, pp. 187–204, DOI:10.1002/9781118480793.ch9.
- A. B. Salunkhe, V. M. Khot, J. M. Ruso and S. I. Patil, RSC Adv., 2015, 5, 18420–18428 RSC.
- Y. P. He, S. Q. Wang, C. R. Li, Y. M. Miao, Z. Y. Wu and B. S. Zou, J. Phys. D: Appl. Phys., 2005, 38, 1342–1350 CrossRef CAS.
- I. Nedkov, T. Merodiiska, L. Slavov, R. E. Vandenberghe, Y. Kusano and J. Takada, J. Magn. Magn. Mater., 2006, 300, 358–367 CrossRef CAS.
- W. Stöber, A. Fink and E. Bohn, J. Colloid Interface Sci., 1968, 26, 62–69 CrossRef.
- C. Hui, C. Shen, J. Tian, L. Bao, H. Ding, C. Li, Y. Tian, X. Shi and H.-J. Gao, Nanoscale, 2011, 3, 701–705 RSC.
- A. Kumar, Y. S. Negi, V. Choudhary and N. K. Bhardwaj, J. Mater. Phys. Chem., 2014, 2, 1–8 Search PubMed.
- A. Kumar, Y. S. Negi, N. K. Bhardwaj and V. Choudhary, Carbohydr. Polym., 2012, 88, 1364–1372 CrossRef CAS.
- K. Abe, S. Iwamoto and H. Yano, Biomacromolecules, 2007, 8, 3276–3278 CrossRef CAS PubMed.
- Y. Habibi, Cellulose, 2008, 15, 177–185 CrossRef CAS.
- T. Saito, S. Kimura, Y. Nishiyama and A. Isogai, Biomacromolecules, 2007, 8, 2485–2491 CrossRef CAS PubMed.
- T. Saito and A. Isogai, Biomacromolecules, 2004, 5, 1983–1989 CrossRef CAS PubMed.
- C. Păcurariu, O. Paşka, R. Ianoş and S. G. Muntean, Clean Technol. Environ. Policy, 2016, 18, 705–715 CrossRef.
- F. Hashem, Eur. Chem. Bull., 2013, 2, 524–529 CAS.
- F. J. Arriagada and K. Osseo-Asare, J. Colloid Interface Sci., 1999, 211, 210–220 CrossRef CAS PubMed.
- D. Klemm, B. Heublein, H. P. Fink and A. Bohn, Angew. Chem., Int. Ed., 2005, 44, 3358–3393 CrossRef CAS PubMed.
- R. J. Moon, A. Martini, J. Nairn, J. Simonsen and J. Youngblood, Chem. Soc. Rev., 2011, 40, 3941–3994 RSC.
- J. Kim, L. Zhai, S. Mun, H.-U. Ko and Y.-M. Yun, Cellulose nanocrystals, nanofibers, and their composites as renewable smart materials, SPIE, 2015 Search PubMed.
- Z. Huang and F. Tang, J. Colloid Interface Sci., 2005, 281, 432–436 CrossRef CAS PubMed.
- C. Zhou, R. Chu, R. Wu and Q. Wu, Biomacromolecules, 2011, 12, 2617–2625 CrossRef CAS PubMed.
- F. Jiang and Y.-L. Hsieh, Carbohydr. Polym., 2013, 95, 32–40 CrossRef CAS PubMed.
- J. Gu, J. M. Catchmark, E. Q. Kaiser and D. D. Archibald, Carbohydr. Polym., 2013, 92, 1809–1816 CrossRef CAS PubMed.
- F. Fahma, S. Iwamoto, N. Hori, T. Iwata and A. Takemura, Cellulose, 2010, 17, 977–985 CrossRef CAS.
- F. Azzam, L. Heux, J.-L. Putaux and B. Jean, Biomacromolecules, 2010, 11, 3652–3659 CrossRef CAS PubMed.
- X.-M. Fan, H.-Y. Yu, D.-C. Wang, Z.-H. Mao, J. Yao and K. C. Tam, ACS Sustainable Chem. Eng., 2019, 7, 18067–18075 CrossRef CAS.
- C. Liu, R.-N. Jin, X. Ouyang and Y.-G. Wang, Appl. Surf. Sci., 2017, 408, 77–87 CrossRef CAS.
- N. Akter, L. Chowdhury, J. Uddin, A. K. M. A. Ullah, M. H. Shariare and M. S. Azam, Mater. Res. Express, 2018, 5, 115007 CrossRef.
- P. Lu and Y.-L. Hsieh, Carbohydr. Polym., 2012, 87, 2546–2553 CrossRef CAS.
- Y. Hu, L. Tang, Q. Lu, S. Wang, X. Chen and B. Huang, Cellulose, 2014, 21, 1611–1618 CrossRef CAS.
- Y. Liang, X. He, L. Chen and Y. Zhang, RSC Adv., 2014, 4, 56883–56891 RSC.
- Y. Huang, Y. Wang, Q. Pan, Y. Wang, X. Ding, K. Xu, N. Li and Q. Wen, Anal. Chim. Acta, 2015, 877, 90–99 CrossRef CAS PubMed.
- H.-Y. Yu, D.-Z. Zhang, F.-F. Lu and J. Yao, ACS Sustainable Chem. Eng., 2016, 4, 2632–2643 CrossRef CAS.
- L. Zhou, N. Li, J. Shu, Y. Liu, K. Wang, X. Cui, Y. Yuan, B. Ding, Y. Geng, Z. Wang, Y. Duan and J. Zhang, ACS Sustainable Chem. Eng., 2018, 6, 12403–12410 CrossRef CAS.
- J. B. Gilbert, M. F. Rubner and R. E. Cohen, Proc. Natl. Acad. Sci. U. S. A., 2013, 110, 6651–6656 CrossRef CAS PubMed.
- Y. Zubavichus, M. Zharnikov, A. Shaporenko, O. Fuchs, L. Weinhardt, C. Heske, E. Umbach, J. D. Denlinger and M. Grunze, J. Phys. Chem. A, 2004, 108, 4557–4565 CrossRef CAS.
- D. G. Kinniburgh, Environ. Sci. Technol., 1986, 20, 895–904 CrossRef CAS PubMed.
- F. Haghseresht and G. Q. Lu, Energy Fuels, 1998, 12, 1100–1107 CrossRef CAS.
- S. Yusan, N. Yenil, S. Kuzu and M. Aslani, J. Chem. Eng. Data, 2011, 56, 2013–2019 CrossRef CAS.
- K. Y. Foo and B. Hameed, Chem. Eng. J., 2010, 156, 2–10 CrossRef CAS.
- H. Shi, W. Li, L. Zhong and C. Xu, Ind. Eng. Chem. Res., 2014, 53, 1108–1118 CrossRef CAS.
- Y. Hua, J. Xiao, Q. Zhang, C. Cui and C. Wang, Nanoscale Res. Lett., 2018, 13, 99 CrossRef PubMed.
- H. Su, W. Li, Y. Han and N. Liu, Sci. Rep., 2018, 8, 6506 CrossRef PubMed.
Footnote |
| † Electronic supplementary information (ESI) available. See DOI: 10.1039/d0ra00604a |
| This journal is © The Royal Society of Chemistry 2020 |

