
 Open Access Article
 This Open Access Article is licensed under a Creative Commons Attribution-Non Commercial 3.0 Unported Licence
Sustainable oxidation of cyclohexane catalyzed by a VO(acac)2-oxalic acid tandem: the electrochemical motive of the process efficiency†
Alexander Pokutsa *a,
Pawel Bloniarzc,
Orest Fliuntb,
Yuliya Kubaja,
Andriy Zaborovskyia and
Tomasz Paczeŝniakc
*a,
Pawel Bloniarzc,
Orest Fliuntb,
Yuliya Kubaja,
Andriy Zaborovskyia and
Tomasz Paczeŝniakc
aDepartment of Physical Chemistry of Fossil Fuels, Institute of Physical Organic Chemistry and Chemistry of Coal NAS of Ukraine, Naukova Str., 3A, Lviv 79060, Ukraine. E-mail: apokutsa@ukr.net; Fax: +38 032 263 51 74; Tel: +38 032 263 51 74
bIvan Franko National University of Lviv, Faculty of Electronics and Computer Technologies, Dragomanov Str., 50, Lviv, 79005, Ukraine. E-mail: orf@online.ua
cRzeszow University of Technology, P. O. Box 85, 35-959 Rzeszow, Poland. E-mail: bloniarz@prz.edu.pl
First published on 17th March 2020
Abstract
Cyclohexane oxidation by H2O2 to cyclohexanol, cyclohexanone, and cyclohexylhydroperoxide under mild (40 °C, 1 atm) conditions is significantly enhanced in the system composed of VO(acac)2 (starting catalyst) and small additives of oxalic acid (process promoter). In corroboration of this, several times higher yield of the desired products was obtained compared to that obtained in the acid-free process. The revealed advantage was addressed to elevate the electrical conductance G (or vice versa, decreasing the resistance, 1/G) of the reaction medium. On the other hand, the content of oxalic acid (20–30 mM) was compulsory to optimize the process parameters. The last value of concentration affords, besides the lowest 1/G, the utmost impact on pH, redox potential, and current–voltage relationships. Exceeding this level leads to an increase in 1/G of the reaction solution, ceases the impact on pH, ORP, and CV profiles, and is detrimental for the product yield. The putative mechanism of the revealed effects has been envisaged.
1. Introduction
Cyclohexane (CyH) liquid phase homogeneous oxidation remains the key process of cyclohexanol (COL), cyclohexanone (CON), and cyclohexylhydroperoxide (CHHP) manufacturing. Because of the exceptionally high C–H BDE (about 100 kcal mol),1 the process is carried out at increased temperature (160–180 °C) and air pressure (13–15 atm) in presence of Co(II) catalysts. Despite such severe conditions, the commercialized process is characterized by very low (4–6%) substrate conversion and moderate (75–80%) selectivity by the COL + CON mixture.2 The higher level of conversion is curbed by the free-radical mechanism responsible for the side reactions of over-oxidation that are particularly detrimental to the selectivity.3Given the commercial importance of these products in terms of the global needs in artificial fibers (nylon 6, nylon 6,6) and energy-efficient processes, any advance in this area would be of high commercial impact. On the other hand, the inactive C–H bonds make C6H12 a proper candidate for the ultimate probing of the activity of designed catalysts that is of particular interest in fundamental chemistry. Altogether, such knowledge could render the elaboration of protocols that can potentially intensify the oxidative transformation of others substrates of practical interest.
To date, numerous attempts related to the synthesis of metallocomplex catalysts constitute d-elements cations and various ligands.4,5 The alternative ways embrace the elaboration of relevant reaction medium6 as well as systems that are able to mimic the work of metalloenzymes (e.g., methane monooxygenase).7,13 The benefits of such strategy sometimes, but not always, embrace the C–H bond activation and, as a result, enhance the process effectiveness.8 However, the commercial implementation of such technologies still lack acceptable productivity/cost ratio.
The versatile and inexpensive methods of C–H bond functionalization were found to use Schiff bases, alkanolamines, phenolamines,9 pyridine-2-carboxylic acid (PCA) accompanied with ketone (butanedione),10 and N-hydroxyphthalimide (NHPI),11 which noticeably increase the oxidation efficiency. Inspired by the cited studies, we scrutinized the activation abilities of glyoxal as a simpler analog of butanedione where CH3-groups are substituted by H-atoms.12 On the other hand, since oxalic acid (OxalH) was the product of glyoxal oxidation,14 its potential impact on the studied process was also investigated. As revealed, the yield of the products can be sufficiently improved by application of the VO(acac)2 catalyst together with OxalH.12 The mechanism of this phenomenon embraces the in situ generation of VO(oxalate)2, which can consequently interact with H2O2. Among others, it leads to the species composed of the VO(η2-O)2 core, which manifests itself as a selective (contrary to the free radicals) and active oxygenation agent.14
Most previously undertaken studies involve traditional chemical approaches to assess the enhancing effect of catalysts and additives on the process efficiency. On the other hand, the literature that elucidates the impact of electrochemical parameters on the process, apart from cyclic voltammetry (CV) studies, remains rather short and covers pure solvents only.15,16 In view of this, we decided to examine the ability of reaction medium constituents (e.g., catalyst, mediator, and oxidant) to modify the electrochemical properties other than the well-studied pH or current–voltage relationships. Working on this problem established that the effectiveness of cyclohexane oxidation is dependent on the relative dielectric permittivity of the reaction solution,17 whilst the electric conductance G (or vice versa electric resistance, 1/G) alteration accompanied by electric current–potential and pH dependencies have not been investigated yet although they may also affect the oxidation process.
In order to study the influence of selected electrochemical parameters on the process yield and mechanism, catalytic tests were undertaken together with impedance, CV, and pH measurements. The outcome of such an approach is reported herein.
2. Experimental
2.1 Materials
A commercial aqueous solution of hydrogen peroxide (35 wt%, Fluka) was concentrated to 70 wt% by vacuum distillation at 45 °C/10 mm Hg (caution: risk of explosion. All glassware has to be thoroughly rinsed with distilled water to remove traces of any heavy metals). As the purity of commercial VO(acac)2 (Aldrich) is ca. 95%, it was dissolved in MeCN to obtain a saturated solution, which was then filtered through a micro-porous paper filter. The filtrate was evaporated at 40 °C under reduced pressure and the resulting solid was dried under vacuum at 20 °C for 48 h, leading to tiny dark-green (0.5–1.0 mm) crystals, which were used in the oxidation experiments. Cyclohexane, acetonitrile, triphenylphosphine (Ph3P), and tetra-n-butyl ammonium perchlorate (Aldrich) were analytical grade and used as received.2.2 Analytical techniques
The set of selected analytical methods, namely, gas–liquid chromatography (GLC), impedance, CV, pH, and iodometry, have emerged as non-invasive tools that provide evidences concerning the process mechanism.The low-frequency complex dielectric spectra of the studied solutions can be well fitted with the equivalent electrical circuit containing dispersive power capacitor (B, n) and equivalent electrical RvCV circuit in series (the principal electrical Scheme S1 of this device and relevant explanations are given in the ESI†). Fitting the low-frequency dielectric spectra allows to obtain the true non-dispersive values of volume conductance/resistance and relative dielectric constant of the solutions under study that is not possible by usual direct current techniques. Solutions conductance G equals 1/Rv. The detailed description of application GLC, impedance, CV, pH, and iodometric methods has been provided earlier.14,17
2.3 Cyclohexane oxidation
The experiments were carried out in 25 mL round bottom glass flasks equipped with a reflux condenser and a magnetic stirrer. In a typical experiment, cyclohexane (3.36 g, 40 mmol) was dissolved in MeCN (15 mL) containing VO(acac)2 (0.0032 g, 0.012 mmol) and oxalic acid (0.038 g, 0.3 mmol). The mixture was preheated at 40 °C for 5 min before the addition of H2O2 (1.34 g, 40 mmol). This moment corresponds to the beginning of the oxidation reaction. Usually, the reaction was carried out for 5 h under atmospheric pressure and vigorous stirring. The reaction mixture was sampled in regular intervals and analyzed by iodometry and GLC (Hewlett-Packard 5890, Series II, flame-ionization detector, capillary column 30 m × 0.25 mm, immobile phase HP-Innowax) and LKhM-80 (flame-ionization detector, packed column 3 m × 3 mm, immobile phase OV-17 on Chromaton N-AW, internal standard 1-heptanol. More details concerning this analysis can be found in previous works.14,17).3. Results and discussion
3.1 Steering the oxidation process by oxalic acid additives
| Entry | VO(acac)2 × 10³, M | OxalH × 103, M | ΔCyH% | Selectivity, mol% | TON | ΔH2O2b, % | EffH2O2c, % | ||
|---|---|---|---|---|---|---|---|---|---|
| COL | CON | CHHP | |||||||
| a [CyH]0 = [H2O2]0 = 1.8 M; [VO(acac)2]0 = 0.06 × 10⁻³ M. MeCN, 40 °C, 5 h.b Amount of H2O2 consumed.c EffH2O2 is the ratio of stoichiometric (due to the product yield) amount of H2O2 divided by the H2O2 consumed (considering that from 2 g mol of H2O2, 1 g atom of O2 can be produced; thus, up to 50% of H2O2 taken can be used for the purpose of oxidation).d [CyH]0 = 0.18 M.e Co(acac)2 was used instead of VO(acac)2. ΔCyH (substrate conversion) coincides with the product yield according to the almost 100% process selectivity (besides COL, CON, and CHHP, any products, for e.g., adipic acid or caprolactam were not detected). N/r – not reckoned. | |||||||||
| 1 | 0.06 | — | <0.1 | — | — | — | — | ≈1 | n/r |
| 2 | 0.6 | — | 1.2 | 33 | 62 | 5 | 23 | 48 | 4.2 |
| 3 | 0.6 | 1.0 | 1.7 | 1 | 8 | 91 | 51 | 52 | 6.5 |
| 4 | 0.6 | 15 | 5.3 | 48 | 7 | 45 | 169 | 96 | 11.0 |
| 5 | 0.6 | 50 | 7.6 | 43 | 13 | 44 | 253 | 90 | 16.9 |
| 6 | 0.6 | 150 | 5.2 | 47 | 10 | 43 | 173 | 80 | 13.0 |
| 7 | 0.06 | 50 | 5.1 | 23 | 25 | 43 | 1516 | 25 | 42.4 |
| 8d | 0.06 | 15 | 30 | 22 | 44 | 34 | 944 | 34 | 17.6 |
| 9e | 0.6 | — | 0.6 | 1 | 2 | 97 | 18 | 19 | 6.5 |
| 10e | 0.6 | 15 | <0.1 | Trace | Trace | Trace | <1 | 10 | n/r |
| 11e | 0.6 | 1.0 | 0.1 | 1 | 1 | 98 | 3 | 15 | 1.5 |
 | ||
| Fig. 1 The kinetics of product accumulation (1, 3) and H2O2 consumption (2, 4) without (3, 4) and with 25 mM (1, 2) of OxalH. Oxidation conditions: C6H12 = H2O2 = 1.8 M, VO(acac)2 = 0.05 mM, 40 ○C, 5 h, MeCN. | ||
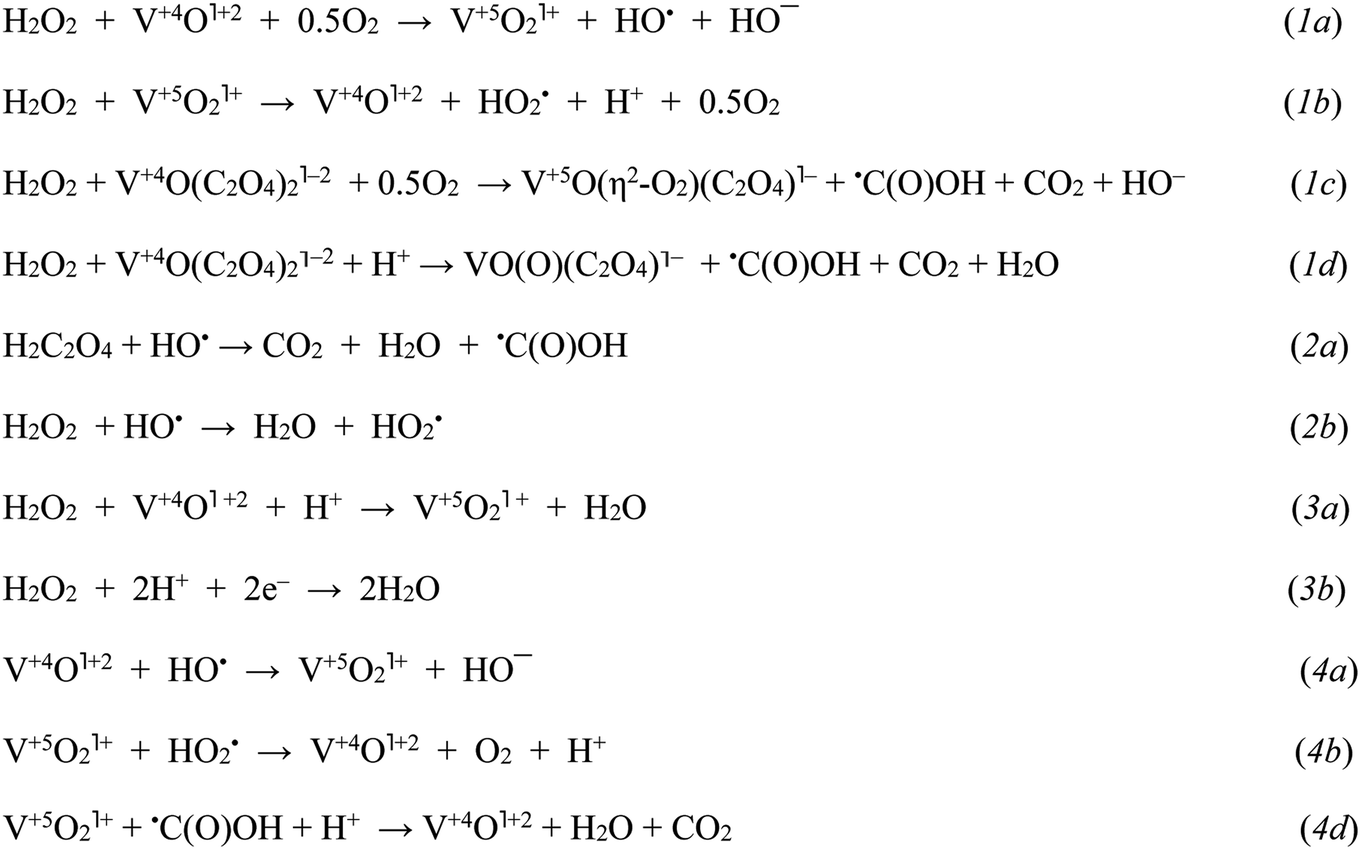 | ||
| Scheme 1 The key initial stages in H2O2 decay assisted by VO(acac)2 and VO(acac)2 + OxalH: initiation (1), propagation/degenerative branching (2), heterolytic cleavage (3), and termination (4), respectively. The steps involving the participation of radicals originating from the CHHP homolysis are omitted for the sake of simplicity (mechanism of CHHP decay induced by radicals is given in Scheme 2 and reported earlier).14 Steps (1a) and (1b) display the Haber–Weiss cycle.21 | ||
The highly reactive RO˙ radicals as well as (although to a lesser degree) ROO˙ radicals trigger the cascade of free radical transformations of the substrate to CHHP.14 As soon as the last product emerges, the –O–O– bonds can be easily broken by the assistance of cations or free radicals (Scheme 1, reaction (2b); Scheme 2). Given the Table 1 and Fig. S1† data, both COL and CHHP were discerned as two principal products whereas CON was the minor one. Despite the fact that the last product of radical-induced CHHP decay should be predominant (route b and intra-molecular rearrangement route c, Scheme 2), in reality, it was COL (Table 1, Fig. S1†). Hence, one can admit that the homolysis of CHHP prevails over its radical-induced counterpart. The relative decrease in the CHHP yield was detected once the concentration of OxalH in the initial mixture started to increase (runs 4–6, Table 1). The last result could be attributed to the heterolytic decay of peroxides, which occurs preferably at low pH (reaction (3b) and the section below). Such features significantly reduce CHHP production. Similarly, a decrease in the initial concentration of C6H12 decreases the yield of C6H11OOH and leads to the product ratio of 1/2/1.5 in spite of the presence of OxalH (compare entry 6 with 8 of Table 1 and Fig. S1b with S1c†). The last feature corresponds to the much lower rate of radical propagation step stipulated by the diminished substrate content. In contrast, high catalyst concentration increases the yield of CHHP, which indicates the ubiquity of free radical transformation of the substrate (compare Fig. S1d with S1a–c†). Therefore, decreasing the relative amount of C6H11OOH may indicate partial elimination of the free radical steps from the overall process mechanism.18 The putative steps of the consecutive transformation of cyclohexylhydroperoxo radical (C1) are depicted in Scheme 2 below. More rationales concerning the mechanism of the revealed features were reported earlier.14
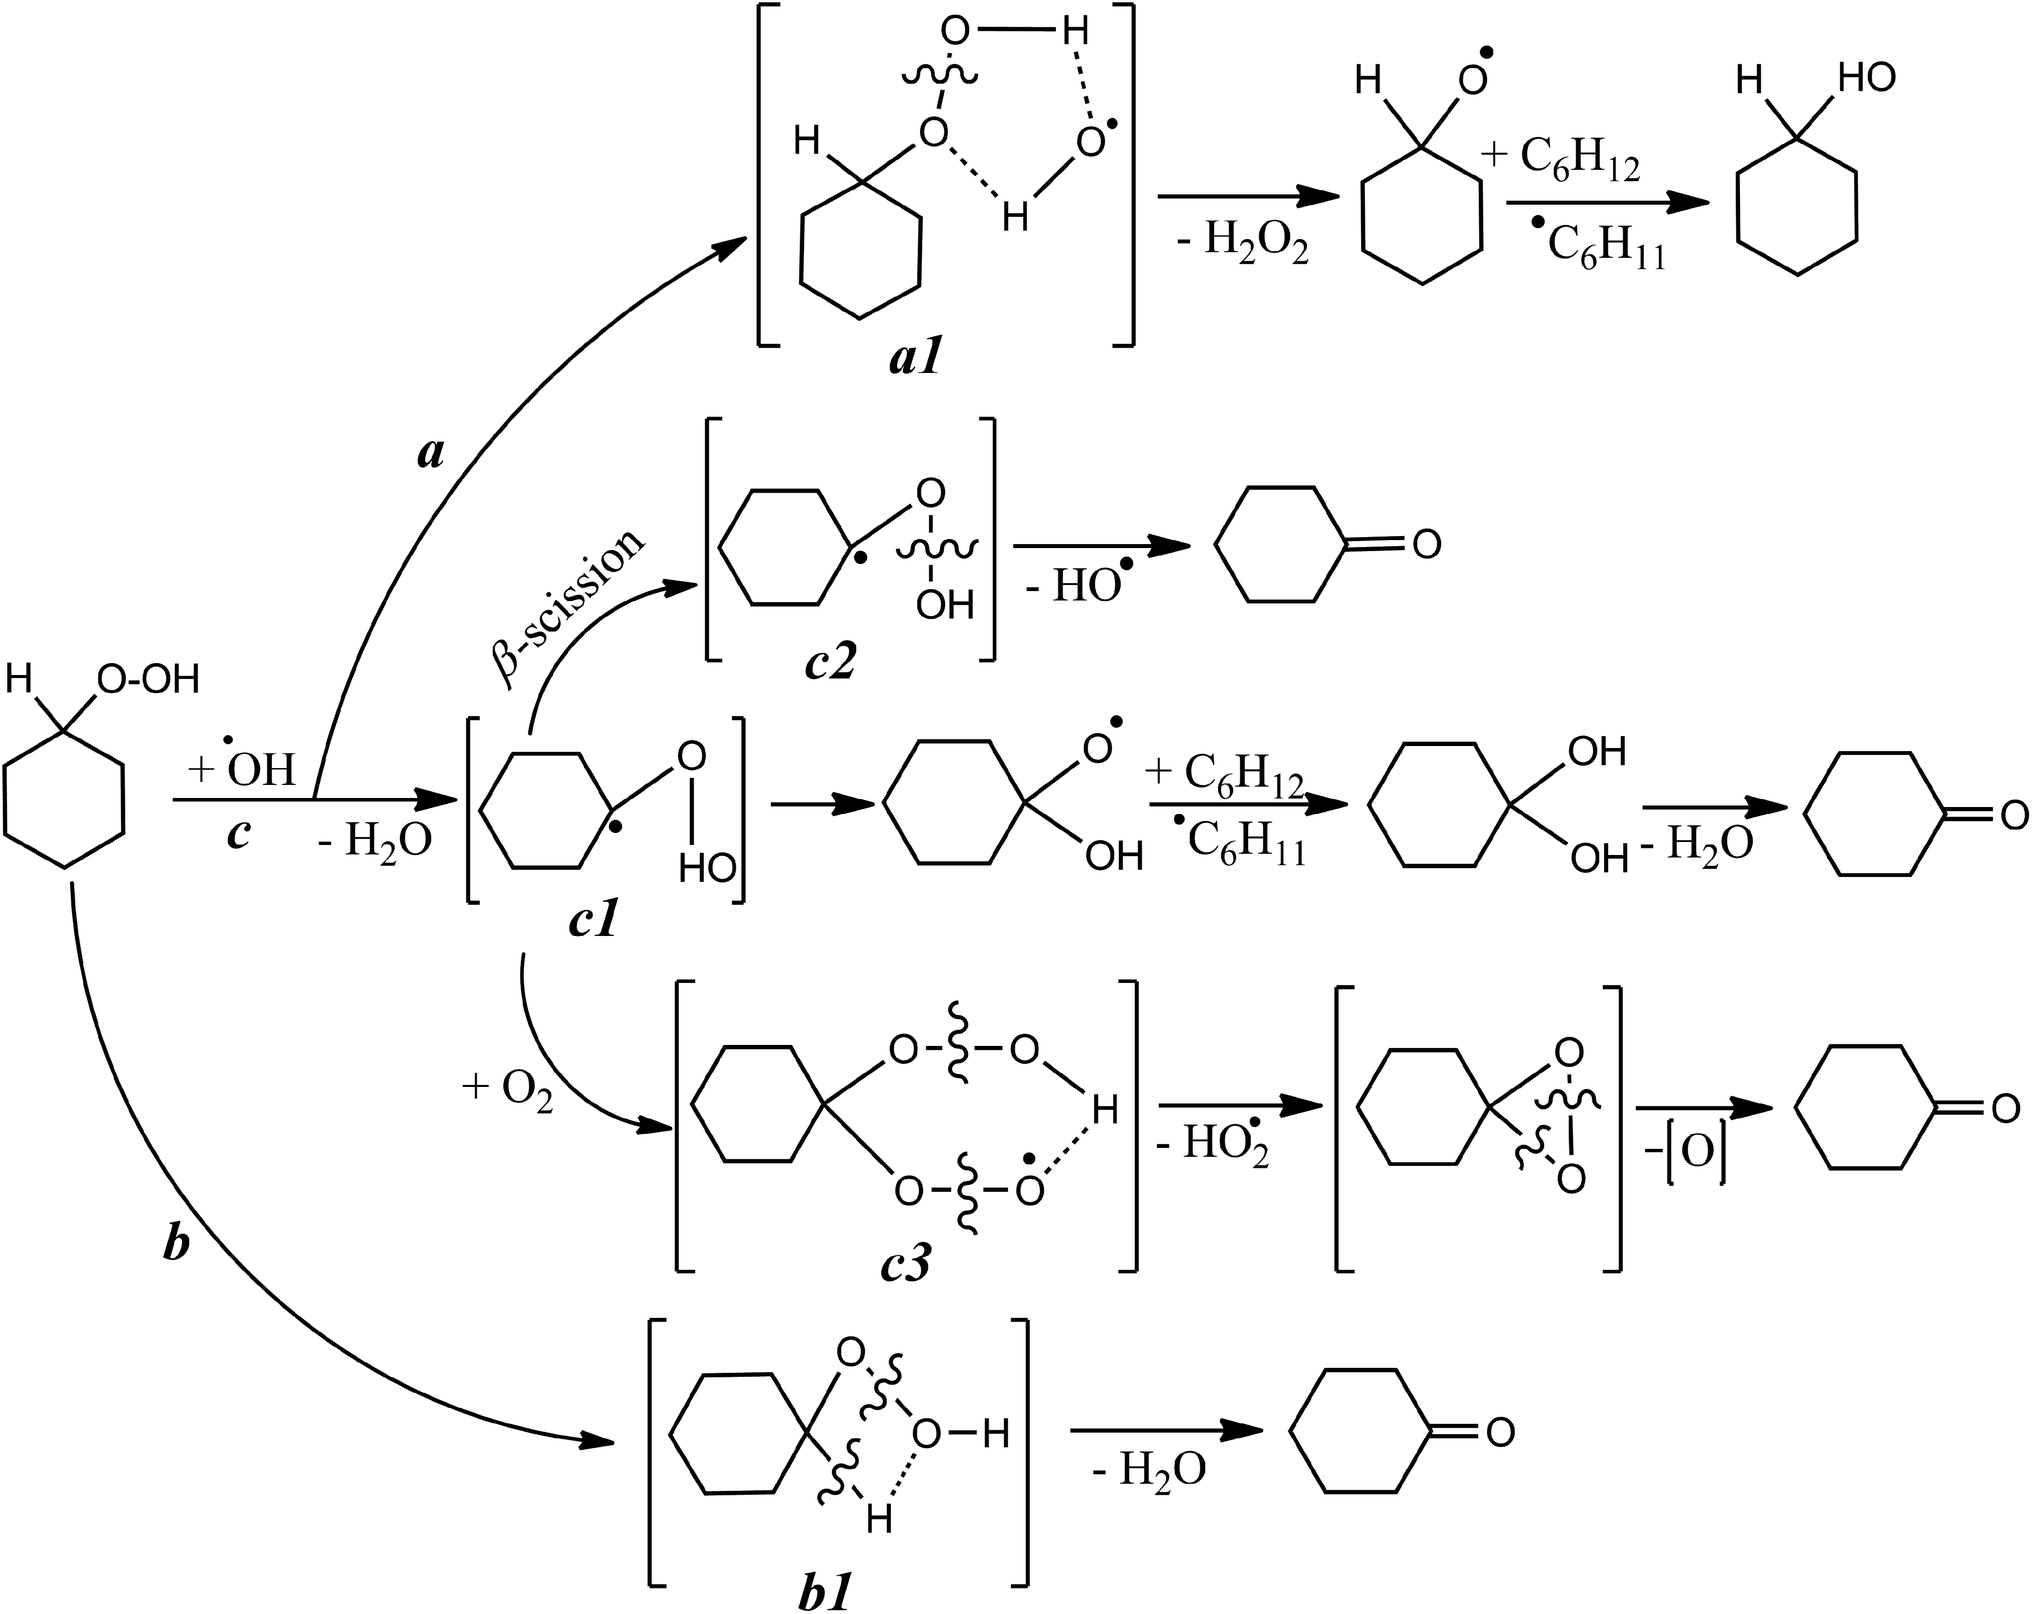 | ||
| Scheme 2 Key putative stages of radical-induced CHHP decay. For sake of clarity, the bond dissociation energy (BDE) values of –O–O– in CHHP, C–H and –OO–H were taken equal 40, 93 and 86 kcal mol−1, respectively.22,23 | ||
In order to evaluate the impact of cation nature, C6H12 oxidation was also carried out in the presence of Co(acac)2 (Table 1, entries 9–11). For this catalyst, whether oxalic acid was present in the initial reaction solution or not, the set of products (COL, CON, and CHHP) remained the same as in case of VO(acac)2. Nevertheless, the total yield was strictly dependent on the catalyst cation nature. For example, while oxalic acid additives clearly enhance the productivity of VO(acac)2-based process, the mixing of OxalH with Co(acac)2 was highly detrimental for the yield (compare entry 4 with 10 and 9 with 10, 11, Table 1). The revealed disparity in the action of oxalic acid was addressed to the noteworthy differences in the solubility of the respective oxalate salts. The reason is that right after supplementing the Co(acac)2 solution with OxalH, the resultant mixture becomes opaque and a fine salmon powder, presumably Co(II) oxalate dihydrate,19 starts to precipitate. Instead, the light-blue solution of VO(acac)2 + H2C2O4 remains transparent for weeks. Owing to the insolubility of Co-oxalate salt, one can expect that the lack of Co2+ ions in the reaction solution brings the overall process down. In the case of Co(acac)2, already minimal (1 mM) content of oxalic acid was disadvantageous with respect to the product yield, even when comparing with the one obtained in the acid-free process (run 9, 11). The value of COL/CON/CHHP distribution in acid-free Co-catalyzed oxidation (1/2/97) was rather different than that obtained from VO(acac)2 (6/12/1) (compare run 9 with 2, Table 1). In addition, these ratios differ from the COL/CON proportion (2/1) reported by Emanuel and coauthors for the Co-based process.20 The explanation of such a discrepancy is as follows: (i) the lack, at that time, of proper techniques to simultaneously distinguish between the true content of COL and CON in the mixture with CHHP (this drawback was solved much later by elaboration of the triphenylphosfine method);18 (ii) we use H2O2 as the oxidant and carry out the oxidation in MeCN solution, whereas the authors20 report the results obtained by O2-piloted oxidation carried out in bulk.
It is puzzling but apart from a very few examples,14,17 the process efficacy estimation was based on exclusively investigating the yield, conversion, and selectivity. On the other hand, establishing the effectiveness of oxidant (H2O2) consumption (EffH2O2 – a quotient between the moles of H2O2 decayed/moles of products formed) would provide us with valuable information related to both the process efficacy and mechanism. Such curiosity motivated us to fill up this lack of knowledge in the hope that such data would be meaningful for the attainment of optimal process conditions. As is apparent, the EffH2O2 value was strongly dependent on OxalH, starting from a very tiny amount of the latter (Table 1, entry 2 and 3). In order to double the discussed parameter, the OxalH/VO(acac)2 ratio should be kept above 10 (Table 1, entry 3 and 4). Further, the multiplication of OxalH content by three (run 5) or even by thirty (run 6) times led to a rather moderate (1.3 ÷ 1.5 times) increase in the EffH2O2 (Table 1). The best result was obtained when the mixture consisted of very low (0.06 mM) VO(acac)2 content and the OxalH/VO(acac)2 ratio was slightly below 1000 (run 7, Table 1). In this case, the calculated EffH2O2 value (about 42%) was close to the stoichiometric amount of oxygen that can be released in the course of H2O2 decomposition (50%). The last results correspond to the yield dependencies and supplement our early speculation about the role of OxalH in diminishing the free radical counterpart of H2O2 decay. The reason is that homolytic cleavage of peroxides led to the generation of free radicals. The last ones can further induce extra decay of H2O2 and, in turn, increase the unproductive consumption of the latter. On the contrary, in the presence of OxalH, this kind of H2O2 decomposition can be hampered to a large degree by shifting the mechanism to the non-radical domain.14 As a consequence, the overall process effectiveness increased due to both higher conversion and selectivity. The lowering of initial content of CyH from 1.8 M to 0.18 M improved the cyclohexane conversion by roughly six times (from approx. 5%, entry 4 to 30%, entry 8). Nevertheless, in the last case, the EffH2O2 value decreased by 2.5 times, probably because of lower load of OxalH (compare entry 7 and 8, Table 1).
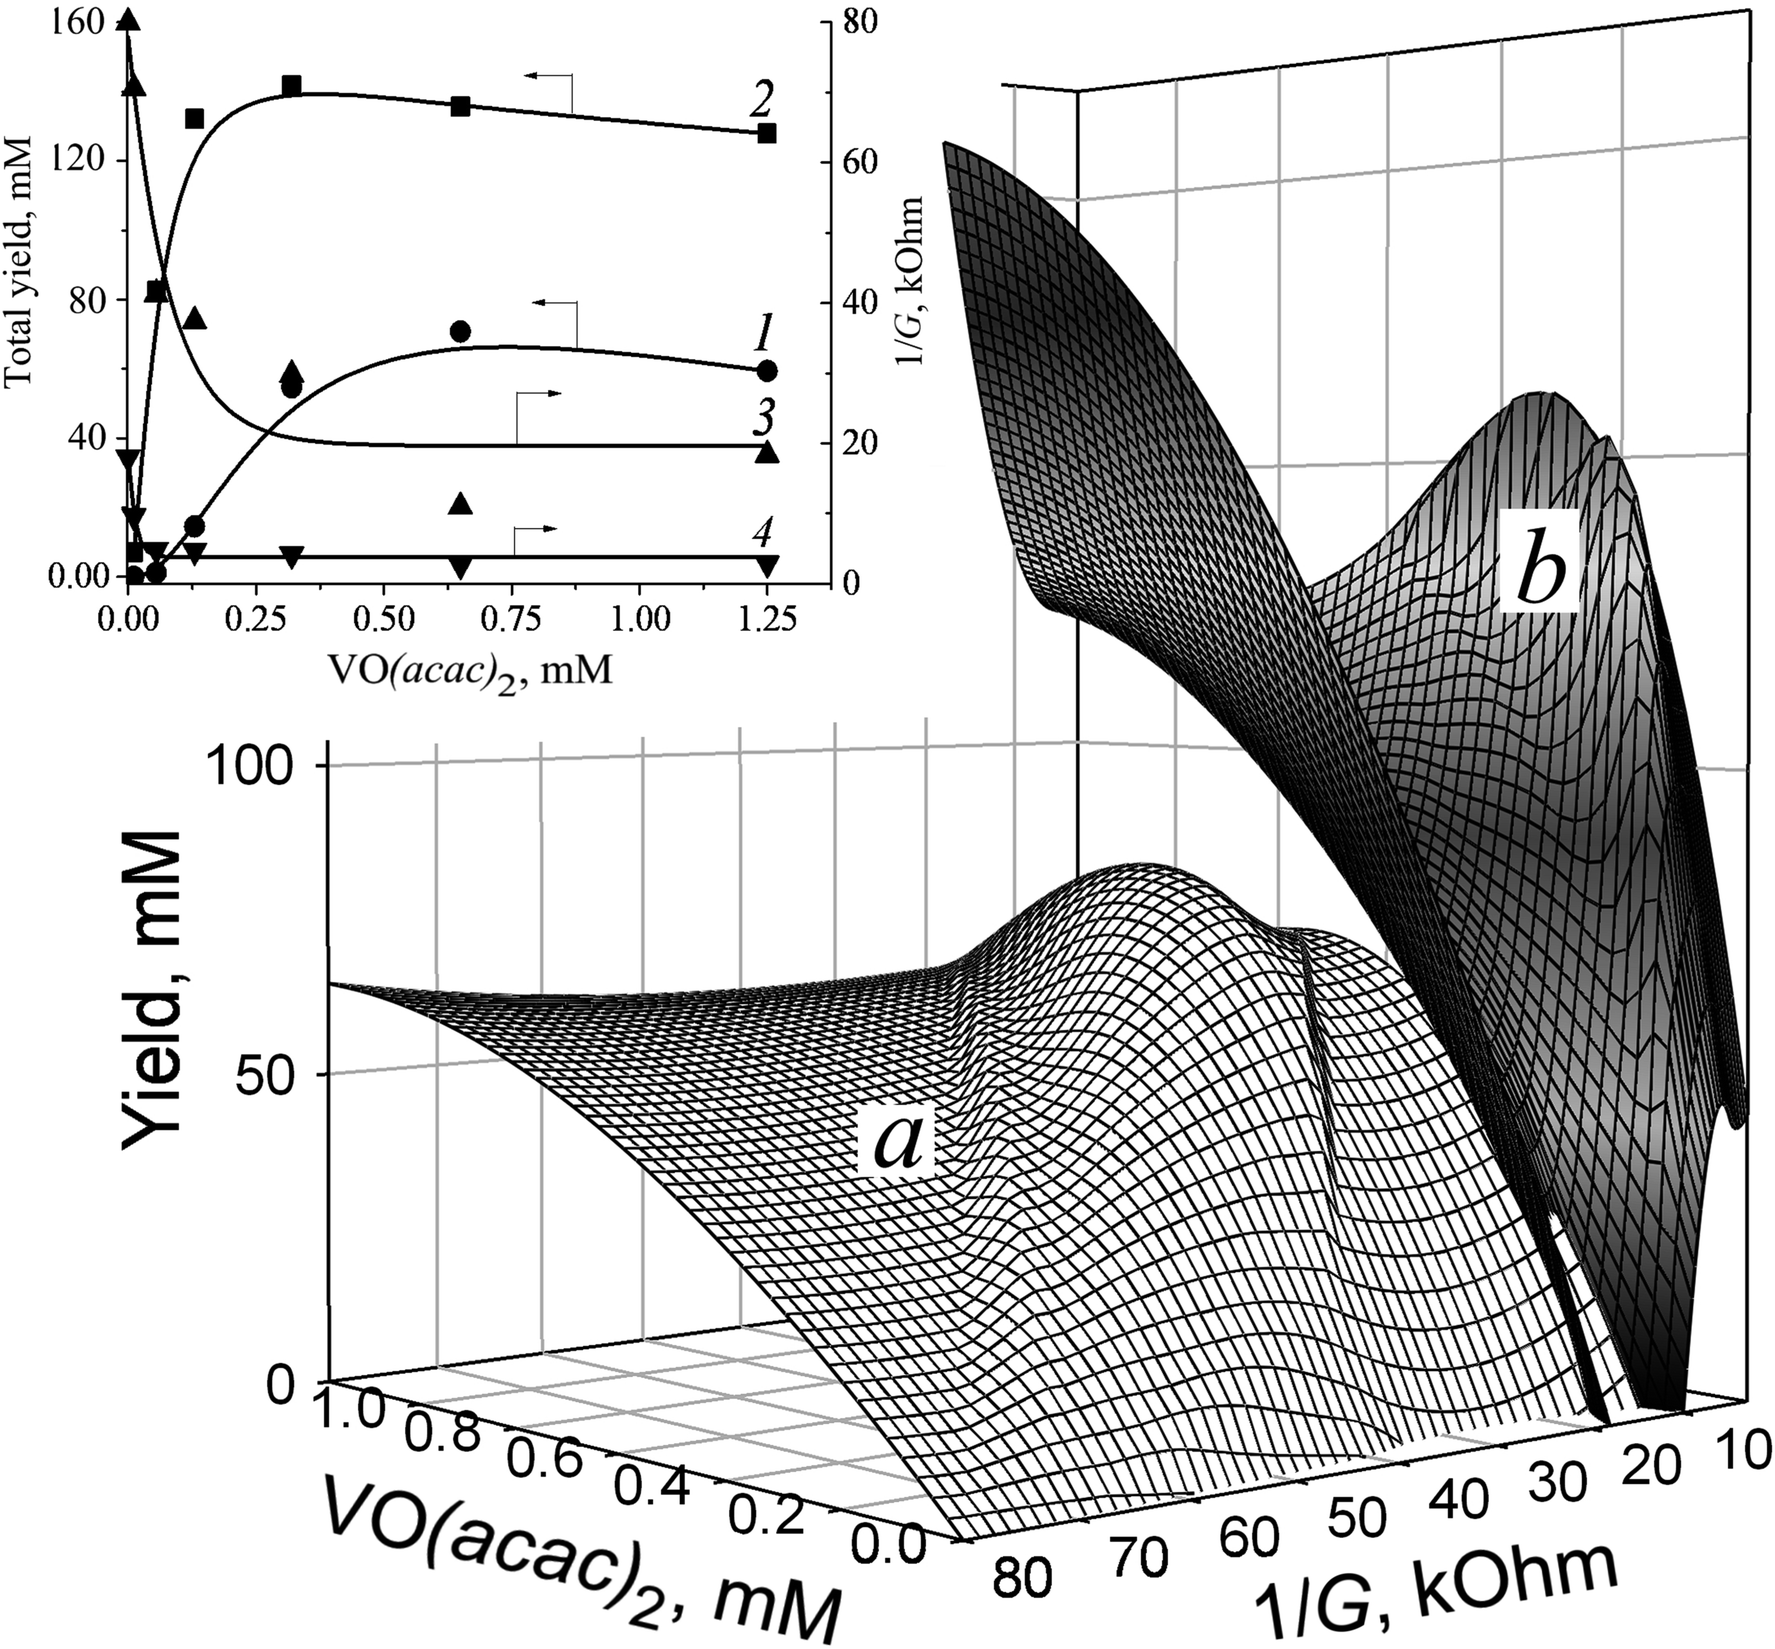 | ||
| Fig. 2 The relationships between total yield, reaction medium 1/G value, and VO(acac)2 content. (a) in the absence; (b) in the presence of 15 mM of OxalH. Inset: yield (1, 2) and 1/G (3, 4) dependence taken in the absence (1, 3) and presence (2, 4) of OxalH. Oxidation conditions: CyH = H2O2 = 1.8 M, 40 °C, 5 h, MeCN. | ||
 | ||
| Fig. 3 The relationships between OxalH concentration, reaction medium 1/G value, and product yield. Inset: yield (1) and 1/G (2) vs. oxalic acid dependence. Starting reaction conditions: C6H12 = H2O2 = 1.8 M, 0.125 mM of VO(acac)2, 40 °C, 5 h, MeCN. | ||
The decrease in the solution 1/G value caused by VO(acac)2 addition indicates that the revealed effect may be stipulated by the ions originating in the course of metal salt dissociation. The profile of 1/G vs. VO(acac)2 shows a rapid decrease till 0.20 mM concentration of the metallocomplex, followed by saturation of the investigated parameter value when its content exceeded this level (Fig. 2, inset, curve 3). The slope of this curve shows the initial drop of 350 kOhm M−1. Such a trait indicates that VO(acac)2 is a weak electrolyte.25 Exceeding the 0.20 mM concentration of VO(acac)2 in the solution does not lead to further elevation of ion concentration caused by the attainment of the dissociation/association equilibrium. In other words, at the studied experimental conditions, the concentration of the ions (VO2+ and acac−1) does not surpass 0.20 mM, regardless of the total content of the metal salts. Hence, simply increasing the content of VO(acac)2 is not enough to lessen the 1/G value. The mirror-shaped symmetry between 1/G and the yield dependence maintained within the entire interval of VO(acac)2 concentrations (curves 1 and 3) corresponds well with this assumption.
The addition of oxalic acid into VO(acac)2 solution dramatically reduces the 1/G value from 80 kOhm to 18 kOhm (Fig. 2, inset). By contrast, the initial slopes of 1/G vs. VO(acac)2 dependence for VO(acac)2 and VO(acac)2 + OxalH compositions remain almost intact and are equal 3to 50 kOhm mM−1 (curve 3) and 330 kOhm mM−1 (curve 4), respectively. In spite of that, the presence of OxalH causes the narrowing of the concentration interval of VO(acac)2 (from 0.125 ÷ 0.25 mM, curve 3 to 0.04 ÷ 0.05 mM, curve 4) within which the change in 1/G is completed. Surprisingly, the ratio of the initial/final 1/G values significantly increased from ∼4 for VO(acac)2 solution (the initial and final 1/G level is equal to 80 kOhm and 19 kOhm, respectively, curve 3) to ≈16 for the VO(acac)2 + OxalH mixture (80 kOhm and 5 kOhm, respectively, curve 4). The rationale of the revealed trait is the dominance of the reverse process (association) whenever VO(acac)2 or OxalH concentration exceeds the predetermined concentration.
The stepwise supplementation of the VO(acac)2 solution with OxalH affects both the 1/G and yield values (Fig. 2 and 3). The 3D image (Fig. 3, curve in red) indicates that this effect has, in fact, a multifactorial nature. In the beginning, up to 40 mM content, the OxalH additives afford consistent and noticeable increase in the yield. Simultaneously, with the increase in the yield, the increase in 1/G also altered but in the opposite manner, as described by the projection of the red curve on the XY plane (left wing of the blue curve, Fig. 3). Further, steadily increasing the OxalH concentration worsened the solution conductance (right wing of the blue curve) and deteriorated the yield (red curve obtained when OxalH content exceeds 40 mM). Eventually, the reason of the last peculiarity can be the competition among the dissociation/association steps similarly when VO(acac)2 is taken solely (Fig. 2 and related discussion above). Such a process may also be responsible for the revealed reduction in the conductance and associate it with the retardation of oxidation at high content of OxalH (Fig. 3). The decrease in the oxidation efficiency caused by an excess of OxalH can be attributed to the acceleration of heterolytic cleavage of H2O2 at very low pH (more details concerning issue are given below in Section 3.2).17
The concentration range of OxalH in VO(acac)2 + OxalH mixture at which the trends of both the yield and 1/G vs. OxalH dependence changed to the opposite ones was ∼20–40 mM (Fig. 3). The last value is about 50–100 times (20 mM/0.2 mM = 100) higher compared to that displayed by the VO(acac)2 solution (∼0.20 mM) (Fig. 2, inset, curve 3) and is accompanied by a conspicuous (more than four times, 90 mM/20 mM = 4.5) enhancement in the product yield (Fig. 2 and 3). Hence, one can assume that dissolving OxalH affords much more charged species that are responsible for higher conductance and presumably increases the yield as well. Again, the 4-times lower minimal value of 1/G was registered for the VO(acac)2 + OxalH system (∼5 kOhm, Fig. 3 and inset) compared to the minimal level of 1/G of about ∼20 kOhm intrinsic to the VO(acac)2 solution (Fig. 2, inset, curve 3). We explain the revealed deviation by the smooth dissociation of oxalic acid (pKaquaa = 1.27) in MeCN26 due to the similarity of the donor number of this solvent (14.1 kcal mol−1) and water (18 kcal mol−1).27 Given that the increased conductance of the systems constituted with VO(acac)2 + OxalH can be subjected to protons and, although to a lesser degree, anions. The reason is that the former species are incomparably smaller (r = 0.877 fm)27,28 than VO2+ (r = 158![[thin space (1/6-em)]](https://www.rsc.org/images/entities/char_2009.gif) 933 fm, this study) and thus, are much more mobile, bear higher charge density, and can transport a charge superior to that transported by bulky metal ions (see the paragraph below).
933 fm, this study) and thus, are much more mobile, bear higher charge density, and can transport a charge superior to that transported by bulky metal ions (see the paragraph below).
Apart from the conductance afforded by the charged species, the increase in the conductance in aprotic polar (i.e., MeCN) medium may occur via “hop-turn” mechanism, which was first suggested by Grotthuss and then by Nagle.29,30 Due to such a scenario, the formation of hydrogen bonds may occur between oxalic acid and its conjugate base HC2O4− or C2O42− (homoconjugation, Scheme 3). As a consequence, it can boost the acidity of the solution and reduce the pKa by stabilizing the conjugate base and increasing the proton-donating power of the acid.30 Such a feature may prevent the self-oligomerization of OxalH at low concentration (contrary to well-known acetic acid dimer formation) and therefore, favors the protons (i.e., charge) transfer. It can be predict qualitatively that the conductivity (or mobility of H+) should decrease as the concentration of OxalH increases (similar to the event when HCl is dissolved in water).31 Then, the association of H2C2O4 molecules as well as the reverse proton-anion coupling explains the reduction in the 1/G level and corresponds to the total and CHHP yield alteration (Table 1, Fig. 3, Scheme 2). Similarly, such a feature may be responsible for preventing the decrease in the pH level when the concentration of OxalH exceeded its predetermined concentration in the reaction mixture (Fig. 4 below).
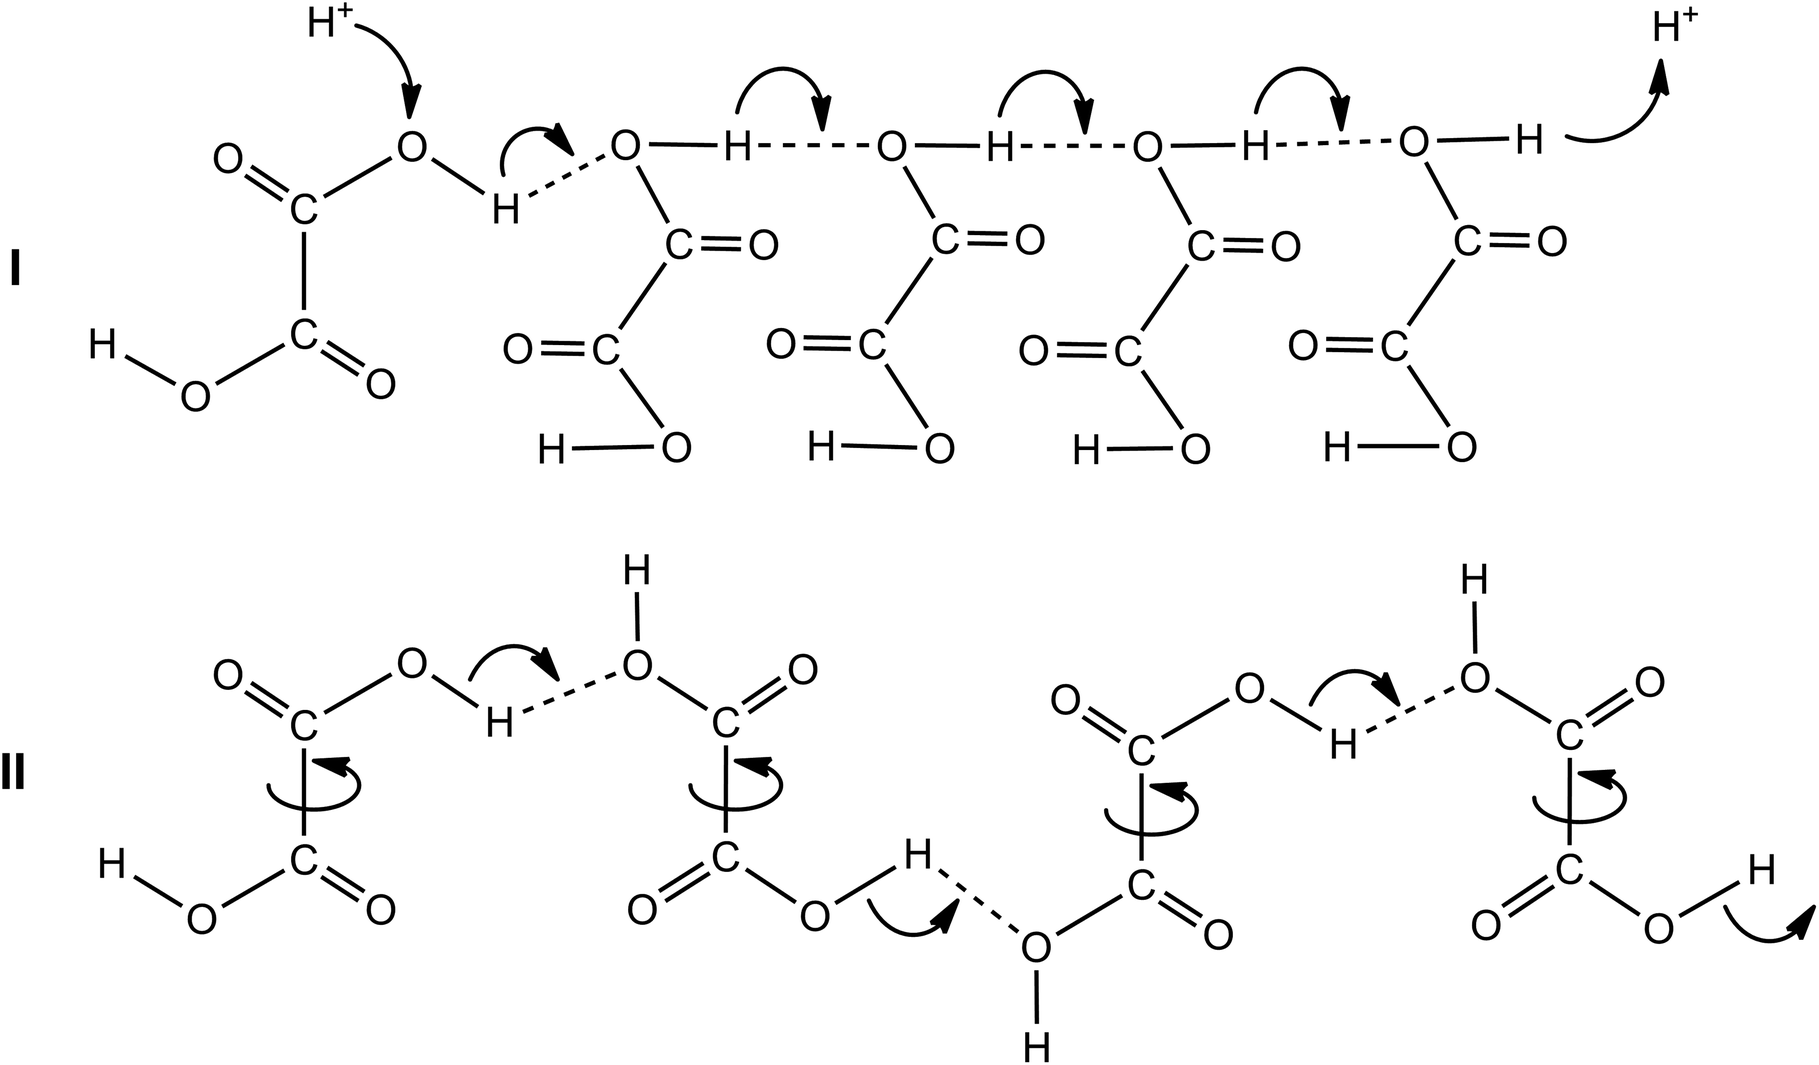 | ||
| Scheme 3 The putative “hop (I)-turn (II)” mechanism of conductance afforded by the protons of oxalic acid in polar aprotic solvent. | ||
 | ||
| Fig. 4 Time-trace of pH taken after the addition 2 μL of 35% H2O2 (corresponds to 7.5 mM of hydroperoxide in the reaction solution). The initial reaction mixtures comprise 0.75 mM VO(acac)2 (1); 0.75 mM VO(acac)2 + 0.75 mM OxalH (2); 3.0 mM VO(acac)2 + 1.4 mM OxalH (3); 0.75 mM VO(acac)2 + 1.5 mM OxalH (4) in 8 mL MeCN, 20 °C. The arrows mark the time at which H2O2 was injected. Insets: the pH (a) and Eh (b) vs. OxalH dependence (plain lines) and the impact of H2O2 on these parameters (dashed and dotted lines). (a) Plain line was plotted by the subtraction of the pH of VO(acac)2 + OxalH solutions from the pH value of initial VO(acac)2 solution (the last one was equal to 6.92); the dashed line depicts the pH of VO(acac)2 + OxalH alteration caused by H2O2 addition; the dotted line depicts the values obtained by the subtraction of the pH of VO(acac)2 + OxalH solutions from the pH level obtained once H2O2 was injected; (b) plain line demonstrates the Eh vs. OxalH dependence in the respective VO(acac)2 + OxalH solutions; the dashed line depicts the Eh vs. OxalH dependence once H2O2 was added; the dotted line was obtained by the subtraction of the Eh data of the solid line from the respective Eh value depicted by the dashed line. The Eh values were calculated using eqn (II). | ||
Together, the above results demonstrate the role that electric conductance may play in the chemical process. However, besides G, there could be additional electrochemical parameters responsible for the effectiveness of the studied system, which were not defined herein. For example, the decrease in 1/G may be accompanied with the alteration in the acidity level, thus leading to a reduction in the self-decay of, for e.g., active metal-peroxo VO(η2-O2)(oxal)– species, which is beneficial for the yield.17 The forthcoming section evaluates the expressed assumptions.
3.2 Study of the influence of oxalic acid on the pH/redox potential of the reaction medium
In order to gain more insight into the electrochemical factors that affect CyH oxidation along with 1/G, the pH/redox potential (ORP) studies were undertaken. The kinetic profiles of pH and 1/G likewise showed a decrease for the VO(acac)2 (steeper) or VO(acac)2 + OxalH (slight) solutions right after they were mixed with H2O2 (Fig. 4). Inset (a) of this figure represents a plain line with the slope of “5.93”, which was plotted by subtraction of the pH level of VO(acac)2 solutions containing the different additives of OxalH from the pH value of initial VO(acac)2 solution (the last one was equal to 6.92). The dashed line with the slope of “0.56” shows the alteration in the pH of the VO(acac)2 + OxalH mixture in the presence of H2O2. The dotted line with the slope of “−5.23” was plotted using the differences between the pH of the VO(acac)2 + OxalH solutions and acidity levels obtained once H2O2 was injected. The digits next to the experimental points correspond to the numbers marking the respective curves in the main plot. Inset (b) shows a straight line (slope “0.28”), which demonstrates the Eh vs. OxalH dependence in the respective VO(acac)2 + OxalH solutions. The dashed line (slope “−0.03”) shows the Eh vs. OxalH dependence once H2O2 is added. The dotted line (slope “−0.31”) was obtained by subtraction of the Eh data of the solid line (slope “0.28”) from the respective Eh represented by the dashed line (slope “−0.03”). The Eh values were calculated using eqn (II) below. The digits next to the experimental points in both the insets correspond to the ones marking the respective curves in the main graph.The most conspicuous impact on pH (about 9.3 units, from 6.92 to −2.40) is demonstrated by the addition of H2O2 into the solutions containing solely VO(acac)2 (curve 1, Fig. 4). Considering that the pH in the concentration range of 2.9–26.5 M of H2O2 equals 4.9–5.3,32 it was impressive to detect such an evident deviation from the actual concentration of H2O2 (7.5 mM) from the tabulated data. Since H2O2 and VO(acac)2 + H2O2 solutions differ from each other by VO(acac)2 only, one can suppose that the latter component was responsible for the revealed trait. Such a dramatic pH decrease evidently results from the presence of some sort of product formed in the course of VO(acac)2 + H2O2 interaction. The species that are most probably liable for the detected abnormality are radicals (particularly hydroxyl ones) generated by the catalytic homolysis of H2O2 (Scheme 1). Such species are exceptionally strong oxidizers with average rate constants of H-atom abstraction in the range of 108 to 109 M−1 s−1.33 On the other hand, they possess an extremely acidic nature, reflected by very high reduction potential of 1.8–2.7 V (depending on the pH).34 Oxalic acid taken even in small concentrations minimizes the impact of H2O2 on the pH of VO(acac)2 solution; the acidity level before and after H2O2 addition differs by 1–4 units only (compare curve 1 with 2–4, Fig. 4). The dashed line with the tiny slope of 0.56 illustrates the negligible response of the pH of VO(acac)2 + OxalH mixture on the H2O2 additive (inset (a), Fig. 4).
Besides this, complementing the VO(acac)2 + OxalH solution with H2O2 results in the linear dependence of pH vs. OxalH (inset (a), slope equal 5.93) compared to the one (−5.23) obtained for VO(acac)2 + H2O2. The ability of H2O2 to affect the pH steadily diminished once the content of oxalic acid increased (curves 2, 3, 4 in the main figure; dashed line with slope 0.56 in the inset). Then, one can admit that the role of the species originating from H2O2 decomposition (predominantly highly acidic HO˙ radicals) in the pH alteration is reduced. In other words, as long as the acidity of the initial VO(acac)2 + OxalH solution increased (Fig. S2†), it loses the susceptibility to further H2O2 additions (Fig. 4). Such a trait may reflect that the heterolytic decay starts to prevail over the homolytic one (i.e., the income from reactions (1c), (1d), and (3) of Scheme 1 is diminished).35 Otherwise, H2O2 additives would have similar effects on both VO(acac)2 and VO(acac)2 + OxalH pH profiles (Fig. 4, curve 1 and 2–4, respectively).
Interestingly, the line that depicts the pH of VO(acac)2 + H2O2 vs. OxalH dependence (dashed line with the slope of 0.56) does not cross the solid line (VO(acac)2 + H2O2) – 6.92 vs. OxalH (slope 5.93) (6.92 is the pH of the VO(acac)2 solution). On the other hand, the last line and the dotted one obtained by subtraction of the pH of VO(acac)2 + OxalH solutions from the pH of VO(acac)2 + OxalH + H2O2 (line with slope of −5.23) cross each other at OxalH content ca. 0.8 mM (Fig. 4, inset (a)). The detected progressive decline in the relative differences in the acidity level (ΔpH, dotted line, inset (a)) correlate with the elevation in OxalH content and may reflect the decrease in HO˙ radical generation, thus showing that heterolytic H2O2 cleavage prevails over the homolytic one. The last peculiarity may also be responsible for the revealed disadvantage of both oxidation productivity and the yield of CHHP attained at high content of OxalH.
The extrapolation of the dotted line in inset (a) (Fig. 4) would result in it crossing the X-axis at the point ca. 2.5 mM of oxalic acid content, indicating that extra OxalH additives may not decrease the acidity any more. On the other hand, the most effective (i.e., affords the highest yield) concentration of OxalH in the oxidizing mixture was 20–30 mM, which is roughly 10 times higher than this value (Fig. 3). With such a feature, we conclude that the proton-induced conductance has a privilege at small concentration of OxalH whereas the molecular moiety (realized via “hop-turn” mechanism) prevails at higher concentration. Again, when the content of OxalH exceeds the predetermined level of 30–40 mM, the processes of ions association as well as oligomerization of non-dissociated molecules of OxalH (section above) become prevalent, thus hampering the G and, as a result, the yield as well.
The alteration of pH also affects the redox potential. If so, the acidity level and redox potential may relate to each other in the manner of Eh − pH, where Eh is the cell potential. In case of pH-dependent potential, the equation depicts that it should involve either H+ or HO− ions (reaction (3), Scheme 1). The investigated systems reveal such a trait. Regarding the reactions (mainly the steps reflecting VO2+ oxidation to VO2+), they are one-electron reactions and are characterized by the oxidized and reduced species of one kind only. In addition, the redox reactions are carried out in dilute solutions at 25 °C. Based on the above issues, for the calculation of Eh dependence of H+ concentration, the Nernst equation was expressed in terms of concentration:
|
E = E0redox − 0.0592log10Q = E0redox − 0.0592log10[Ox]a/[Red]b[H+]m
| (I) |
For the sake of practical usage, eqn (I) was written in the abridged mode (II), which connects together pH and redox potential as:
| Eh = E0redox – 0.0592 pH | (II) |
The slope (0.0585 V) of the straight line for the redox potential (ORP) vs. pH plot (Fig. S3†) matches well with the RT/Fn coefficient of Nernst equation (0.0592 V). The last peculiarity may indicate that to a first approximation, the eqn (II) can be used for adequately describing our experimental results. The insets (a) and (b) of Fig. 4 depict the similar tendencies of both pH and E parameters of VO(acac)2-based solutions (compare the same type of lines – solid–solid, dash–dash, dot–dot in the insets (a) and (b)). For instance, the pH and E level values were not sensitive to H2O2 addition in the presence of OxalH (compare the dashed line in inset (a) with the dashed line in inset (b)). Similarly, the relative values of solution acidity alteration, ΔpH (dotted line, inset (a)) and redox potential ΔE (dotted line, inset (b)) after H2O2 addition were minimized by OxalH additive. In addition, both these characteristics gradually decreased once the oxalic acid concentration in VO(acac)2-based mixture was raised.
As the redox reaction proceeds, the cell potential gradually reduced until the reaction attained equilibrium, at which change of Gibbs free energy ΔG = 0. Given this, the reaction quotient Q = Keq and ΔG = −FE, so E = 0. Then, 0 = E0 − 0.0592/log10Keq and log10Keq = E0/0.0592. In our case, E0 = 1.00 V (VO2+ → VO2+ process), log10Keq = 1.00/0.0592 × 1 = 16.9 and Keq = 1016.9. Because K > 1 and E0 > 0, the equilibrium of the above reaction should be shifted to the right side. Visually, it is reflected by the almost instant replacement of the blue color of the initial VO2+ solution (λmax ≈ 400 nm) by the yellow color of the VO2+ species (λmax = 460 nm) once H2O2 was added.14
3.3 Impact of oxalic acid on the current–potential dependence
According to our previous study, the action of OxalH in VO(acac)2-based solutions consists of reducing the pathways leading to the homolytic cleavage of H2O2 (e.g., induced by free radicals). In turn, it resulted in the partial decrease in the role of free radicals in the process mechanism.14,17 On the other hand, 1/G as well as alteration in the pH and Eh levels may affect the reaction mixture electric current vs. potential relationships as well. Should it happen, the I vs. E dependence can be registered by the CV technique. The results of such a viewpoint are discussed below.The forward anodic scan of the initially light-blue solution of VO(acac)2 (Fig. 5, curve 1) exhibits the oxidation peak at 0.98 V which, in fact, is coupled with a very weak reduction one that emerges at 0.92 V (reverse scan). In the second (cathodic) scan, one can observe the additional reduction peak with the maxima at −1.75 V. The CV also exhibited three oxidation peaks appearing in the course of the anodic scan at −1.60 V (which actually is quasi-reversible to the signal at −1.75 V of the previous scan), at −1.45 V (Fig. 5, curve 1), as well as the low and broad hill at −0.6 V. The reduction peak at −1.75 V was detected during the first cathodic scan (Fig. 5, inset). The second scan of this voltammogram shows oxidation peaks at −1.5 V and 1.00 V as well. On carrying out the last scan, a broad and low reduction signal with a maximum near 0.92 V was obtained. The quasi-reversible couple at 0.98 V/0.92 V, according to the data reported for similar systems by Kitamura and Reichel, may be a consequence of the reactions involving V+4/V+5 transformation.38 However, the height of the reduction peak is significantly lower than that of the oxidation one. The quasi-reversible signals emerging at −1.75 V/−1.60 V at the anodic and following cathodic scans (Fig. 5 and inset) can be assigned to the redox reactions of acac ligands.39 Their intensity linearly decreased in the same way as displayed by the peak of VO2+ (0.98 V) and evidently occurs due to the gradual dilution of the original VO(acac)2 solution (Fig. S4,† inset, line plotted by circles). The described behavior of such a system corresponds to the parallel attenuation of the peak at 0.98 V (Fig. S4,† inset, line plotted by squares), indicating that both the signals come from the same precursor.
 | ||
| Fig. 5 CV diagrams of 1.25 mM VO(acac)2 (1) and 1.25 mM of VO(acac)2 + 2.5 mM of OxalH (2), MeCN, 20 °C, anodic scan. Inset: cathodic scan of the VO(acac)2 solution. | ||
The addition of oxalic acid to the solution of VO(acac)2 noticeably modifies the CV (compare profiles of VO(acac)2 and VO(acac)2 + OxalH in Fig. 5). First of all, the peak at 0.98 V assigned to the oxidation of V(IV) was almost completely disappeared when H2C2O4 concentration in the mixture becomes just two times that of VO(acac)2 (Fig. 5, curve 2). Based on our previous results, we claim that it may be a consequence of the quick and complete substitution of acac ligands of VO(acac)2 by oxalate ligands.17 Instead, in the forward cathodic scan, a peak emerging at ca. −0.85 V in the presence of OxalH was registered. The gradual increase in the OxalH content in the VO(acac)2 solution led to the emergence of one more signal at −1.55 V (Fig. 5 and S5†). On carrying out the CV of 2 mM of OxalH in MeCN, two reduction peaks appeared at the same positions of −0.85 V and −1.55 V (Fig. S6†). Then, one can assume that the last two peaks most probably reflect the redox reactions where oxalate anions participate. Interestingly, the slopes for acac (Fig. S4,† inset) and oxalate (Fig. S5,† inset) signals differ by about two times (−15.03/7.00 = 2.14). Supposedly, the reason for the revealed ratio may be two times as much (−2) charge on the latter ligand compare to that on the former (−1).
The addition of H2O2 to the initial solution of VO(acac)2 dramatically increases the peak at −1.0 V (Fig. 6). Nevertheless, within 5 min, the intensity of this signal starts to lessen with almost the same rate (Fig. 6, inset (a)). On referring to a previous study,17 it was found that such a signal may ensue from the dioxygen released in the process of H2O2 decay. Furthermore, the mentioned reaction leads to a quick transformation of the parental V(IV) catalyst ions to the oxidized V(V) ions, which is substantiated by the almost instantaneous vanishing of the oxidation peak at 0.98 V (Fig. 6, inset (b)).
 | ||
| Fig. 6 CV of VO(acac)2 solution taken after supplementing it with H2O2. The curves with various colors indicate the time at which the respective spectra were taken. Initial conditions: VO(acac)2 (1.25 mM), 50 wt% aq. H2O2 (15 mM), MeCN, 20 °C. Insets: time-traces of the −1.0 V (1) and 0.98 V (2) peak height change, (a); the kinetics of VIV signal vanishing, (b). The curves with various colors indicate the time at which the respective spectra were taken (the time order was the same as that in the main figure). | ||
It is worth noting that the addition of H2O2 into the solution of VO(acac)2 + OxalH causes certainly smaller (in comparison to oxalic acid-free process) changes in the height of the −1.0 V peak (compare Fig. 6 and 7). The last feature correlates with the behavior of pH envisaged in Section 3.2 above. The kinetics of the last signal height alteration exhibits clear relationships between the presence of oxalic acid and the intensity of O2 evolution. For example, in the case of OxalH-free experiments, the rapid increase in the dioxygen peak detected right after H2O2 injection was followed by its rapid decrease (Fig. 6, inset (a)). In contrast, in the presence of two equivalents of oxalic acid, the slope of the curves depict that the kinetics of O2 signal change was leveled out by roughly 17 times ({0 − (−250)}/3 mA min−1/4.8 mA min−1 ∼ 17) (confer inset (a), curve 1 of Fig. 6 and 7). In addition, H2O2 did not affect the CV of VO(acac)2 + OxalH mixture within the region near 0.98 V, where V(IV) oxidation was revealed (compare Fig. 5 and 7). Elucidation of the absence of the 0.98 V oxidation peak in the presence of OxalH is still under study.
 | ||
| Fig. 7 CV of VO(acac)2 + OxalH solution taken after supplementing it with H2O2. The curves with various colors indicate the time at which the respective spectra were taken. Initial conditions: VO(acac)2 (1.2 mM), oxalic acid (2.5 mM), 50 wt% aq. H2O2 (15 mM), MeCN, 20 °C. Inset: time-trace of −1.0 V peak height changing. The curves with various colors indicate the time at which the respective spectra were taken (the time order was the same as that in the main figure). | ||
4. Conclusion
This work has shown the noticeable impact of reaction medium electric conductance G (or vice versa resistance, 1/G) on the yield of H2O2-piloted mild cyclohexane oxidation rendered by vanadyl(IV) acetylacetonate as the starting catalyst and oxalic acid as the promoter. The combination of impedance, pH, and CV techniques allowed to establish the impact of oxalic acid on 1/G, pH/redox potential, and current–voltage dependencies. The decrease in solution 1/G in aprotic polar solvents may emerge on elevating the concentration of H+, HC2O4−, and C2O42− as well as VO2+ and acac− ions' origin. The H-bonded networks created by H2C2O4 molecules and realized through “hop-turn” mechanism favors the decrease in 1/G value. Surpassing the 30 mM of OxalH content leads to further change in 1/G but simultaneously worsens the yield. The prevalent heterolytic cleavage of both H2O2 and CHHP in highly acidic conditions may be responsible for the revealed threshold. Oxalic acid also affects the value, shape, and behaviour of electric current vs. potential dependencies. Such features indicate that the presence of species different than that prevailing in OxalH-free oxidation. Some of them, for e.g., the putative intermediates constituted with VO(η2-O)2 metal core may be responsible for the selective non-radical substrate oxidation. However, such features may prolong the catalyst life-time by, for example, curbing the V(IV) → V(V) irreversible oxidative catalyst destruction.In turn, the application of a similar protocol (small-molecule V-based catalyst, oxalic acid as promoter, and H2O2 as oxidant, tuned electrochemical parameters) may be beneficial for the oxidation of other organic substrates of industrial interest.
Conflicts of interest
There are no conflicts of interest.Acknowledgements
The authors are thankful to the staff of Physical Chemistry Department (Rzeszow University of Technology) for technical support, guidance, and courtesy essential to complete this research. We are indebted to Prof Andrzej Sobkowiak (Rzeszow University of Technology) for commentaries and Dr Jacques Muzart (CNRS – Universite de Reims Champagne-Ardenne) for numerous correspondences as well as to Mrs Dariya Maksym (Dept. of Physical Chemistry Institute of Physical Organic Chemistry and Chemistry of Coal NAS of Ukraine) for the assistance in GLC and pH analysis.References
- Y.-R. Luo, Comprehensive handbook of chemical bond energies, 2007 Search PubMed.
- Y. Ishii, S. Sakaguchi and T. Iwahama, Adv. Synth. Catal., 2001, 343, 393–427 CrossRef CAS.
- J.-M. Brégeault, Dalton Trans., 2003, 3289–3302 RSC.
- T. Punniyamurthy, S. Velusamy and J. Iqbal, Chem. Rev., 2005, 105, 2329–2363 CrossRef CAS PubMed.
- Y. Hitomi, K. Arakawa, T. Funabiki and M. Kodera, Angew. Chem., Int. Ed., 2012, 51, 3448–3452 CrossRef CAS PubMed.
- S. Lentini, P. Galloni, I. Garcia-Bosch, M. Costas and V. Conte, Inorg. Chim. Acta, 2014, 410, 60–64 CrossRef CAS.
- M. M. Abu-Omar, A. Loaiza and N. Hontzeas, Chem. Rev., 2005, 105, 2227–2252 CrossRef CAS PubMed.
- R. A. Sheldon, I. Arends and U. Hanefeld, Green Chemistry and Catalysis, Wiley-VCH, 2007 Search PubMed.
- G. Licini, V. Conte, A. Coletti, M. Mba and C. Zonta, Coord. Chem. Rev., 2011, 255, 2345–2357 CrossRef CAS.
- P. Saisaha, J. J. Dong, T. G. Meinds, J. W. de Boer, R. Hage, F. Mecozzi, J. B. Kasper and W. R. Browne, ACS Catal., 2016, 6, 3486–3495 CrossRef CAS.
- Ch. Miao, H. Zhao, Q. Zhao, Ch. Xia and W. Sun, Catal. Sci. Technol., 2016, 6, 1378–1383 RSC and references cited therein.
- A. Pokutsa, K. Yu, A. Zaborovskyi, D. Maksym, J. Muzart and A. Sobkowiak, Appl. Catal., A, 2010, 390, 190–194 CrossRef CAS.
- D. Rinaldo, D. M. Philipp, S. J. Lippard and R. A. Friesner, J. Am. Chem. Soc., 2007, 129, 3135–3147 CrossRef CAS PubMed.
- A. Pokutsa, Y. Kubaj, A. Zaborovskyi, D. Maksym, T. Paczesniak, B. Mysliwiec, E. Bidzinska, J. Muzart and A. Sobkowiak, Mol. Catal., 2017, 434, 194–205 CrossRef CAS.
- M. C. Foti, S. Sortino and K. U. Ingold, Chem.–Eur. J., 2005, 11, 1942 CrossRef CAS PubMed.
- Ch. Reichardt, Solvents and solvent effects in organic chemistry, Wiley-VCH Weinheim, 3rd edn, 2003 Search PubMed.
- A. Pokutsa, O. Fliunt, Y. Kubaj, T. Paczesniak, P. Blonarz, R. Prystanskiy, J. Muzart, R. Makitra, A. Zaborovskyi and A. Sobkowiak, J. Mol. Catal. A: Chem., 2011, 347, 15–21 CrossRef CAS.
- M. V. Kirillova, Y. N. Kozlov, L. S. Shul’pina, O. Y. Lyakin, A. M. Kirillov, E. P. Talsi, A. J. L. Pombeiro and G. B. Shul’pin, J. Catal., 2009, 268, 26–38 CrossRef CAS.
- J. Bacsa, D. Eve and K. R. Dunbar, Acta Crystallogr., Sect. C: Cryst. Struct. Commun., 2005, 61, 58–60 CrossRef PubMed.
- I. V. Berezin, E. T. Denisov and N. M. Emanuel, The Oxidation of Cyclohexane, Pergamon, 1966 Search PubMed.
- F. Haber and J. Weiss, Naturwiss, 1932, 51, 948–950 CrossRef.
- E. Denisov and T. Denisova, Dissociation Energies of O−H Bonds of Phenols and Hydroperoxides, Application of Thermodynamics to Biological and Materials Science, ed. M. Tadashi, InTech, 2011 Search PubMed.
- E. T. Denisov and T. G. Denisova, Handbook of antioxidants: bond dissociation energies, rate constants, activation energies and enthalpies of reactions, CRC Press, Boca Raton, 2nd edn, 2000 Search PubMed.
- J. England, J. O. Bigelow, K. M. Van Heuvelen, E. R. Farquhar, M. Martinho, K. K. Meier, J. R. Frisch, E. Munck and L. Que Jr, Chem. Sci., 2014, 5, 1204–1215 RSC.
- B. A. Averill and P. Eldredge, Principles of General Chemistry, v. 1.0, Saylor Foundation, Washington, 2011 Search PubMed.
- A. Kutt and I. Leito, J. Org. Chem., 2006, 71, 2829–2838 CrossRef PubMed.
- D. T. Sawyer and J. L. Roberts, Experimental Electrochemistry for Chemists, John Wiley & Sons, NY, 1974 Search PubMed.
- R. Pohl, A. Antognini and F. Nez, et al., Nature, 2010, 466, 213–216 CrossRef CAS PubMed.
- C. J. T. Grotthuss, Ann. Chem., 1806, 58, 54–73 Search PubMed.
- J. F. Nagle and H. J. Morowitz, Proc. Natl. Acad. Sci. U. S. A., 1978, 75, 298–302 CrossRef CAS PubMed.
- S. Cukierman, Biochim. Biophys. Acta, 2006, 1757, 876–885 CrossRef CAS PubMed.
- http://www.h2o2.com/faqs/FaqDetail.aspx?fId=26.
- W. P. Kwan and B. M. Voelker, Environ. Sci. Technol., 2002, 36, 1467–1476 CrossRef CAS PubMed.
- O. Augusto and S. Miyamoto, Chapter II: Oxygen radicals and related species, in Principles of Free Radical Biomedicine, K. Pantopoulos and H. M. Schipper, Nova Science Publishers, 2011, vol. 1 Search PubMed.
- W. T. Hess, Hydrogen peroxide, in Kirk-Othmer Encyclopedia of Chemical Technology, Wiley, New York, 4th edn, 1995, vol. 13, pp. 961–995 Search PubMed.
- G. Zotti, G. Sciavon, A. Berlin and G. Pagani, Synth. Met., 1991, 40, 299–307 CrossRef CAS.
- P. Atkins, and J. de Paula, Physical Chemistry for the Life Sciences, New York, W.H. Freeman and Company, 2006, pp. 214–222 Search PubMed.
- M. Kitamura, K. Yamashita and H. Imai, Bull. Chem. Soc. Jpn., 1976, 49, 97–100 CrossRef CAS.
- M.-A. Nawi and T. S. Reichel, Inorg. Chem., 1981, 20, 1974–1978 CrossRef CAS.
Footnote |
| † Electronic supplementary information (ESI) available. See DOI: 10.1039/d0ra00495b |
| This journal is © The Royal Society of Chemistry 2020 |