 Open Access Article
Activity of La0.75Sr0.25Cr0.5Mn0.5O3−δ, Ni3Sn2 and Gd-doped CeO2 towards the reverse water-gas shift reaction and carburisation for a high-temperature H2O/CO2 co-electrolysis†
Nicky Bogolowski,
Beatriz Sánchez Batalla,
Baekkyoung Shin and
Jean-Francois Drillet *
*
DECHEMA-Forschungsinstitut, Theodor-Heuss-Allee 25, 60486 Frankfurt a. M., Germany. E-mail: jean.drillet@dechema.de
First published on 10th March 2020
Abstract
The syngas mixture of CO and H2, e.g. from natural gas reforming, is currently an important feedstock supplier for the synthesis of numerous chemicals. In order to minimize fossil source dependency and reduce global warming, alternative processes to produce syngas, such as high-temperature co-electrolysis of H2O and CO2 via the internal reverse water-gas shift (RWGS) reaction, may be meaningful. In this study, the influence of the H2![[thin space (1/6-em)]](https://www.rsc.org/images/entities/char_2009.gif) :
:![[thin space (1/6-em)]](https://www.rsc.org/images/entities/char_2009.gif) CO2 ratio on the activity, selectivity and stability of the as-prepared La0.75Sr0.25Cr0.5Mn0.5O3−δ (LSCrM) and Ni3Sn2 as well as commercial Ni and Gd-doped CeO2 (GDC20) powder materials for the reverse RWGS reaction was investigated in a tubular quartz glass reactor at 700 °C and 800 °C and ambient pressure. The highest conversion factor close to the maximum value of 50% for CO was yielded for the LSCrM, Ni and GDC20 samples by applying a 0.5
CO2 ratio on the activity, selectivity and stability of the as-prepared La0.75Sr0.25Cr0.5Mn0.5O3−δ (LSCrM) and Ni3Sn2 as well as commercial Ni and Gd-doped CeO2 (GDC20) powder materials for the reverse RWGS reaction was investigated in a tubular quartz glass reactor at 700 °C and 800 °C and ambient pressure. The highest conversion factor close to the maximum value of 50% for CO was yielded for the LSCrM, Ni and GDC20 samples by applying a 0.5![[thin space (1/6-em)]](https://www.rsc.org/images/entities/char_2009.gif) :
:![[thin space (1/6-em)]](https://www.rsc.org/images/entities/char_2009.gif) 0.5 H2
0.5 H2![[thin space (1/6-em)]](https://www.rsc.org/images/entities/char_2009.gif) :
:![[thin space (1/6-em)]](https://www.rsc.org/images/entities/char_2009.gif) CO2 feed ratio at 800 °C. Similar activity was calculated for the Ni3Sn2 alloy after normalization to the Ni mass content. Moreover, all the investigated catalysts exhibited higher selectivity for CO and H2O products than Ni, with which CH4 molar concentrations up to 0.9% and 2.4% were collected at 800 °C and 700 °C, respectively. The influence of feed pressure on the carburisation process was inspected in a tubular Ni–Cr reactor. Under a carbon-rich gas mixture at 3 bar and 700 °C, large amounts of graphitic carbon were deposited solely on the Ni sample after 100 h of exposure time. After the exposure of the powder materials to 0.5
CO2 feed ratio at 800 °C. Similar activity was calculated for the Ni3Sn2 alloy after normalization to the Ni mass content. Moreover, all the investigated catalysts exhibited higher selectivity for CO and H2O products than Ni, with which CH4 molar concentrations up to 0.9% and 2.4% were collected at 800 °C and 700 °C, respectively. The influence of feed pressure on the carburisation process was inspected in a tubular Ni–Cr reactor. Under a carbon-rich gas mixture at 3 bar and 700 °C, large amounts of graphitic carbon were deposited solely on the Ni sample after 100 h of exposure time. After the exposure of the powder materials to 0.5![[thin space (1/6-em)]](https://www.rsc.org/images/entities/char_2009.gif) :
:![[thin space (1/6-em)]](https://www.rsc.org/images/entities/char_2009.gif) 0.5 and 0.9
0.5 and 0.9![[thin space (1/6-em)]](https://www.rsc.org/images/entities/char_2009.gif) :
:![[thin space (1/6-em)]](https://www.rsc.org/images/entities/char_2009.gif) 0.1 H2
0.1 H2![[thin space (1/6-em)]](https://www.rsc.org/images/entities/char_2009.gif) :
:![[thin space (1/6-em)]](https://www.rsc.org/images/entities/char_2009.gif) CO2 atmospheres for 300 h at 700 °C and 10 bar, traces of amorphous carbon were surprisingly detected only on Ni3Sn2 powder via Raman microscopy. Thus, because GDC20 ist not active for electrochemical H2 production, LSCrM or a mixture of both LSCrM and GDC20 materials appears to be the most promising candidate for Ni substitution in high-temperature H2O/CO2 co-electrolysis.
CO2 atmospheres for 300 h at 700 °C and 10 bar, traces of amorphous carbon were surprisingly detected only on Ni3Sn2 powder via Raman microscopy. Thus, because GDC20 ist not active for electrochemical H2 production, LSCrM or a mixture of both LSCrM and GDC20 materials appears to be the most promising candidate for Ni substitution in high-temperature H2O/CO2 co-electrolysis.
1. Introduction
1.1 High temperature H2O/CO2 co-electrolysis
Because renewable energy sources are subject to seasonal fluctuations and fossil resources are limited, innovative energy storage strategies are urgently needed.1,2 High temperature H2O/CO2 co-electrolysis is one of the most energetically efficient processes to recycle climate-wrecking CO2 with green electricity into chemically valuable syngas (a mixture of H2 and CO), particularly if process vapour is available. This syngas can be further transformed into more valuable products, such as methane, alcohol, hydrocarbons (e.g. e-fuels via the Fischer–Tropsch process) and chemicals.Ni cermet is currently the most common cathode material for H2O/CO2 co-electrolysis due to its appropriate catalytic activity, high electronic conductivity, low cost and thermal expansion coefficient, which is close to that of the YSZ electrolyte.3 When using Ni/yttria-stabilized zirconia (YSZ) as a cathode material, it was suggested that CO2 to CO conversion occurs mainly through the RWGS reaction and to a lesser extent via electrochemical CO2 reduction.4–6
However, Ni is subject to degradation due to a variety of mechanisms. Particle agglomeration, densification and migration from the electrolyte/electrode interface are the most important issues responsible for cell degradation, especially at high current density.7 In addition, Ni is prone to oxidation, which necessitates the addition of reducing gas such as H2; it also has poor tolerance to impurities8,9 and favours carburization in a low-humidity hydrocarbon atmosphere. The nature and location of deposited carbon during SOFC operation with a hydrocarbon gas mixture at Ni/YSZ depends on the C–H–O ratio and operation temperature.10 A further degradation mechanism at Ni alloys at high temperatures is related to carbon formation, e.g. metal dusting via carbide formation.11 At high cell current densities under transport-limiting conditions, carbon monoxide may be reduced to carbon (1).12 Ni also catalyses the disproportionation of CO (Boudouard reaction) (2), and at high temperature, methane carburisation (3) may occur:13
| CO(g) + H2(g) → C(s) + H2O(g), reverse water-gas reaction | (1) |
| 2CO(g) → CO2(g) + C(s) CO, disproportionation | (2) |
| CH4(g) → C(s) + 2H2(g), methane carburisation | (3) |
However, under typical SOEC operating conditions, CO2 and/or H2O are present in the reaction gas; therefore, reaction (1) is usually not critical. If the SOEC is operated at higher pressure and lower temperature, the Boudouard reaction (2) and the reduction of CO (3) will be promoted. In previous study, we successfully tested Ni3Sn2 as an anode material in direct methane solid oxide fuel cells (DMSOFC), which are usually very favourable for coking reactions.14 Interestingly, this material exhibited excellent stability against carbon formation over more than 650 h at 850 °C; this was explained by the occupation of carbon nucleation sites by Sn atoms in the vicinity of Ni atoms.15 Therefore, the intermetallic Ni3Sn2 phase was considered as a possible cathode material for co-electrolysis.
Because of their high redox stability, relatively good mixed ionic and electronic conductivity and low activity for carbon formation, perovskite oxides such as (La,Sr)(Cr,Mn)O3, (La,Sr)TiO3, Sr(Fe,Mo)O3, (La,Sr)VO3 and (La,Sr)FeO3 have been investigated as possible substitution materials for nickel in H2O/CO2 co-electrolysis cathodes.3 Maiti et al. investigated oxygen vacancies and surface terminations along the (100) and (110) planes for La1−xSrxFe1−yCoyO3−δ by density functional theory (DFT). The carbon dioxide adsorption strength, a key descriptor for CO2 conversion reaction, was found to increase on oxygen-vacant surfaces. Amongst all the surface terminations, the lanthanum–oxygen terminated surface exhibited the strongest CO2 adsorption strength.16
One of the most studied materials is the p-type semiconductor (La, Sr)(Cr, Mn)O3, depicted in this work as LSCrM, with electronic conductivity > 1 S cm−1 in reducing atmosphere. However, its relatively low ionic conductivity can be enhanced by adding e.g. CeO2 or ZrO2.3 Yoon et al.17 reported an impressive increase of cell performance under steam/CO2 co-electrolysis after CeO2 and Pd addition. A LSCrM with a highly dispersed GDC nanoparticle cathode was tested by Yue et al.18 for CO2 electrolysis. They mentioned a reduction in cell polarization resistance Rp, associated with improvement of the electrochemical and catalytic activity from the nanostructured GDC phase. By doping the GDC co-impregnated LSCrM material with Pd, the cathodic activity was comparable with that of the Ni/YSZ state-of-the-art catalyst, and the stability was enhanced. The activity of YbScSZ electrolyte-supported SOEC with symmetrical LSCrM electrodes was evaluated by Torrell et al.19 They demonstrated that LSCrM was a suitable cathode material for H2O/CO2 co-electrolysis, even without addition of reducing gas such as H2.
1.2 RWGS reaction
While the water-gas shift reaction (WGS) takes place at temperatures below 720 °C, the reversible water-gas shift reaction (RWGS) is endothermic and occurs at temperatures above 720 °C. Depending on the catalyst used, syngas can be produced by (i) electrochemical reduction of both H2O and CO2 at a heterogeneous catalyst, e.g. nickel, or via (ii) electrochemical H2O reduction to hydrogen followed by a homogeneous/heterogeneous RWGS reaction, as follows:| H2(g) + CO2(g) ⇆ CO(g) + H2O(g) | (4) |
The reaction steps of the homogeneous RWGS reaction are described by the single gas-phase chain-reaction in Bradford's model, where M refers to any gas-phase molecule:20
| H2 + M → 2H + M, dissociation of hydrogen | (5) |
| H + CO2 ⇆ CO + OH, reaction between H and CO2 | (6) |
| OH + H2 ⇆ H2O + H, reaction between OH and H2 | (7) |
| M + 2H → M + H2, reassociation of hydrogen | (8) |
The mechanism of the heterogeneous RWGS reaction still remains unclear; meanwhile, two main interpretations prevail. Pekridis et al.21 suggested that at Pt, CO production occurs via formation of formate adsorbate on the catalyst surface according to reactions (9–15). This mechanism was also supported by FT-IR spectra published by Sun et al.,22 who investigated RWGS at a CuO/ZnO/Al2O3 catalyst; they claimed to observe the formation of mono (Cads) and bidentate (Cads and Oads) formate species and their further decomposition to CO.
 | (9) |
| H2 + 2* ⇆ 2H*, dissociative adsorption of H2 | (10) |
 | (11) |
| COOH* + * ⇆ CO* + OH*, formation of CO and hydroxyl | (12) |
| OH* + H* ⇆ H2O* + *, water formation | (13) |
| H2O* ⇆ H2O + *, water desorption | (14) |
| CO* ⇆ CO + * CO, desorption | (15) |
Fujita et al.23 investigated the RWGS reaction products at Cu/ZnO by FTIR and found that the reaction pathway proceeds first through oxidation of the catalyst surface by oxygen species from CO2 dissociation and second by reduction of Cu(I) to metallic Cu in the presence of H2. The formation of the formate intermediate described by (11) and (12) is replaced by that of CO, O and OH adsorbates according to the following mechanism:
 | (16) |
| O* + H* ⇆ OH*, formation of adsorbed hydroxyl | (17) |
Studies on heterogeneous RWGS focus principally on Pt-24 Cu-25 and Ni-based26 catalysts. In another study, conversion of CO2 to CO close to thermodynamic limit was yielded at Pd, Cu and Ni catalysts supported on Al2O3.27 Wolf et al. studied the RWGS reaction kinetics at Ni/Al2O3 in a fixed-bed reactor and found that a CO2 equilibrium conversion of almost 80% at 900 °C was achieved within a residence time of less than 100![[thin space (1/6-em)]](https://www.rsc.org/images/entities/char_2009.gif) ms.28
ms.28
Another interesting candidate is CeO2 because of its well-tuneable ionic and electronic conductivity, especially at high temperature and low oxygen partial pressure.29 Interestingly, addition of certain doping materials, such as gadolinium, may increase both conductivities. An electronic conductivity of 0.2 S cm−1 in air and an electronic conductivity of 1.44 S cm−1 in pO2 = 10−15 bar are reported for Ce0.8Gd0.2O1.9 in;30 thus, it is a suitable cathode, anode and electrolyte material in solid oxide fuel cells (SOFCs). Wang et al.26 developed a Ni/CeO2 catalyst with high activity, selectivity and stability for the RWGS reaction. Liu et al. showed a stable increase in CO2 conversion over a Ni/CeO2 catalyst prepared by a polymer-assisted co-precipitation method.31 Furthermore, Kovacevic et al. studied the influence of the morphology of the CeO2 catalyst on the catalytic activity for the RWGS reaction. They showed that CeO2 cubes were the most active and claimed that the (100) crystal plane in this CeO2 cubes have higher reactivity due to the lower coordination numbers in these facets. Thus, cube catalysts are more active for the RWGS than nanoparticle and rod geometries, which are enclosed by almost inert (111) crystal planes.32
In this work, the activities of La0.75Sr0.25Cr0.5Mn0.5O3−δ perovskite, Ni3Sn2 alloy and GDC20 for the RWGS reaction were investigated in a quartz tube reactor at 700 °C and 800 °C in different H2![[thin space (1/6-em)]](https://www.rsc.org/images/entities/char_2009.gif) :
:![[thin space (1/6-em)]](https://www.rsc.org/images/entities/char_2009.gif) CO2 atmospheres for the first time and compared to that of Ni. The testing of GDC20 was motivated by the fact that gadolinium-doped CeO2 (GDC20) is normally used as an interlayer between the electrolyte and electrode in SOEC to avoid SrZrO3 formation and increase oxygen mobility and because CeO2 is active for the WGS reaction. Additionally, the coking behaviour of LSCrM, Ni3Sn2, GDC20 and Ni was evaluated in a NiCr tubular reactor at 700 °C up to 10 bar in different H2
CO2 atmospheres for the first time and compared to that of Ni. The testing of GDC20 was motivated by the fact that gadolinium-doped CeO2 (GDC20) is normally used as an interlayer between the electrolyte and electrode in SOEC to avoid SrZrO3 formation and increase oxygen mobility and because CeO2 is active for the WGS reaction. Additionally, the coking behaviour of LSCrM, Ni3Sn2, GDC20 and Ni was evaluated in a NiCr tubular reactor at 700 °C up to 10 bar in different H2![[thin space (1/6-em)]](https://www.rsc.org/images/entities/char_2009.gif) :
:![[thin space (1/6-em)]](https://www.rsc.org/images/entities/char_2009.gif) CO2 atmospheres.
CO2 atmospheres.
2. Results
2.1 Physicochemical characterisation of the pristine LSCrM, Ni3Sn2, GDC20 and Ni samples
The most relevant data about the composition of the powder materials (EDX), crystalline structures (XRD), particle sizes (SEM) and BET surface areas of the catalysts are summarized in Table 1. Extensive comments on the EDX, SEM and XRD analysis are provided later in the text, where the influence of the experimental parameters on the material properties is discussed in more detail. The catalyst composition of LSCrM was also measured by inductively coupled plasma mass spectrometry (ICP-MS). Except for slight deviations in the stoichiometric factors of La and Sr, a similar composition was measured.| Catalyst | Composition | Crystalline structurec | Particle sized (μm) | BET (m2 g−1) |
|---|---|---|---|---|
| a From ICP-MS.b From EDX (see Fig. 5).c From XRD (see Fig. 3).d From SEM (see Fig. 4). | ||||
| LSCrM | La0.76Sr0.24Cr0.57Mn0.43O3a | Trigonal perovskite | 0.5–1 | 2.4 |
| La0.79Sr0.21Cr0.58Mn0.42O3b | ||||
| Ni3Sn2 | Ni3Sn2b | Orthorhombic | 10–15 | 0.6 |
| GDC20 | Gd0.23Ce0.77O2b | Cubic | 0.15–0.55 | 15.3 |
| Ni | Ni | Cubic | 2–6 | 0.4 |
2.2 Tests in a tubular quartz glass reactor at 1 bar
![[thin space (1/6-em)]](https://www.rsc.org/images/entities/char_2009.gif) :
:![[thin space (1/6-em)]](https://www.rsc.org/images/entities/char_2009.gif) 0.5 equimolar H2
0.5 equimolar H2![[thin space (1/6-em)]](https://www.rsc.org/images/entities/char_2009.gif) :
:![[thin space (1/6-em)]](https://www.rsc.org/images/entities/char_2009.gif) CO2 feed, CO molar fractions of 0.016 and 0.035 and CO2 conversion factors
CO2 feed, CO molar fractions of 0.016 and 0.035 and CO2 conversion factors
 | (18) |
![[thin space (1/6-em)]](https://www.rsc.org/images/entities/char_2009.gif) :
:![[thin space (1/6-em)]](https://www.rsc.org/images/entities/char_2009.gif) CO2 gas compositions of 0 ≤ x(CO2) ≤ 1 for the Ni-based catalysts and 0.1 ≤ x(CO2) ≤ 0.9 for LSCrM and GDC20 to prevent complete reduction are presented in Fig. 1.
CO2 gas compositions of 0 ≤ x(CO2) ≤ 1 for the Ni-based catalysts and 0.1 ≤ x(CO2) ≤ 0.9 for LSCrM and GDC20 to prevent complete reduction are presented in Fig. 1.
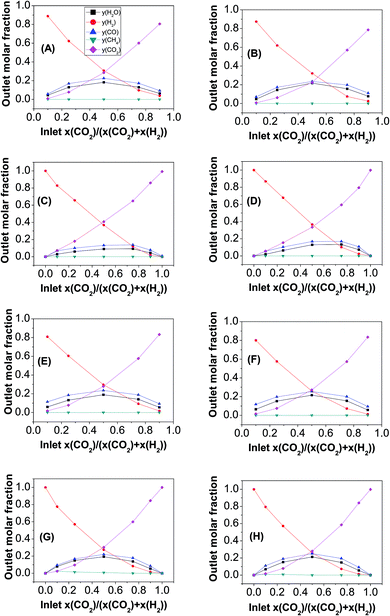 | ||
Fig. 1 Influence of the H2![[thin space (1/6-em)]](https://www.rsc.org/images/entities/char_2009.gif) : :![[thin space (1/6-em)]](https://www.rsc.org/images/entities/char_2009.gif) CO2 molar inlet composition on the RWGS reaction product concentration with (A and B) LSCrM, (C and D) Ni3Sn2, (E and F) GDC20 (G and H) Ni. CO2 molar inlet composition on the RWGS reaction product concentration with (A and B) LSCrM, (C and D) Ni3Sn2, (E and F) GDC20 (G and H) Ni. | ||
Because the RWGS is an endothermic reaction, the molar fractions of the CO and H2O reaction products at 800 °C were, as expected, slightly higher than those measured at 700 °C. The highest conversion factor was yielded with a 0.5![[thin space (1/6-em)]](https://www.rsc.org/images/entities/char_2009.gif) :
:![[thin space (1/6-em)]](https://www.rsc.org/images/entities/char_2009.gif) 0.5 H2
0.5 H2![[thin space (1/6-em)]](https://www.rsc.org/images/entities/char_2009.gif) :
:![[thin space (1/6-em)]](https://www.rsc.org/images/entities/char_2009.gif) CO2 inlet ratio at the LSCrM, Ni and GDC20 samples at both temperatures. It is worth considering that the active Ni mass in Ni3Sn2 amounted to 1.7 g (42.6% of the total alloy mass), which correlates well with about half the conversion factor of that yielded at the pure nickel material. It appears that a combination of low temperature (here, 700 °C) and high hydrogen concentration favours CH4 production, especially at the nickel material. At H2
CO2 inlet ratio at the LSCrM, Ni and GDC20 samples at both temperatures. It is worth considering that the active Ni mass in Ni3Sn2 amounted to 1.7 g (42.6% of the total alloy mass), which correlates well with about half the conversion factor of that yielded at the pure nickel material. It appears that a combination of low temperature (here, 700 °C) and high hydrogen concentration favours CH4 production, especially at the nickel material. At H2![[thin space (1/6-em)]](https://www.rsc.org/images/entities/char_2009.gif) :
:![[thin space (1/6-em)]](https://www.rsc.org/images/entities/char_2009.gif) CO2 = 0.9
CO2 = 0.9![[thin space (1/6-em)]](https://www.rsc.org/images/entities/char_2009.gif) :
:![[thin space (1/6-em)]](https://www.rsc.org/images/entities/char_2009.gif) 0.1 and 0.75
0.1 and 0.75![[thin space (1/6-em)]](https://www.rsc.org/images/entities/char_2009.gif) :
:![[thin space (1/6-em)]](https://www.rsc.org/images/entities/char_2009.gif) 0.1 inlet gas feeds, 2.4% and 1.6% CH4 were detected at 700 °C and 0.9% and 0.8% CH4 were detected at 800 °C, respectively. Even at a H2
0.1 inlet gas feeds, 2.4% and 1.6% CH4 were detected at 700 °C and 0.9% and 0.8% CH4 were detected at 800 °C, respectively. Even at a H2![[thin space (1/6-em)]](https://www.rsc.org/images/entities/char_2009.gif) :
:![[thin space (1/6-em)]](https://www.rsc.org/images/entities/char_2009.gif) CO2 molar ratio of 0.5
CO2 molar ratio of 0.5![[thin space (1/6-em)]](https://www.rsc.org/images/entities/char_2009.gif) :
:![[thin space (1/6-em)]](https://www.rsc.org/images/entities/char_2009.gif) 0.5 at 700 °C, 0.8% CH4 was formed. At the Ni3Sn2, LSCrM and GDC20 samples, no methane was detected.
0.5 at 700 °C, 0.8% CH4 was formed. At the Ni3Sn2, LSCrM and GDC20 samples, no methane was detected.
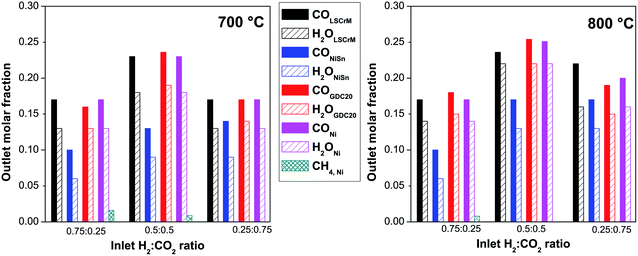
For better clarity and easier interpretation, the activity results of only three relevant gas compositions were converted into a bar graph, as displayed in Fig. 2. At 800 °C and with a 0.5![[thin space (1/6-em)]](https://www.rsc.org/images/entities/char_2009.gif) :
:![[thin space (1/6-em)]](https://www.rsc.org/images/entities/char_2009.gif) 0.5 H2
0.5 H2![[thin space (1/6-em)]](https://www.rsc.org/images/entities/char_2009.gif) :
:![[thin space (1/6-em)]](https://www.rsc.org/images/entities/char_2009.gif) CO2 gas mixture, CO concentrations of 25.4% at GDC20, 23.6% at LSCrM and 25.1% at Ni were detected by GC. For these measurements, an absolute margin of error of ±1% was estimated.
CO2 gas mixture, CO concentrations of 25.4% at GDC20, 23.6% at LSCrM and 25.1% at Ni were detected by GC. For these measurements, an absolute margin of error of ±1% was estimated.
Because the kinetics of a heterogeneous reaction is much faster than that of a homogeneous reaction, we assume that in our work, the influence of the values obtained from the blind experiment in the quartz glass reactor without catalyst can be neglected. When we compared the maximum theoretical water molar fraction of 24.5% calculated by FactSage with the measured fractions (21.7%, 21.6% and 21.3% for LSCrM, GDC20 and Ni, respectively, in H2![[thin space (1/6-em)]](https://www.rsc.org/images/entities/char_2009.gif) :
:![[thin space (1/6-em)]](https://www.rsc.org/images/entities/char_2009.gif) CO2 = 0.5
CO2 = 0.5![[thin space (1/6-em)]](https://www.rsc.org/images/entities/char_2009.gif) :
:![[thin space (1/6-em)]](https://www.rsc.org/images/entities/char_2009.gif) 0.5 @ 800 °C), the margin of error of the water measurement delivered by the humidity sensor is assumed to be in the range of 1–3%.
0.5 @ 800 °C), the margin of error of the water measurement delivered by the humidity sensor is assumed to be in the range of 1–3%.
Interestingly, GDC20 and LSCrM are more selective for the RWGS reaction than Ni because no CH4 was detected at the reactor outlet. The excellent conversion factor of GDC20 for the RWGS reaction can also be ascribed to its 38 times higher BET surface area compared to that of nickel. Because the CO2 conversion factors at 800 °C for the 0.5![[thin space (1/6-em)]](https://www.rsc.org/images/entities/char_2009.gif) :
:![[thin space (1/6-em)]](https://www.rsc.org/images/entities/char_2009.gif) 0.5 CO2
0.5 CO2![[thin space (1/6-em)]](https://www.rsc.org/images/entities/char_2009.gif) :
:![[thin space (1/6-em)]](https://www.rsc.org/images/entities/char_2009.gif) H2 mixture are in the range of 48–50% for all materials, with the exception of Ni alloy, and are almost the same as the calculated thermodynamic equilibrium value of 49%, it can be concluded that our reactor design allowed very good convection and diffusion of educts and products into and out of the Al2O3 crucible as well as excellent catalyst accessibility. By using a fixed-bed quartz tube reactor with an 8 mm inner diameter, Liu et al.31 reported a conversion factor of about 40% for a Ni/CeO2 catalyst in H2
H2 mixture are in the range of 48–50% for all materials, with the exception of Ni alloy, and are almost the same as the calculated thermodynamic equilibrium value of 49%, it can be concluded that our reactor design allowed very good convection and diffusion of educts and products into and out of the Al2O3 crucible as well as excellent catalyst accessibility. By using a fixed-bed quartz tube reactor with an 8 mm inner diameter, Liu et al.31 reported a conversion factor of about 40% for a Ni/CeO2 catalyst in H2![[thin space (1/6-em)]](https://www.rsc.org/images/entities/char_2009.gif) :
:![[thin space (1/6-em)]](https://www.rsc.org/images/entities/char_2009.gif) CO2 = 0.5
CO2 = 0.5![[thin space (1/6-em)]](https://www.rsc.org/images/entities/char_2009.gif) :
:![[thin space (1/6-em)]](https://www.rsc.org/images/entities/char_2009.gif) 0.5 and a gas-flow of 100 ml min−1, but at 600 °C and at a much higher space velocity of 120.000 h−1. At a H2
0.5 and a gas-flow of 100 ml min−1, but at 600 °C and at a much higher space velocity of 120.000 h−1. At a H2![[thin space (1/6-em)]](https://www.rsc.org/images/entities/char_2009.gif) :
:![[thin space (1/6-em)]](https://www.rsc.org/images/entities/char_2009.gif) CO2 ratio of 0.8
CO2 ratio of 0.8![[thin space (1/6-em)]](https://www.rsc.org/images/entities/char_2009.gif) :
:![[thin space (1/6-em)]](https://www.rsc.org/images/entities/char_2009.gif) 0.2 and with a normalized hourly space velocity of 30
0.2 and with a normalized hourly space velocity of 30![[thin space (1/6-em)]](https://www.rsc.org/images/entities/char_2009.gif) 000 ml g−1 h−1, with an overall gas flow of 100
000 ml g−1 h−1, with an overall gas flow of 100![[thin space (1/6-em)]](https://www.rsc.org/images/entities/char_2009.gif) ml min−1 and assuming an ideal gas, a CO formation rate of 378.9 μmol min−1 g−1 can be calculated for a conversion factor of 50%. At 700 °C, a conversion factor of about 44% and a CO formation rate of 245.4 μmol min−1 g−1 were calculated, which may be related to the slower kinetics at this temperature. This is comparable to the CO formation rate of 300 μmol min−1 g−1 measured by Daza et al.33 for La0.75Sr0.25CoO3−δ at 850 °C with previously reduced 10% H2/He at 600 °C for 30 min (total flow rate 50 sccm). The best results in terms of mass activity and selectivity for the RWGS reaction were yielded at the LSCrM and GDC20 catalysts.
ml min−1 and assuming an ideal gas, a CO formation rate of 378.9 μmol min−1 g−1 can be calculated for a conversion factor of 50%. At 700 °C, a conversion factor of about 44% and a CO formation rate of 245.4 μmol min−1 g−1 were calculated, which may be related to the slower kinetics at this temperature. This is comparable to the CO formation rate of 300 μmol min−1 g−1 measured by Daza et al.33 for La0.75Sr0.25CoO3−δ at 850 °C with previously reduced 10% H2/He at 600 °C for 30 min (total flow rate 50 sccm). The best results in terms of mass activity and selectivity for the RWGS reaction were yielded at the LSCrM and GDC20 catalysts.
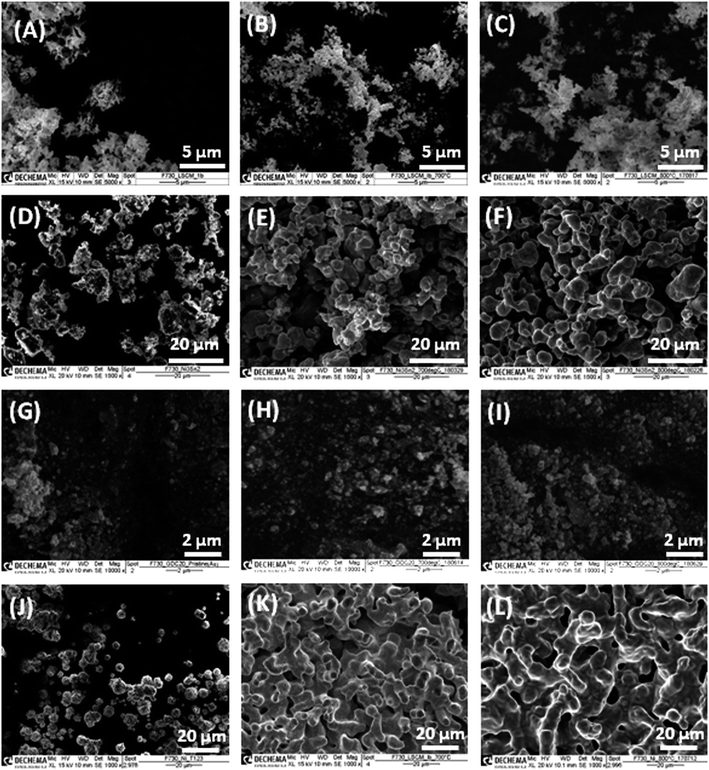 | ||
| Fig. 4 SEM micrographs of (A–C) LSCrM, (D–F) Ni3Sn2, (G–I) GDC20 and (J–L) Ni (left) before and after catalytic activity tests performed at (middle) 700 °C and (right) 800 °C. | ||
| Catalyst | LSCrM | Ni3Sn2 | GDC20 |
|---|---|---|---|
| Pristine | La0.79Sr0.21Cr0.58Mn0.42O3−δ | Ni2.96Sn2.04 | Gd0.23Ce0.77O2−δ |
| @700 °C | La0.76Sr0.24Cr0.62Mn0.38O3−δ | Ni3.35Sn1.65 | Gd0.23Ce0.77O2−δ |
| @800 °C | La0.71Sr0.29Cr0.63Mn0.37O3−δ | Ni2.93Sn2.07 | Gd0.23Ce0.77O2−δ |
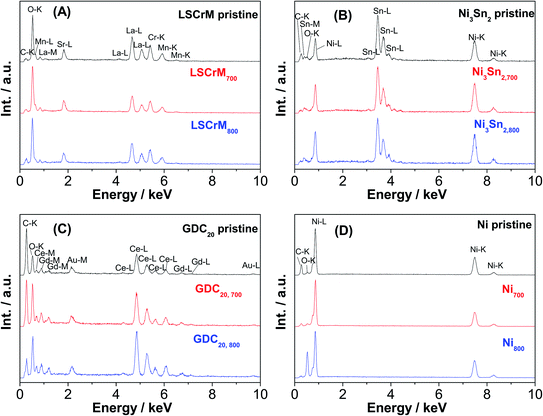
Additional Au-L and Au-M peaks in the EDX spectrum of the GDC20 sample were induced by a gold sputtering step that was carried out in order to improve the poor electronic conductivity of the oxide material. The C-K signal is assigned to the carbon conductive adhesive tape. In contrast, strong sintering of Ni particles from 2 to 6 μm up to 2 to 30 μm is obvious, especially after the test at 800 °C. The driving force of the sintering step is the reduction of the surface/interface energy of the small particles by merging them together in order to form larger particles via a mass transport/diffusion process. The sintering activity depends on the melting point and particle size/shape as well. Under SOFC/SOEC conditions, the sintering and densification effects of the nickel particles are attenuated by the addition of yttrium-stabilized zirconia (YSZ) material as an ionic conductor.34 With an average particle size in the range of 10–15![[thin space (1/6-em)]](https://www.rsc.org/images/entities/char_2009.gif) μm, the Ni3Sn2 particles appear to be less prone to sintering than pure Ni powder. From the pure sintering aspect, LSCrM and GDC20 are the best materials.
μm, the Ni3Sn2 particles appear to be less prone to sintering than pure Ni powder. From the pure sintering aspect, LSCrM and GDC20 are the best materials.
No substantial change in the EDX spectra after the catalytic activity tests was observed (see Fig. 5). The compositions of the different catalysts calculated from the EDX spectra (see Table 2) slightly differs from the stoichiometric values but lies to some extent within the error margin of the equipment.
2.3 Influence of atmosphere composition, temperature and pressure on carbon formation at the powder materials
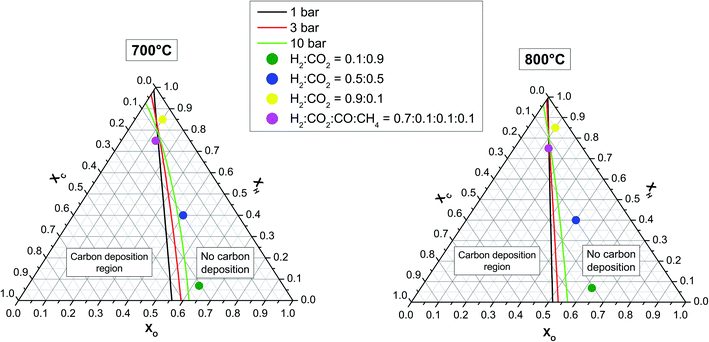
Ternary phase diagrams for H, C and O were calculated for three pressure values and two temperature values (see Fig. 6) by assuming real gas behaviour. Under the assumption of thermodynamic equilibrium, the points on the ternary diagram at which the production and consumption of solid graphitic carbon are balanced result in a line that separates the carbon deposition region (carbon activity coefficient = 1) from the no carbon deposition region (carbon activity coefficient < 1).36 In both diagrams, the positions of three relevant H2![[thin space (1/6-em)]](https://www.rsc.org/images/entities/char_2009.gif) :
:![[thin space (1/6-em)]](https://www.rsc.org/images/entities/char_2009.gif) CO2 gas mixtures of 0.1
CO2 gas mixtures of 0.1![[thin space (1/6-em)]](https://www.rsc.org/images/entities/char_2009.gif) :
:![[thin space (1/6-em)]](https://www.rsc.org/images/entities/char_2009.gif) 0.9, 0.5
0.9, 0.5![[thin space (1/6-em)]](https://www.rsc.org/images/entities/char_2009.gif) :
:![[thin space (1/6-em)]](https://www.rsc.org/images/entities/char_2009.gif) 0.5 and 0.9
0.5 and 0.9![[thin space (1/6-em)]](https://www.rsc.org/images/entities/char_2009.gif) :
:![[thin space (1/6-em)]](https://www.rsc.org/images/entities/char_2009.gif) 01 ratio are indicated as dots.
01 ratio are indicated as dots.
No carbon deposition for these gas compositions is predicted by thermodynamics calculations even at 10 bar and 700 °C. It can be seen that the overall carbon deposition area increases with increasing pressure and decreasing temperature. In the upper triangle delimited by C = 0.25, H = 0.75, and H![[thin space (1/6-em)]](https://www.rsc.org/images/entities/char_2009.gif) =
=![[thin space (1/6-em)]](https://www.rsc.org/images/entities/char_2009.gif) 1, however, the probability of carbon formation diminishes with increasing pressure. It is worth mentioning that the present study is restricted to graphitic carbon. When all carbon allotropes are included (not possible in our FactSage version), the carbon deposition region expands, as shown by Jaworski et al.37
1, however, the probability of carbon formation diminishes with increasing pressure. It is worth mentioning that the present study is restricted to graphitic carbon. When all carbon allotropes are included (not possible in our FactSage version), the carbon deposition region expands, as shown by Jaworski et al.37
![[thin space (1/6-em)]](https://www.rsc.org/images/entities/b_char_2009.gif) :
:![[thin space (1/6-em)]](https://www.rsc.org/images/entities/b_char_2009.gif) CO2 atmospheres and temperatures at 10 bar. The choice of the three experimental conditions of (i) 0.9
CO2 atmospheres and temperatures at 10 bar. The choice of the three experimental conditions of (i) 0.9![[thin space (1/6-em)]](https://www.rsc.org/images/entities/char_2009.gif) :
:![[thin space (1/6-em)]](https://www.rsc.org/images/entities/char_2009.gif) 0.1 H2
0.1 H2![[thin space (1/6-em)]](https://www.rsc.org/images/entities/char_2009.gif) :
:![[thin space (1/6-em)]](https://www.rsc.org/images/entities/char_2009.gif) CO2 at 800 °C, (ii) 0.5
CO2 at 800 °C, (ii) 0.5![[thin space (1/6-em)]](https://www.rsc.org/images/entities/char_2009.gif) :
:![[thin space (1/6-em)]](https://www.rsc.org/images/entities/char_2009.gif) 0.5 H2
0.5 H2![[thin space (1/6-em)]](https://www.rsc.org/images/entities/char_2009.gif) :
:![[thin space (1/6-em)]](https://www.rsc.org/images/entities/char_2009.gif) CO2 at 700 °C, and (iii) 0.1
CO2 at 700 °C, and (iii) 0.1![[thin space (1/6-em)]](https://www.rsc.org/images/entities/char_2009.gif) :
:![[thin space (1/6-em)]](https://www.rsc.org/images/entities/char_2009.gif) 0.9 H2
0.9 H2![[thin space (1/6-em)]](https://www.rsc.org/images/entities/char_2009.gif) :
:![[thin space (1/6-em)]](https://www.rsc.org/images/entities/char_2009.gif) CO2 at 700 °C was motivated by their proximity to the carbon deposition boundary materialized by the green lines for 10 bar in Fig. 6. No significant change in the mass of the LSCrM, Ni3Sn2, GDC20 or Ni samples was assessed after the 300 h test period. The exposure conditions led to slight changes in the catalyst composition, as listed in Table 3. In terms of particle morphology, however, Ni3Sn2 and especially Ni particles were affected by sintering effects, notably after the tests at 800 °C.
CO2 at 700 °C was motivated by their proximity to the carbon deposition boundary materialized by the green lines for 10 bar in Fig. 6. No significant change in the mass of the LSCrM, Ni3Sn2, GDC20 or Ni samples was assessed after the 300 h test period. The exposure conditions led to slight changes in the catalyst composition, as listed in Table 3. In terms of particle morphology, however, Ni3Sn2 and especially Ni particles were affected by sintering effects, notably after the tests at 800 °C.
| Composition | LSCrM | Ni3Sn2 | GDC20 |
|---|---|---|---|
a 3 bar: Exposure test at 3 bar/700 °C under H2![[thin space (1/6-em)]](https://www.rsc.org/images/entities/char_2009.gif) : :![[thin space (1/6-em)]](https://www.rsc.org/images/entities/char_2009.gif) CO:CH4 CO:CH4![[thin space (1/6-em)]](https://www.rsc.org/images/entities/char_2009.gif) : :![[thin space (1/6-em)]](https://www.rsc.org/images/entities/char_2009.gif) CO2 = 0.7 CO2 = 0.7![[thin space (1/6-em)]](https://www.rsc.org/images/entities/char_2009.gif) : :![[thin space (1/6-em)]](https://www.rsc.org/images/entities/char_2009.gif) 0.1 0.1![[thin space (1/6-em)]](https://www.rsc.org/images/entities/char_2009.gif) : :![[thin space (1/6-em)]](https://www.rsc.org/images/entities/char_2009.gif) 0.1 0.1![[thin space (1/6-em)]](https://www.rsc.org/images/entities/char_2009.gif) : :![[thin space (1/6-em)]](https://www.rsc.org/images/entities/char_2009.gif) 0.1; (i): exposure test at 10 bar/800 °C under H2 0.1; (i): exposure test at 10 bar/800 °C under H2![[thin space (1/6-em)]](https://www.rsc.org/images/entities/char_2009.gif) : :![[thin space (1/6-em)]](https://www.rsc.org/images/entities/char_2009.gif) CO2 = 0.9 CO2 = 0.9![[thin space (1/6-em)]](https://www.rsc.org/images/entities/char_2009.gif) : :![[thin space (1/6-em)]](https://www.rsc.org/images/entities/char_2009.gif) 0.1; (ii): exposure test at 10 bar/700 °C under H2 0.1; (ii): exposure test at 10 bar/700 °C under H2![[thin space (1/6-em)]](https://www.rsc.org/images/entities/char_2009.gif) : :![[thin space (1/6-em)]](https://www.rsc.org/images/entities/char_2009.gif) CO2 = 0.5 CO2 = 0.5![[thin space (1/6-em)]](https://www.rsc.org/images/entities/char_2009.gif) : :![[thin space (1/6-em)]](https://www.rsc.org/images/entities/char_2009.gif) 0.5; (iii): exposure test at 10 bar/700 °C under H2 0.5; (iii): exposure test at 10 bar/700 °C under H2![[thin space (1/6-em)]](https://www.rsc.org/images/entities/char_2009.gif) : :![[thin space (1/6-em)]](https://www.rsc.org/images/entities/char_2009.gif) CO2 = 0.1 CO2 = 0.1![[thin space (1/6-em)]](https://www.rsc.org/images/entities/char_2009.gif) : :![[thin space (1/6-em)]](https://www.rsc.org/images/entities/char_2009.gif) 0.9. 0.9. |
|||
| Pristine | La0.79Sr0.21Cr0.58Mn0.42O3 | Ni2.96Sn2.04 | Gd0.23Ce0.77O2 |
| 3 bar | La0.81Sr0.19Cr0.66Mn0.34O3 | Ni3.34Sn1.67 | Gd0.21Ce0.79O2 |
| 10 bar, (i) | La0.83Sr0.17Cr0.66Mn0.34O3 | Ni3.28Sn1.72 | Gd0.26Ce0.74O2 |
| 10 bar, (ii) | La0.80Sr0.20Cr0.67Mn0.33O3 | Ni3.16Sn1.84 | Gd0.21Ce0.79O2 |
| 10 bar, (iii) | La0.68Sr0.32Cr0.55Mn0.45O3 | Ni3.18Sn1.82 | Gd0.22Ce0.78O2 |
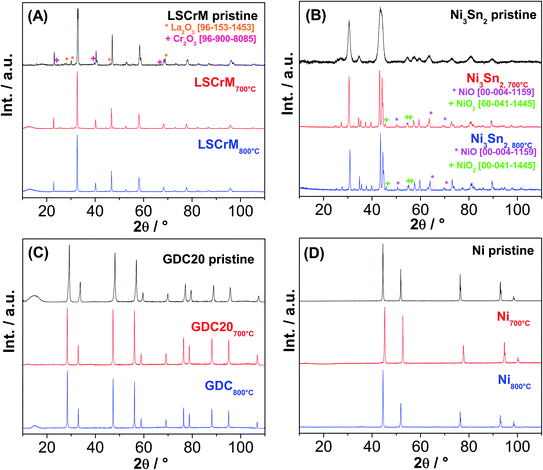
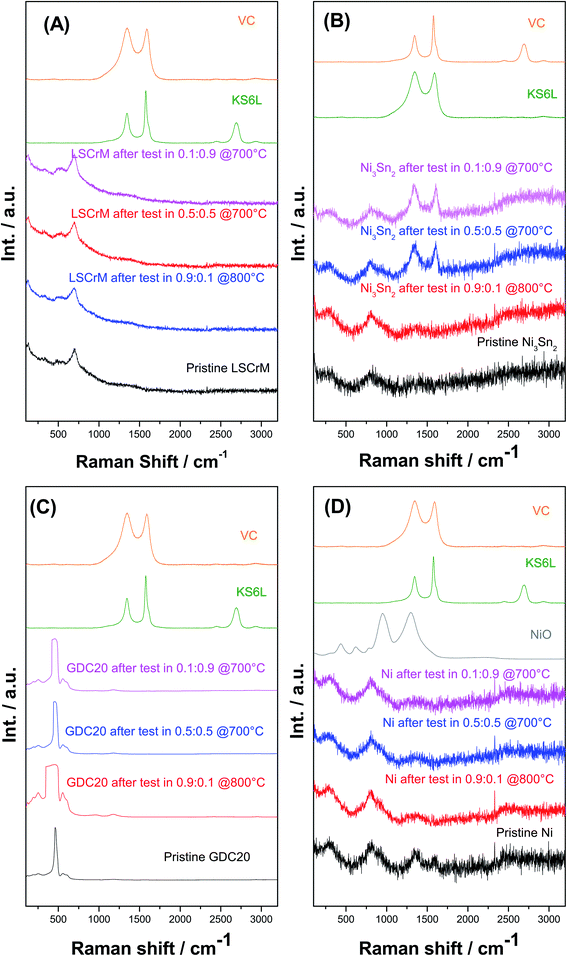
The XRD spectra of all the investigated samples revealed no modification of the crystallite structure or indication of carbon formation. The latter was confirmed by Raman analysis of LSCrM, GDC20 and Ni. Surprisingly, the d-band peaks at 1610 cm−1 and 1342 cm−1 corresponding to amorphous carbon were detected at the surface of Ni3Sn2 after the exposure tests under 0.5![[thin space (1/6-em)]](https://www.rsc.org/images/entities/char_2009.gif) :
:![[thin space (1/6-em)]](https://www.rsc.org/images/entities/char_2009.gif) 0.5 and 0.1
0.5 and 0.1![[thin space (1/6-em)]](https://www.rsc.org/images/entities/char_2009.gif) :
:![[thin space (1/6-em)]](https://www.rsc.org/images/entities/char_2009.gif) 0.9H2
0.9H2![[thin space (1/6-em)]](https://www.rsc.org/images/entities/char_2009.gif) :
:![[thin space (1/6-em)]](https://www.rsc.org/images/entities/char_2009.gif) CO2 atmospheres at 700 °C.
CO2 atmospheres at 700 °C.
This type of carbon is not detectable in XRD; therefore, the Ni3Sn2 pattern did not show any diffraction peak at 2θ = 26.4°. No carbon was visible in the SEM micrographs as well. Fig. 8 shows the Raman spectra of Ni3Sn2 and the other samples for comparison after the exposure tests.
3. Conclusions
The catalytic activities of La0.75Sr0.25Cr0.5Mn0.5O3, Ni3Sn2 and GDC20 powder materials for the RWGS reaction were evaluated in a quartz tube reactor at 700 °C and 800 °C and were compared to that of a commercial Ni powder which is a commonly used catalyst in H2O/CO2 HT co-electrolysis cells. Especially, the CO yields at LSCrM and GDC20 in a 0.5![[thin space (1/6-em)]](https://www.rsc.org/images/entities/char_2009.gif) :
:![[thin space (1/6-em)]](https://www.rsc.org/images/entities/char_2009.gif) 0.5 H2
0.5 H2![[thin space (1/6-em)]](https://www.rsc.org/images/entities/char_2009.gif) :
:![[thin space (1/6-em)]](https://www.rsc.org/images/entities/char_2009.gif) CO2 ratio at 800 °C were close to thermodynamic equilibrium; therefore, these materials are as active as nickel for RWGS. Moreover, in feeds with high H2 partial pressure, the samples all exhibited higher selectivity for CO and H2O products than pure Ni, which catalysed CH4 by-product formation. To our knowledge, the catalytic activities of the intermetallic Ni3Sn2 phase, LSCrM perovskite oxide and GDC20 oxide for the reverse water gas shift reaction were demonstrated for the first time in this work.
CO2 ratio at 800 °C were close to thermodynamic equilibrium; therefore, these materials are as active as nickel for RWGS. Moreover, in feeds with high H2 partial pressure, the samples all exhibited higher selectivity for CO and H2O products than pure Ni, which catalysed CH4 by-product formation. To our knowledge, the catalytic activities of the intermetallic Ni3Sn2 phase, LSCrM perovskite oxide and GDC20 oxide for the reverse water gas shift reaction were demonstrated for the first time in this work.
No carbon formation was observed at these catalysts after 100 h exposure time in a carbon-rich atmosphere at 3 bar and 700 °C in the metallic tube reactor. In contrast, large carbon deposits were detected on Ni under the same conditions. Curiously, after 300 h exposure time in 0.5![[thin space (1/6-em)]](https://www.rsc.org/images/entities/char_2009.gif) :
:![[thin space (1/6-em)]](https://www.rsc.org/images/entities/char_2009.gif) 0.5 and 0.1
0.5 and 0.1![[thin space (1/6-em)]](https://www.rsc.org/images/entities/char_2009.gif) :
:![[thin space (1/6-em)]](https://www.rsc.org/images/entities/char_2009.gif) 0.9 H2
0.9 H2![[thin space (1/6-em)]](https://www.rsc.org/images/entities/char_2009.gif) :
:![[thin space (1/6-em)]](https://www.rsc.org/images/entities/char_2009.gif) CO2 atmospheres at 10 bar and 700 °C, traces of amorphous carbon were detected by Raman spectroscopy only on the Ni3Sn2 surface. After both catalytic and exposure experiments, XRD and SEM analysis revealed excellent redox behaviour and stable morphologies of LSCrM and GDC20, slight phase segregation of Ni3Sn2 into NiO and SnO2 and, finally, strong sintering activity of Ni and of Ni3Sn2 powder to a lesser extent.
CO2 atmospheres at 10 bar and 700 °C, traces of amorphous carbon were detected by Raman spectroscopy only on the Ni3Sn2 surface. After both catalytic and exposure experiments, XRD and SEM analysis revealed excellent redox behaviour and stable morphologies of LSCrM and GDC20, slight phase segregation of Ni3Sn2 into NiO and SnO2 and, finally, strong sintering activity of Ni and of Ni3Sn2 powder to a lesser extent.
4. Experimental
La0.75Sr0.25Cr0.5Mn0.5O3−δ was synthesized by a sol–gel route. Citric acid (C6H8O7·H2O, Sigma-Aldrich) and EDTA (C10H16N2O8, Sigma-Aldrich) were dissolved in ultrapure water (PURELAB® Ultra, Elga LabWater). Under continuous stirring, stoichiometric amounts of lanthanum nitrate (La(NO3)3·6H2O, 14.3 g, 33.0 mmol, 0.75 eq.), strontium nitrate (Sr(NO3)2, 2.36 g, 11.2 mmol, 0.25 eq.), chromium nitrate (Cr(NO3)3·9H2O, 8.84 g, 22.1 mmol, 0.50 eq.) and manganese nitrate (Mn(NO3)2, 4.25 g, 23.8 mmol, 0.50 eq.) (99.99%, all AlfaAesar) were dissolved in this solution. The pH of the mixture was adjusted to 7 by addition of ammonium hydroxide solution. Subsequent evaporation of excess water at mild temperatures (≈150 °C) resulted in a homogeneous gel, which was fired at 350 °C for 3 h. The resulting powder was coarsely ground in a mortar and treated at 600 °C for 2 h in ambient air. Finally, the calcination step was performed in synthetic air (99.995%, basi Schöberl) at 1100 °C for 16 h.Ni3Sn2 was prepared in a centrifugal casting induction oven by melting stoichiometric amounts of Ni and Sn (42.6 g, 3 eq. Ni and 57.4 g, 2 eq. Sn, 99.9%, MaTecK) for 5 min under vacuum. After cooling, the ingot was mechanically crushed and ball-milled (Retsch PM100) twice for 8 h using zirconium oxide balls.
Commercial GDC20 (99.9%, Kerafol) and Ni (99.9%, Vale Inco.) were used as received.
The crystallographic structures of the materials were examined by X-ray diffraction analysis (D8 Advance, Cu-Kα, Bruker). To increase the surface sensitivity, a Goebel mirror was used for the solid samples. The surface morphology of the materials was analysed by scanning electron microscopy (SEM) and energy dispersive X-ray spectroscopy (EDX) (XL40, EDAX CDU Leap detector, Phillips). Carbon formation was evaluated by a confocal microprobe Raman spectrometer (InVia Reglex, Renishaw). The laser beam (Ar, 532 nm, 1 mW) was focused through a 50× objective lens (DM 2500, Leica) with ∼1 μm spot size. The spectral range and resolution were 100 to 3200 cm−1 and 1 cm−1 at room temperature, respectively. BET surface area measurements were performed with an Autosorb IQ3 station (Quantachrome).
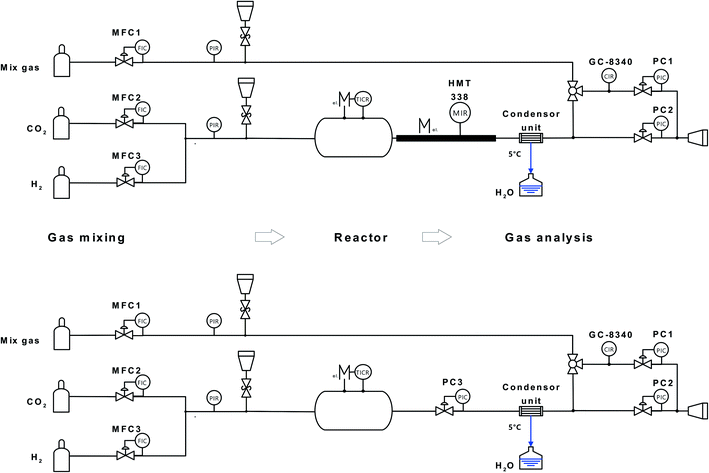
A schematic of the experimental setup for evaluation of the catalyst activity for RWGS is shown in Fig. 9. The hydrogen (5.0, Soboth)/carbon dioxide (4.5, Soboth) gas inlet composition (x(H2) and x(CO2)) was controlled by two mass-flow controllers (5850, Brooks). The total flow rate was kept constant at 100 ml min−1. The reactor consisted of a quartz glass tube (Ø = 5 cm, Lhot-zone = 30 cm, Vhot-zone = 590 cm3) positioned in a 3-zone horizontal furnace (hot-zone 300 mm length) with a theoretical residence time in the hot-zones of 1.46 min (gas velocity 358 ml min−1) and 1.33 min (392 ml min−1) at 700 °C and 800 °C, respectively. To avoid heat loss, the inlet and outlet zones of the reactor tube inside the oven were sealed by porous Al2O3/SiO2 stoppers (Promatron®-23 HD) with 9 mm holes. Due to thermal expansion of the gas at the inlet of the isothermal zone, the gas velocity increased inside the reactor. Powder samples were placed in an aluminium oxide crucible (volume ratio of reactor hot-zone to aluminium oxide crucible ≈ 15![[thin space (1/6-em)]](https://www.rsc.org/images/entities/char_2009.gif) :
:![[thin space (1/6-em)]](https://www.rsc.org/images/entities/char_2009.gif) 1) in the middle of the glass tube (non-fixed-bed reactor).
1) in the middle of the glass tube (non-fixed-bed reactor).
Due to the different bulk material densities, the hourly space velocities in the range of 1000 h−1 for LSCrM and 2000 h−1 for the Ni powder catalyst with a bed volume of 1,5–3 ml were calculated. The reactor outlet tubing and the humidity sensor (HMT 330, Vaisala) were heated to 120 °C to prevent condensation. Before analysis by gas chromatography (GC), water was separated from the gas phase by passing through a reflux condenser at 5 °C. At the condenser outlet, gaseous reaction educts and residual products were detected by a gas chromatograph (GC8340, Fisons) equipped with two separation columns: one with a methanizer with a flame ionization detector and one with a thermal conductivity detector. The GC sample loop flow was controlled by the pressure difference between the two pressure controllers (5800E, Brooks), and the overpressure was maintained at 25 mbar. GC calibration was performed daily with a gas mixture of defined composition (Air Liquide).
For exposure tests at 3 and 10 bar, the quartz glass reactor was replaced by an ET45 Ni–Cr alloy tube (3.8 cm inner diameter, 340 cm3 hot-zone volume, 58 and 52 s residence times at 700 °C and 800 °C, respectively). The humidity sensor was disassembled from the reactor and a back-pressure controller (5866, Brooks) was connected to the reactor outlet to maintain the desired pressure inside the reactor.
All tests were performed with a non-fixed-bed reactor because not only the catalytic activity of the powder materials but also their affinity for sintering was of practical interest. For the catalytic tests in different H2![[thin space (1/6-em)]](https://www.rsc.org/images/entities/char_2009.gif) :
:![[thin space (1/6-em)]](https://www.rsc.org/images/entities/char_2009.gif) CO2 atmospheres at 1 bar, 4 g of the powder material was placed in a ceramic crucible in the reactor and heated to the desired temperature (3 K min−1) of 700 °C or 800 °C in 10% H2/Ar reducing atmosphere before pure H2, H2
CO2 atmospheres at 1 bar, 4 g of the powder material was placed in a ceramic crucible in the reactor and heated to the desired temperature (3 K min−1) of 700 °C or 800 °C in 10% H2/Ar reducing atmosphere before pure H2, H2![[thin space (1/6-em)]](https://www.rsc.org/images/entities/char_2009.gif) :
:![[thin space (1/6-em)]](https://www.rsc.org/images/entities/char_2009.gif) CO2 gas mixtures with different compositions and finally pure CO2 were introduced into the reactor. Gas chromatograms were recorded after a 2 h waiting time at a defined set point. Exposure tests were performed in a similar way.
CO2 gas mixtures with different compositions and finally pure CO2 were introduced into the reactor. Gas chromatograms were recorded after a 2 h waiting time at a defined set point. Exposure tests were performed in a similar way.
After heating the samples to the desired temperature, the pressure was increased and the exposure tests were performed for 300 h at three different x(H2) and x(CO2) inlet molar fractions and two different temperatures:
(i) x(H2) = 0.9, x(CO2) = 0.1 @ 800 °C.
(ii) x(H2) = x(CO2) = 0.5 @ 700 °C.
(iii) x(H2) = 0.1, x(CO2) = 0.9 @ 700 °C.
The exposure test @ 700 °C was performed at 3 bar for 100 h in a special carburisation-active mixture of x(H2) = 0.7, x(CO2) = 0.1, x(CO) = 0.1 and x(CH4) = 0.1. After the tests, all samples were cooled in a reducing 10% H2/Ar atmosphere at 1 bar.
Conflicts of interest
There are no conflicts to declare.Acknowledgements
The authors gratefully acknowledge funding by the German Federal Ministry of Education and Research (BMBF) within the Kopernikus Project P2X (03SFK2U0)![[thin space (1/6-em)]](https://www.rsc.org/images/entities/char_2009.gif) :
:![[thin space (1/6-em)]](https://www.rsc.org/images/entities/char_2009.gif) Flexible use of renewable resources – exploration, validation and implementation of ‘Power-to-X’ concepts as well as all project partners for fruitful cooperation and discussions.
Flexible use of renewable resources – exploration, validation and implementation of ‘Power-to-X’ concepts as well as all project partners for fruitful cooperation and discussions.
Notes and references
- Q. Fu, C. Mabilat, M. Zahid, A. Brisse and L. Gautier, Energy Environ. Sci., 2010, 3, 1382 RSC.
- Y. Wang, T. Liu, L. Lei and F. Chen, Fuel Process. Technol., 2017, 161, 248 CrossRef CAS.
- X. Zhang, Y. Song, G. Wang and X. Bao, J. Energy Chem., 2017, 26, 839 CrossRef.
- C. Stoots, J. O'Brien and J. Hartvigsen, Int. J. Hydrog. Energy, 2009, 34, 4208 CrossRef CAS.
- S. Diethelm, J. V. Herle, D. Montinaro and O. Bucheli, Fuel Cells, 2013, 13, 631 CrossRef CAS.
- S. W. Kim, H. Kim, K. J. Yoon, J. H. Lee, B. K. Kim, W. Choi, J. H. Lee and J. Hong, J. Power Sources, 2015, 280, 630 CrossRef CAS.
- Y. Tao, S. D. Ebbesen and M. B. Mogensen, J. Power Sources, 2016, 328, 452 CrossRef CAS.
- X. Yang and J. T. S. Irvine, J. Math. Chem., 2008, 18, 2349 RSC.
- S. D. Ebbesen and M. Mogensen, J. Power Sources, 2009, 193, 349 CrossRef CAS.
- T. Chen, W. G. Wang, H. Miao, T. Li and C. Xu, J. Power Sources, 2011, 196, 2461 CrossRef CAS.
- J. Zhang and D. J. Young, Corros. Sci., 2007, 49, 1496 CrossRef CAS.
- Y. Tao, S. D. Ebbesen, W. Zhang and M. B. Mogensen, ChemCatChem, 2014, 6, 1220 CAS.
- W. Wang, C. Su, Y. Wu, R. Ran and Z. Shao, Chem. Rev., 2013, 113, 8104 CrossRef CAS PubMed.
- N. Bogolowski, B. Iwanschitz and J.-F. Drillet, Fuel Cells, 2015, 15, 711 CrossRef CAS.
- U. Guharoy, E. Le Saché, Q. Cai, T. R. Reina and S. Gu, J. CO2 Util., 2018, 27, 1 CrossRef CAS.
- D. Maiti, Y. A. Daza, M. M. Yung, J. N. Kuhn and V. R. Bhethanabotla, J. Mater. Chem. A, 2016, 4, 5137 RSC.
- S. E. Yoon, J. Y. Ahn, B. K. Kim and J. S. Park, Int. J. Hydrogen Energy, 2015, 40, 13558 CrossRef CAS.
- X. Yue and J. T. S. Irvine, J. Mat. Chem. A, 2017, 5, 7081 RSC.
- M. Torrell, S. Garcia-Rodriguez, A. Morata, G. Penelas and A. Tarancon, Faraday Discuss., 2015, 182, 241 RSC.
- F. Bustamante, R. M. Enick, A. V. Cugini, R. P. Killmeyer, B. H. Howard, K. S. Rothenberger, M. V. Ciocco, B. D. Morreale, S. Chattopadhyay and S. Shi, AIChE J., 2004, 50, 1028 CrossRef CAS.
- G. Pekridis, K. Kalimeri, N. Kaklidis, E. Vakouftsi, E. F. Iliopoulou, C. Athanasiou and G. E. Marnellos, Catal. Today, 2007, 127, 337 CrossRef CAS.
- Q. Sun, C. W. Liu, W. Pan, Q. M. Zhu and J. F. Deng, Appl. Catal., A, 1998, 171, 301 CrossRef CAS.
- S. I. Fujita, M. Usui and N. Takezawa, J. Catal., 1992, 134, 2 CrossRef.
- S. S. Kim, H. H. Lee and S. C. Hong, Appl. Catal., A, 2012, 423–424, 100 CAS.
- K. Zhao, Q. Bkour, X. Hou, S. W. Kang, J. C. Park, M. G. Norton, J. I. Yang and S. Ha, Chem. Eng. J., 2018, 336, 20 CrossRef CAS.
- L. Wang, H. Liu, Y. Liu, Y. Chen and S. Yang, J. Rare Earths, 2013, 31, 969 CrossRef CAS.
- S. Choi, B.-I. Sang, J. Hong, K. J. Yoon, J.-W. Son, J.-H. Lee, B.-K. Kim and H. Kim, Sci. Rep., 2011, 7, 41207 CrossRef PubMed.
- A. Wolf, A. Jess and C. Kern, Chem. Eng. Technol., 2016, 39, 1040 CrossRef CAS.
- M. Mogensen, T. Lindegaard, U. R. Hansen and G. Mogensen, J. Electrochem. Soc., 1994, 141, 2122 CrossRef CAS.
- M. Mogensen, N. M. Sammes and G. A. Tompsett, Solid State Ionics, 2000, 129, 63 CrossRef CAS.
- H. Liu, C. Zhao and L. Wang, J. Chem. Eng. Jpn., 2016, 49, 16 CrossRef.
- M. Kovacevic, B. Mojet, J. van Ommen and L. Lefferts, Catal. Lett., 2016, 146, 770 CrossRef CAS.
- Y. A. Daza, R. A. Kent, M. M. Yung and J. N. Kuhn, Ind. Eng. Chem. Res., 2014, 53, 5828 CrossRef CAS.
- P. Tanasini, M. Cannarozzo, P. Costamagna, A. Faes, J. Van Herle, A. Hessler-Wyser and C. Comninellis, Fuel cells, 2009, 5, 740 CrossRef.
- C. W. Bale, P. Chartrand, S. A. Degterov, G. Eriksson, K. Hack, R. Ben Mahfoud, J. Melancon, A. D. Pelton and S. Petersen, Calphad, 2002, 26, 189 CrossRef CAS.
- H. Sartipizadeh, T. L. Vincent and R. J. Kee, Proceedings of the American Control Conference, ACC 2015, Chicago, IL, USA, July 1-3, 2015, p. 5641 Search PubMed.
- Z. Jaworski, B. Zakrzewska and P. Pianko-Oprych, Rev. Chem. Eng., 2016, 33, 217 Search PubMed.
Footnote |
| † Electronic supplementary information (ESI) available. See DOI: 10.1039/d0ra00362j |
| This journal is © The Royal Society of Chemistry 2020 |

