
 Open Access Article
 This Open Access Article is licensed under a Creative Commons Attribution-Non Commercial 3.0 Unported Licence
The impact of ZnO configuration as an external layer on the sensitivity of a bi-layer coated polymer optical fiber probe
Zahra Samavatia,
Alireza Samavati a,
Ahmad Fauzi Ismail*a,
N. Yahyab,
M. H. D. Othmana,
M. A. Rahmana,
M. A. A. Bakara and
I. S. Amiri*cd
a,
Ahmad Fauzi Ismail*a,
N. Yahyab,
M. H. D. Othmana,
M. A. Rahmana,
M. A. A. Bakara and
I. S. Amiri*cd
aAdvanced Membrane Technology Research Centre, Universiti Teknologi Malaysia (UTM), Johor Bahru, 81310, Malaysia. E-mail: afauzi@utm.my
bDepartment of Fundamental and Applied Sciences, Universiti Teknologi Petronas (UTP), Bandar Seri Iskandar, 32610, Malaysia
cComputational Optics Research Group, Advanced Institute of Materials Science, Ton Duc Thang University, Ho Chi Minh City, Vietnam. E-mail: irajsadeghamiri@tdtu.edu.vn
dFaculty of Applied Sciences, Ton Duc Thang University, Ho Chi Minh City, Vietnam
First published on 31st March 2020
Abstract
Salinity magnitude changes are a critical factor for determining the chemistry of natural water bodies and biological processes. Label-free refractive index sensors are promising devices for detecting these changes. A polymer optical fiber (POF) sensor modified with cladding treatment and a bi-layer zinc oxide/silver (ZnO/Ag) nanostructure coating to determine sodium chloride concentration changes through refractive index variations in water is experimentally demonstrated. The use of three ZnO nanostructure shapes, nanoparticles and horizontally and vertically oriented nanorods, as an external layer and a broad spectrum light source from the visible (Vis) to the near infrared (NIR) region are investigated to achieve optimum sensitivity. The rms roughness, optical band-gap and zeta potential (ZP) value for the vertically oriented sample are 148 nm, 3.19 eV and 5.96 mV, respectively. In the NIR region the wavelength–intensity sensitivity values of probes coated with ZnO nanoparticles and horizontally and vertically oriented nanorods are 104 nm RIU−1–12 dB RIU−1, 63 nm RIU−1–10 dB RIU−1 and 146 nm RIU−1–22 dB RIU−1, respectively, and in the Vis area the values are 65 nm RIU−1–14 dB RIU−1, 58 nm RIU−1–11 dB RIU−1 and 89 nm RIU−1–23 dB RIU−1, respectively. The maximum amplitude sensitivity is obtained for the probe coated with vertically aligned ZnO nanorods in the NIR area due to the deeper penetration of evanescent waves, a higher surface-volume ratio, better crystallinity, more adhesive interactions with salt molecules, larger surface roughness and higher-order dispersion compared to the other coated ZnO nanostructures.
1. Introduction
Optical fiber sensors due to their high sensitivity, easy fabrication, immunity to electromagnetic interference and micro size dimension are suitable for a variety of sensing applications. Predictable changes in the light transmission characteristics of the fiber, because of alterations in the parameters being measured are the sensing principles of optical fiber sensors.1,2 Silica optical fiber evanescent wave sensors are an example of large-scale analytical instruments that are used in devices for incorporating biological recognition elements3,4 and monitoring parameters such as a wide range of gases,5,6 pH,7 temperature,8 humidity,9,10 ions11 and refractive index.12–14 This wide application range is due to its robustness, immunity to electromagnetic interference, high sensitivity, high selectivity, high integration, and potential portability for in situ and online measurements.15 However, silica optical fiber-based sensors because of their low tensile strength are brittle; therefore, sensor manufacturing, connectorization, installing and terminating processes are difficult, especially in harsh environments. To overcome this problem polymer optical fiber (POF), which has higher flexibility, higher fracture toughness, and is more economical is employed for sensor fabrication.16–19 Recently, nanocoating of fiber probes because of the enhancement of sensitivity and improvement of the dynamic range, robustness and lifetime, has inspired a line of research in the field of optical fiber sensors.20–23 These improvements are achieved because the nanostructure coating can provide additional mesoporosity, roughness, antibacterial behavior, localized surface plasmon resonances and quantum confinement effects to the bare fiber. ZnO and Ag nanolayers as well as their multilayer combination, due to their multifunctional properties such as band-gap tailoring, localized surface plasmon resonance effects, electrochemical stability, non-toxicity and suitability for doping are employed to coat the optical fiber probe.24–27 An Ag–ZnO nanocomposite coated on POF as an intensity modulated humidity sensor was reported by Jagtap et al. They reported that the sensing mechanism is based on the adsorption of water molecules on the coated layer surface, which effectively results in changes in the boundary conditions due to the surface reactional cladding-guide interface and increases the beam confinement in the fiber which modulates the output intensity.28 Therefore, the material selection and structure configuration of the coated nanostructure play a crucial role in the sensor performance. To the best of our knowledge, POFs coated with a bi-layer ZnO/Ag nanostructure with different shapes of ZnO as the outer layer to detect the refractive index changes of solution have not been reported elsewhere. In this paper, a POF probe is fabricated and its sensitivity against the refractive index gradient of saline solution is comprehensively investigated using theoretical background and experimental approaches via a variety of characterization techniques.2. Experimental
2.1 Materials
Acetone 99.5%, methanol 99.8%, silver nitrate 98%, ammonia solution 25%, zinc nitrate hexahydrate 98%, sodium hydroxide 98%, tin(II) chloride 98%, palladium(II) chloride 99%, boron hydride dimethylamine 98%, hydrochloric acid 37%, zinc acetate dihydrate 98%, triethylamine 99.5%, isopropyl alcohol 99.5%, hexamethylenetetramine 99.0% and sodium chloride 98% manufactured by Sigma-Aldrich are used without any further purification. Multimode POF with a diameter of 486 μm and 14 μm for core and cladding, respectively, was purchased from Jiangxi Daishing POF company. The cladding material is fluorinated polymethyl methacrylate (PMMA) with a refractive index of 1.402, and the core is made of PMMA with a refractive index of 1.492.2.2. Cladding modification
2.3. Coating with Ag nanoparticles as an inner layer
The Ag nanoparticles as a first layer are discontinuously deposited on the partially removed cladding part using an electroless technique. The sensing part of the POF is immersed in 20 mL, 0.1 mol L−1 AgNO3 solution. Then, for surface activation, Ag is converted to Ag2O by adding 15 drops of 0.2 mol L−1 NaOH into the solution. After that, 2 mol L−1 ammonia is added slowly to the solution and the glassware is shaken until the precipitate is dissolved totally. At last, 10% concentration glucose solution is added and kept in the 70 °C water bath for 15 min. For a discontinuous Ag coating the fiber should not remain in the final coating solution for more than 15 min therefore, before this time is over, the probe is taken out from the solution and further processed for washing and drying. The FESEM cross section image of the Ag coated probe in Fig. 1 shows that the remaining cladding and Ag thickness is ∼100 nm and ∼20 nm, respectively.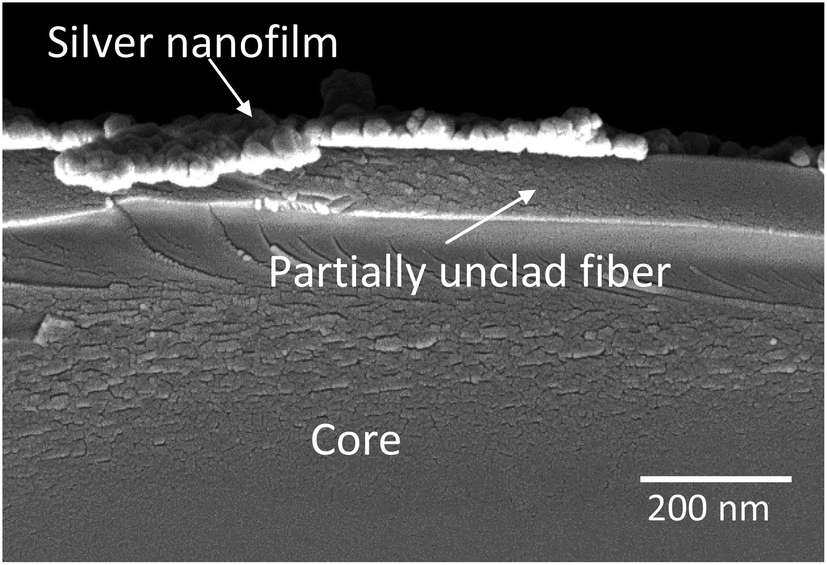 | ||
| Fig. 1 A cross sectional FESEM image of deposited Ag nanoparticles on a partially unclad POF. The remaining cladding and Ag nanolayer are shown by arrows and their thicknesses are ∼100 nm and ∼20 nm, respectively. | ||
2.4. Coating with a different ZnO nanostructure as an outer layer
The Ag/POF sample is now subjected to the deposition of three different ZnO nanostructures including nanoparticles and horizontally and vertically oriented nanorods as an outer layer (sensing layer) using the electroless method. Before ZnO deposition processes begin, the inner layer for all samples need to be activated. The activation process includes: (i) the etching process with tin(II) chloride which roughens the surface of the probe and allows catalyst retention in later stages. (ii) Catalyst treatment using palladium(II) chloride and formation of a tin-palladium chloride complex on the surface. (iii) Decomposition and hydrolysis of the catalyst complex via rinsing in order to stabilize the palladium(II) and tin(II) on the surface. (iv) Accelerating treatment by converting the hydrolyzed catalyst into the active form, through assisting a surface redox reaction by sodium hydroxide or triethylamine. (v) Post accelerating treatment via inducing the active palladium nuclei by removing the tin(IV) compound through the rinsing process. After this surface activation procedure, the probe surface is now ready to adsorb the ZnO nanostructure with different shapes as explained below one at a time. The Ag-coated part is dipped in an aqueous sensitization solution of 40 g L−1 SnCl2 and 20 mL L−1 HCl (37% vol) for 30 min. Then samples are rinsed in distilled water and after that immersed in 0.1 g L−1 PdCl2 and 20 mL L−1 HCl (37% vol) as an activation solution at room temperature for 30 min. The activated layer is formed homogeneously when the above two steps are repeated three times. This sample is then ready for the final step which is the deposition of different ZnO nanostructures one at a time.The heterostructure sensing probe is fabricated by coating the ZnO nanoparticles on top of Ag/POF via several processes depicted below. (i) 2.28 g of zinc nitrate hexahydrate is dissolved in 75 mL of deionized water at a constant temperature of 70 °C. (ii) 0.6 g of NaOH in 150 mL of deionized water is added to the solution drop-wise under magnetic stirring for 30 min and then the final solution is cooled down. (iii) In order to coat the fiber with ZnO nanoparticles, fibers are immersed into the above aqueous deposition solution at 70 °C for 3 h without any stirring. (iv) After rinsing in distilled water and drying under ambient atmosphere the probe is ready for analysis and testing and we call it ZnO(NPs)/Ag/POF.
The horizontally oriented ZnO nanorods are deposited on top of the Ag/POF to fabricate the second sample via the following steps. (i) Dissolving the 0.6 g zinc nitrate in 100 mL water and stirring for 30 min. (ii) Dissolving 0.16 g of NaOH in 150 mL of deionized water. (iii) Adding solution (ii) to (i) under stirring until the pH of the mixed solution reaches 8.3. (iv) Heating the mixed solution in a micro-oven for 10 min. (v) Cooling at room temperature and centrifuging at 4000 rpm for 10 min. (vi) Rinsing in distilled water. (vii) Immersing the fibers' probe part in the above prepared aqueous deposition solution which contains the ZnO nanorods under an ambient temperature of 70 °C for 3 h without any stirring. (viii) Finally, washing and drying the fiber probe. The sample name is ZnO(NRH)/Ag/POF.
Coating the vertically aligned ZnO nanorods on Ag/POF includes three steps of preparation of seed solution, preparation of growth solution and growth of nanorods on the fiber surface. For seed solution synthesis: (i) a 100 mM solution of zinc acetate dehydrate is prepared in 50.0 mL of isopropyl alcohol and then stirred vigorously at 70 °C for 15 min. (ii) 700 μL of 5.0 mmol triethylamine is added and stirred at 70 °C for another 10 min. (iii) This seed solution is cooled to room temperature and protected without stirring for 3 h. For the growth solution synthesis, (i) the amount of 7.71 g hexamethylenetetramine is dissolved in 550 mL of DI water. (ii) At the same time, 16.4 g of zinc nitrate hexahydrate is dissolved in 500 mL of DI water separately. (iii) These two solutions are mixed and stirred for 24 h at room temperature. For the nanorods growing on the surface of the prepared probe: (i) the Ag/POF sample is dip-coated in the seed solution for 2 h then dried at 70 °C. (ii) The sample is suspended in the growth solution and placed in the oven at 70 °C for 3 h. (iii) The sample cools down to room temperature, is thoroughly rinsed with DI water, and allowed to air-dry. The fabricated sample name is ZnO(NRV)/Ag/POF.
2.5. Sensor operation setup and its characterization
Fig. 2 shows the schematic diagram of the experiment setup. As shown in this figure, the light source is launched into one of the input ports, and an optical spectral analyzer is used to detect the light signals at the output ends. The salt-water solutions with different volume concentrations (different refractive index) are prepared as the measured external liquids. The refractive index of the solutions is measured by an Abbe refractometer and labeled by the equation n = 0.001C + 1.333, where C is the volume concentration of the saline at room temperature.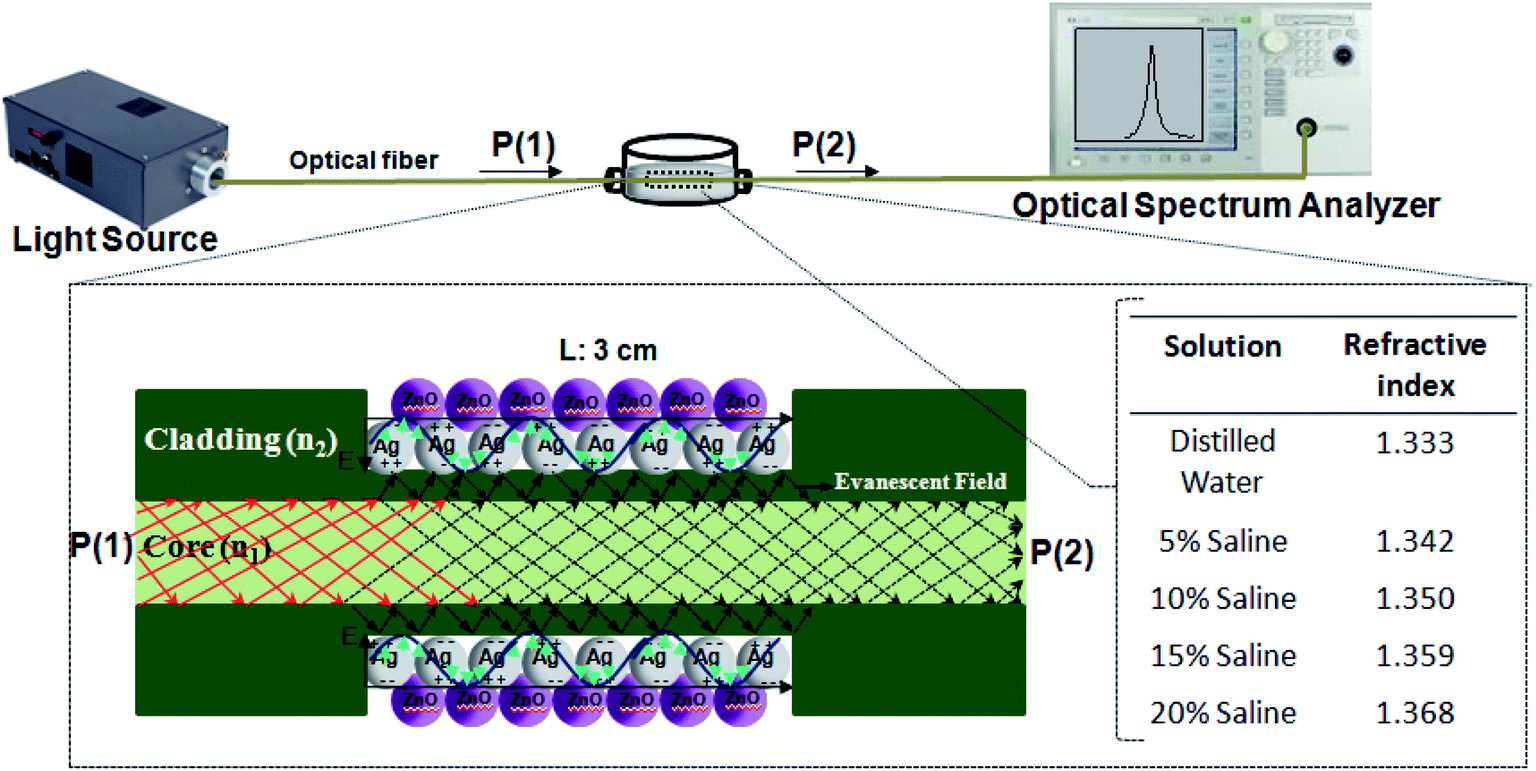 | ||
| Fig. 2 A schematic drawing of the experimental setup. The fabricated probe is immersed in saline with different concentrations from 0 to 20%. The two ends are connected to the light source and OSA. | ||
The growth morphology and structure of the probes are characterized using a field emission scanning electron microscope (FESEM, JEOLJSM 6380LA) attached to an energy dispersive X-ray spectrometer (EDX), AFM (SPI3800) built by Seiko Instrument Inc. (SII) and XRD (Bruker D8 Advance Diffractometer) using Cu-Kα1 radiations (1.540 Å) at 40 kV and 100 mA. The scanning range of 2θ is from 20° to 80°. The optical behavior of samples including photoluminescence and absorption is studied by room temperature photoluminescence (PerkinElmer LS 55 Luminescence Spectrometer) using a xenon flash lamp under a 334 nm excitation wavelength and LAMBDA 1050 UV-VIS/NIR spectrophotometers. For determining the surface charges, the Zetasizer NanoZS instrument (Malvern Instruments Ltd., United Kingdom) is employed. Thorlabs' Stabilized Light Sources with a wavelength range of 360–2600 nm and an optical spectrum analyzer (OSA) (Yokogawa AQ6374) are used as the light source and detector, respectively.
3. Results and discussion
3.1. Structure and morphology study of the probe
The bi-layer ZnO/Ag coated on partially unclad POFs is analyzed using FESEM and the cross-section and top-view images are depicted in Fig. 3. The homogeneous formation of ZnO nanoparticle, ZnO horizontal nanorod and ZnO vertical nanorod samples ZnO(NPs)/Ag/POF, ZnO(NRH)/Ag/POF and ZnO(NRV)/Ag/POF, respectively, is confirmed by the FESEM images. ImageJ software is used for scaling the size distribution of the ZnO nanoparticles and nanorods and the diagram is shown as a bar chart in Fig. 4. The average nanoparticles size is ∼38 nm. The width/length of the horizontally and vertically oriented nanorods are ∼63/546 nm and ∼83/689 nm, respectively. The EDX spectra shown in Fig. 3(b, d and f) represent the qualitative and quantitative elemental analysis of sensors and demonstrates that no obvious chemical reactions or element migration between layers occurred during the fabrication of the sensors. The presence of C, O, Zn and Ag depicts the formation of bi-layer ZnO/Ag on top of partially unclad POF.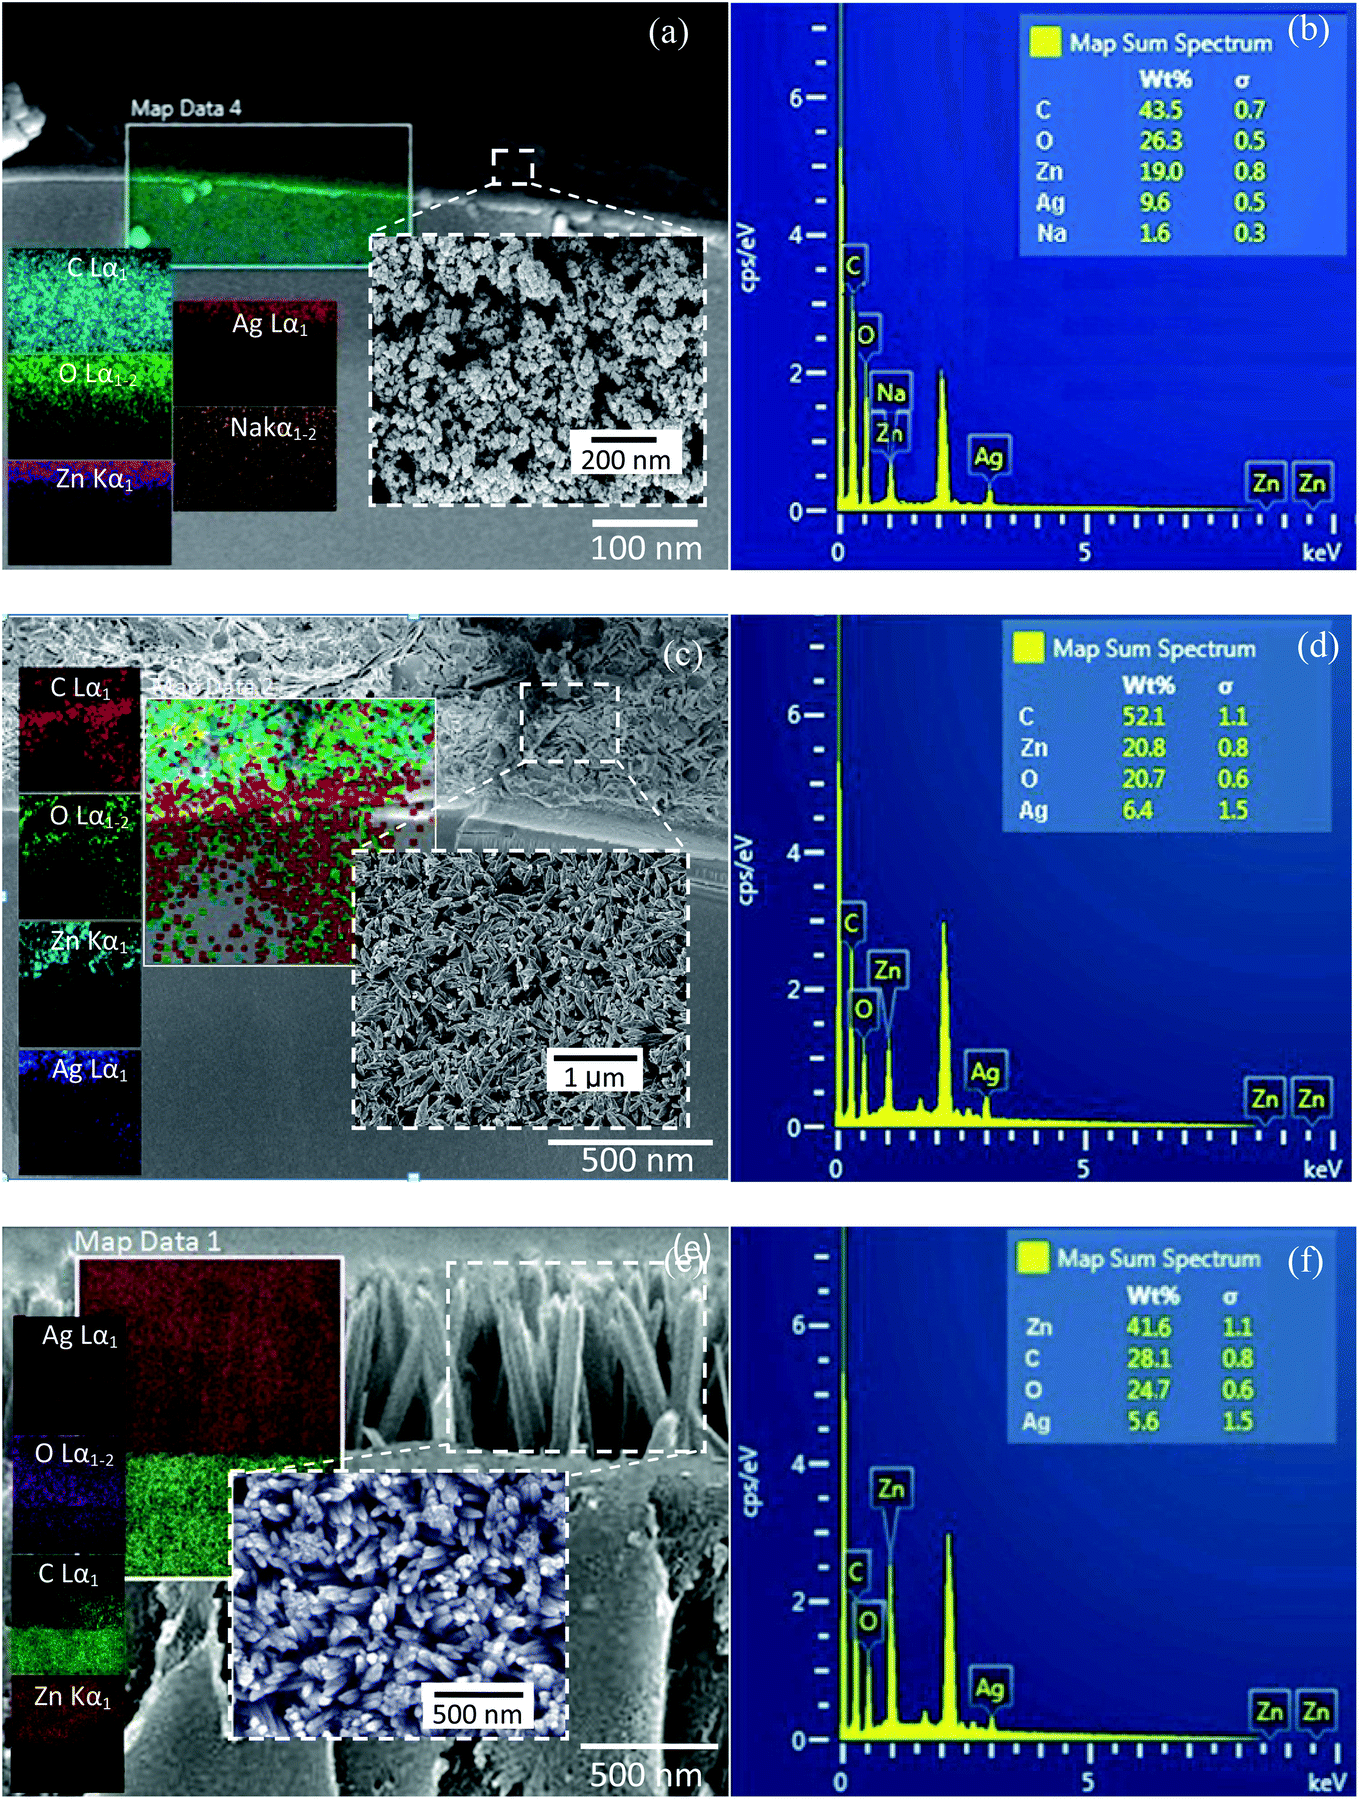 | ||
| Fig. 3 FESEM-EDX analysis. Cross sectional FESEM micrographs, EDX spectra and elemental mapping of (a and b) ZnO(NPs)/Ag/POF, (c and d) ZnO(NRH)/Ag/POF and (e and f) ZnO(NRV)/Ag/POF samples. The insets show corresponding top-view FESEM images. | ||
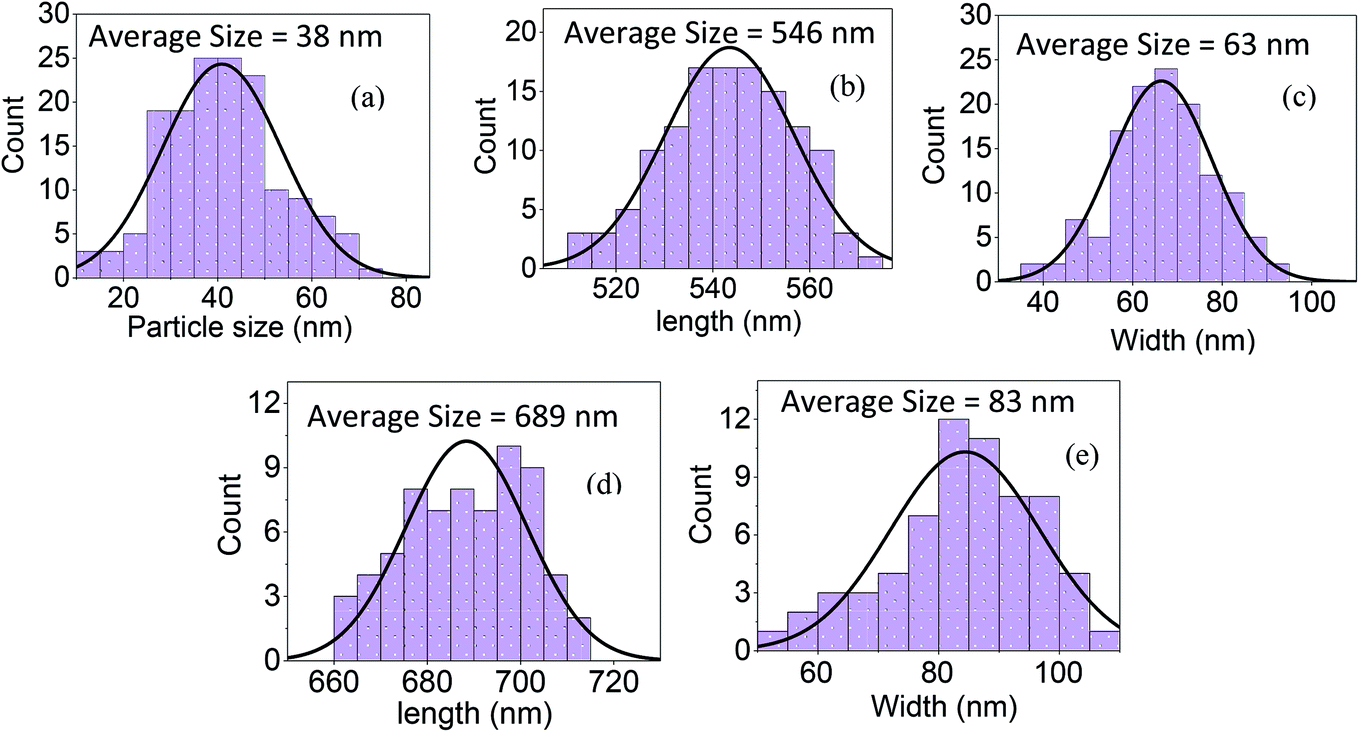 | ||
| Fig. 4 Histograms of ZnO nanostructure size distributions determined with ImageJ software: (a) nanoparticles, (b and c) horizontally oriented nanorods, and (d and e) vertically oriented nanorods. The size distribution is determined by measuring a sample consisting of 160 ZnO nanoparticles, 130 horizontal nanorods, and 70 vertical nanorods. | ||
The XRD patterns of the ZnO nanostructures coated on the Ag/polymer substrate are shown in Fig. 5 and they indicate that ZnO has a hexagonal unit cell structure. The peaks at 2θ = 31.7°, 34.4°, 36.2°, 47.5°, 56.6°, 62.8°, 66.5°, 69.2° and 75.8° are associated to lattice planes of (100), (002), (101), (102), (110), (103), (112), (201) and (202), respectively, and are in good agreement with the standard JCPDS card no. 36-1451. In each individual sample, the intensities of the diffraction peaks are varied, which indicate the anisotropic growth of ZnO in various planes (directions). It is observed that the full width at half maximum (FWHM) of the reflection peaks increases going from the ZnO(NRV) to the ZnO(NPs) sample. This broadening of the peaks for the ZnO nanoparticles coated sample may be due to the lattice mismatch, lattice distortion and strain presented in the nanoparticles as well as its smaller crystal size. Although all the reflections vary with changing the ZnO nanostructure shape, the most notable change is observed for the (002) peak, for the ZnO(NRV) sample this peak is more intense, indicating growth along the polar c-axis of ZnO perpendicular to the substrate. The small signal at 2θ = 38° is assignable to the Ag (111) plane corresponding to the Ag nanofilm deposited under the ZnO nanostructure. The wurtzite structure of the ZnO nanorods has two types of crystal planes including the polar (001) plane, and no central symmetry such as (101) and (100). The crystal planes with greater surface energy have a faster growth rate, as a result, the growth rate of the planes in the [001] direction is more than that of the planes in the [100] direction. Therefore, the (002) diffraction peak in the XRD patterns was dominant for the ZnO nanorods grown vertically. Strong and sharp ZnO (002) peaks of the ZnO nanorods were observed, indicating that the aligned ZnO nanorods were preferentially fabricated along the c-axis of the hexagonal wurtzite structure and perpendicular to the substrates.
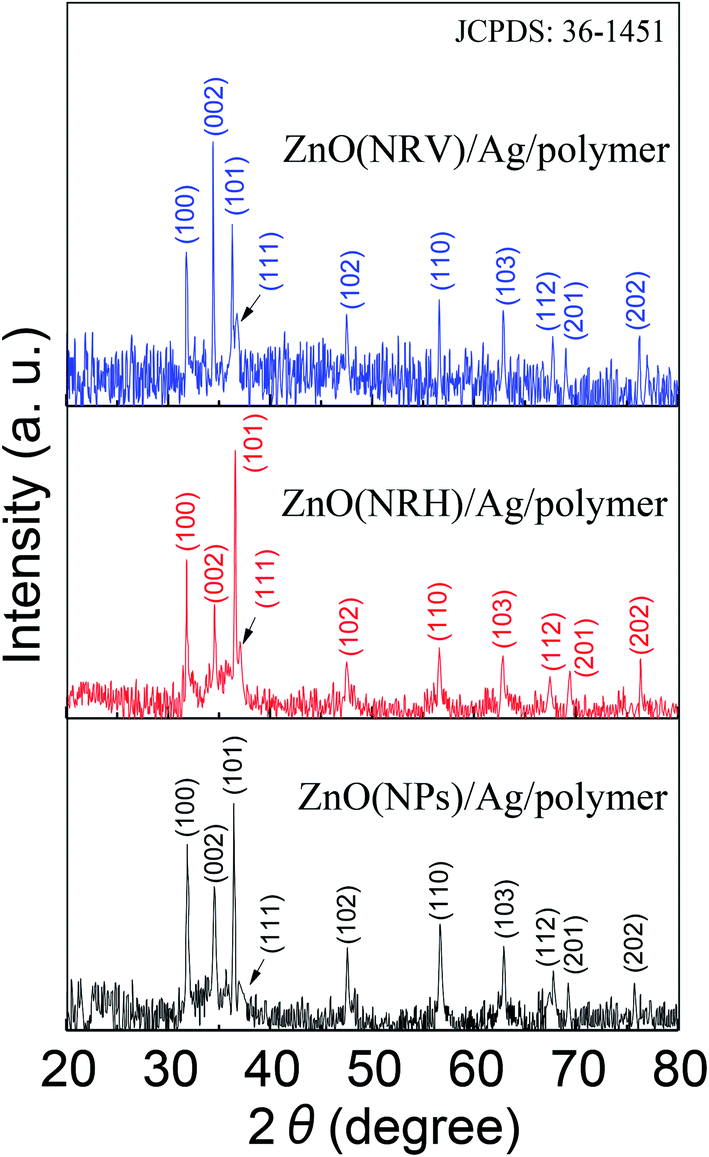 | ||
| Fig. 5 The XRD patterns of the ZnO nanostructures deposited on the Ag/polymer substrate. The peaks observed at 2θ values of 31.7°, 34.4°, 36.2°, 47.5°, 56.6°,62.8°, 66.5°, 69.2° and 75.8° match perfectly with the (100), (002), (101), (102), (110), (103), (112), (201) and (202) crystalline planes of the hexagonal wurtzite structure of ZnO reported in JCPDS: 36-1451 with lattice parameters of a = b = 3.250 Å and c = 5.207 Å. | ||
Fig. 6 displays the 3D AFM topographic images of the samples. The grain size of the nanoparticles extracted from the figure is ∼48 nm and for the vertical nanorods, the width and height are measured to be ∼87 nm and 694 nm, respectively. The orientation and sizes of the horizontally aligned nanorods are difficult to define solely from the AFM measurements. The rms roughness extracted from AFM is 39 nm, 52 nm and 148 nm for the ZnO(NPs)/Ag/POF, ZnO(NRH)/Ag/POF and ZnO(NRV)/Ag/POF samples, respectively. The sample with vertically aligned nanorods exhibits a larger surface roughness compared to others which indicates that this sample has a higher surface/volume ratio as compared to the other ZnO nanostructures.
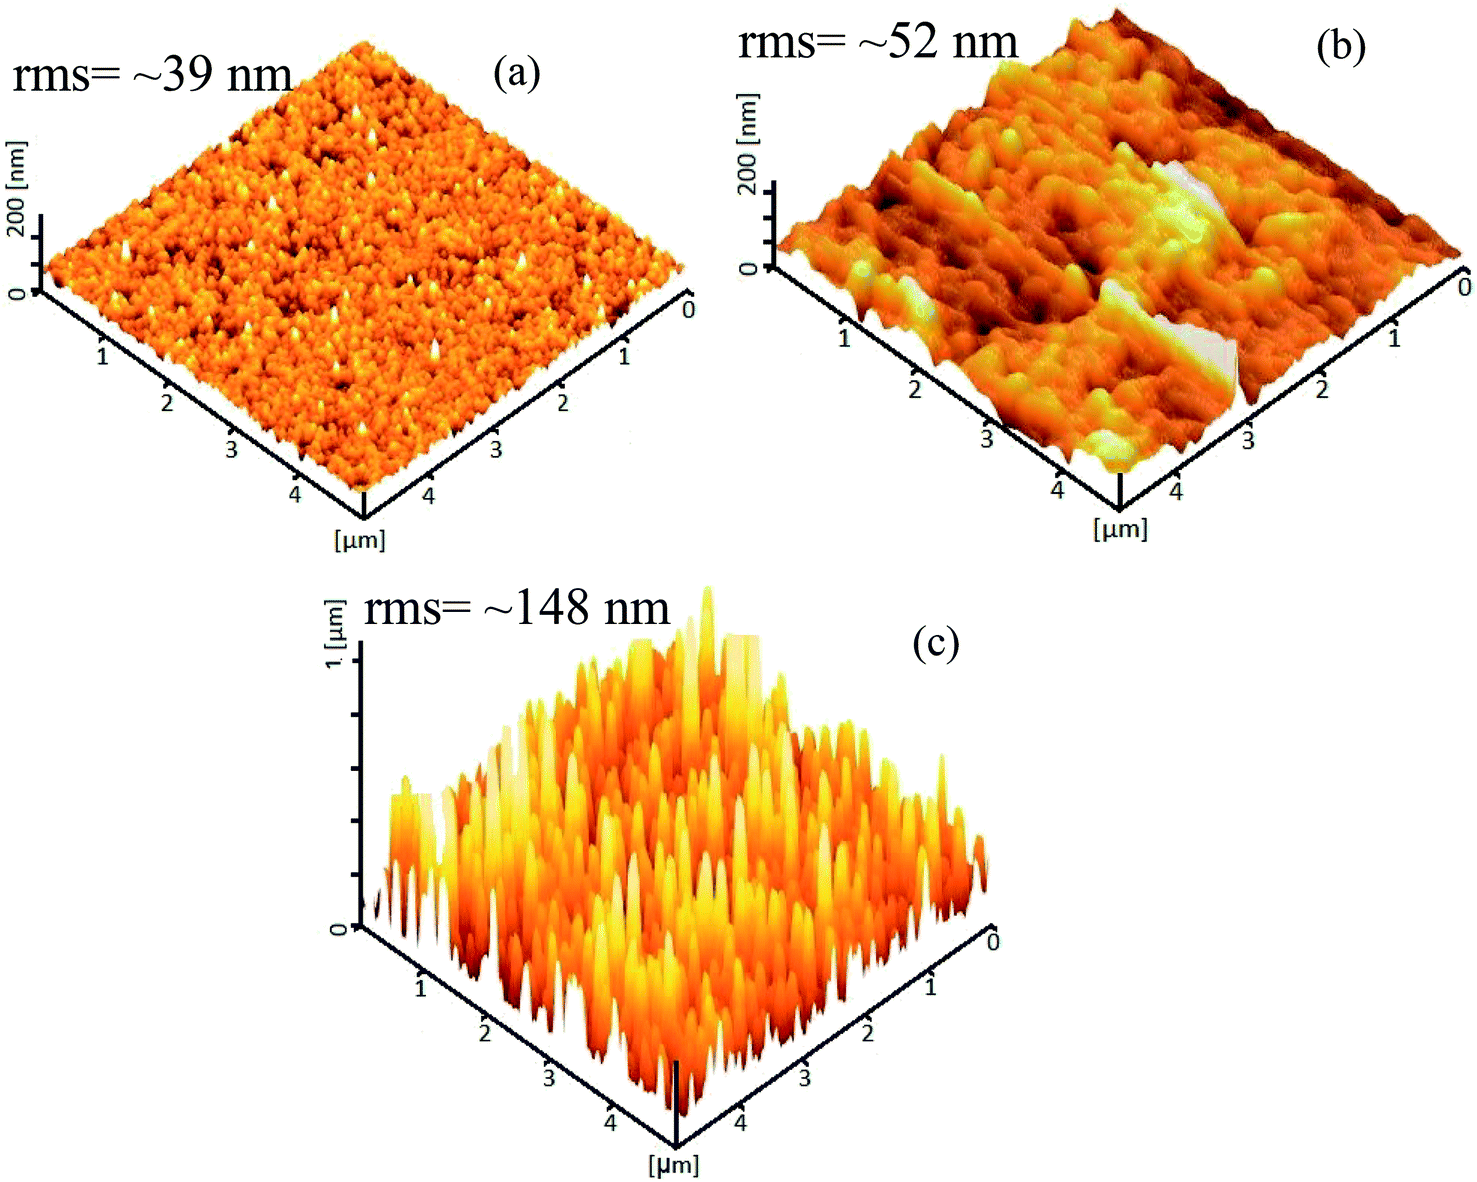 | ||
| Fig. 6 AFM topographic 3D images of ZnO (a) nanoparticles, (b) horizontal nanorods, and (c) vertical nanorods deposited on Ag/POF. | ||
Zeta potential (ZP) analysis is carried out to study the charge accumulation on the ZnO nanostructure surface and their complexation with other media constituents and the results are tabulated in Table 1. Data reported from the ZP for all samples shows that with increasing saline concentration, the absolute value of the zeta potential increases, which indicates acceleration of the sedimentation and the existence of more Cl− on the surface of the ZnO nanostructure. When an ionic compound such as sodium chloride dissolves in water, the solution contains sodium ions (Na+) and chloride ions (Cl−). Each ion of the sodium chloride crystal becomes surrounded by water molecules, with the negative end of the water molecules approaching closest to the positive sodium ions, and the positive end of the water molecules surrounding the negative chloride ions. The water molecules pull these ions, one by one, away from the rest of the crystal. By introducing an individual ion into the bulk water, some of the hydrogen bonds (H-bonds) between the water molecules are broken and consequently the water molecules around the ions reoriented. Formation of the hydrated ion pairs or larger ion clusters (Cl−) results in further breaking of H-bonds.30 Small ions (for example Na+) have high charge densities resulting in strong electrostatic ordering of nearby waters, breaking hydrogen bonds. In contrast, large ions (Cl−) have low charge densities and surrounding water molecules are largely hydrogen bonded and less hydrogen bonds are broken by them. Therefore, a higher freedom level for Cl− is expected in the solution.31 By increasing the saline concentration, a higher availability of Cl− in the solution than Na+ causes them to easily move to the ZnO nanostructure surface and interact with them.
| Salinity (%) | ZnO(NPs)/Ag/POF (mV) | ZnO(NRH)/Ag/POF (mV) | ZnO(NPV)/Ag/POF (mV) |
|---|---|---|---|
| Distilled water | 2.38 | 0.43 | 5.96 |
| 5% | −2.43 | −0.57 | −9.85 |
| 10% | −3.59 | −1.00 | −11.02 |
| 15% | −4.65 | −1.90 | −13.58 |
| 20% | −6.60 | −1.67 | −15.84 |
The absolute amount of ZP is higher for the ZnO(NRV)/Ag/POF sample either in zero percent salinity (distilled water) or in saline solution. The structure of ZnO can be described as a number of alternating planes composed of tetrahedrally coordinated O2− and Zn2+ ions, stacked alternately along the c-axis causing spontaneous polarization along the c-axis. Thus, in vertically oriented ZnO nanorods the positive charge distribution near the surface is higher than the horizontally oriented one therefore, its ZP is higher when immersed in distilled water. A higher amount of surface charge and functional groups originating from a larger surface area and a lower number of aggregated ZnO molecules for the vertically oriented nanorod sample (see schematic diagram in Fig. 7) are responsible for the observation of a higher absolute ZP and its corresponding variants once immersed in saline solution.
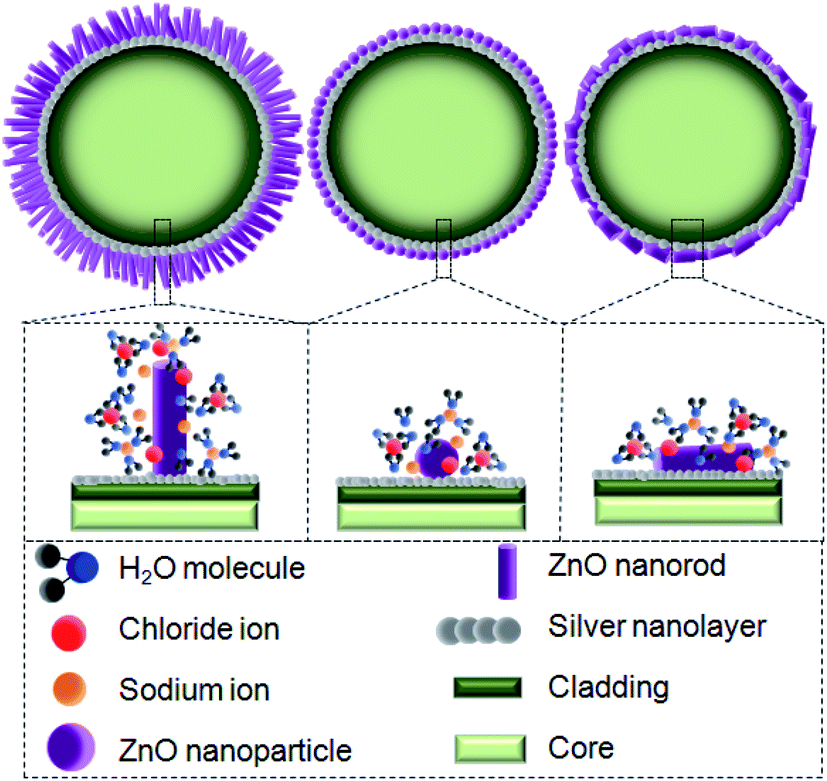 | ||
| Fig. 7 A schematic diagram of the shape dependent charge distribution on the ZnO nanostructure surface. Vertically oriented nanorods due to a higher surface area have better adhesion and interaction with saline molecules. | ||
3.2 Optical characteristics of the bi-layer ZnO/Ag/polymer
The optical behavior of the deposited ZnO/Ag/polymer substrate was studied by photoluminescence (PL) spectroscopy at room temperature and the results are shown in Fig. 8. Various shapes of the ZnO nanostructures including nanoparticles and nanorods exhibit two distinguishable luminescence signals. Emission at a short wavelength band, which is near to the absorption edge of the crystal known as near band edge (NBE) and a broad long-wavelength emission, centered at the green spectral range known as deep level emission (DL) are observed (Fig. 8). The NBE luminescence maximum has an excitonic nature and is located at ∼3.45 eV, ∼3.23 eV and ∼3.19 eV for the ZnO(NPs)/Ag/polymer, ZnO(NRH)/Ag/polymer and ZnO(NRV)/Ag/polymer samples, respectively. The NBE emission is altered when the ZnO configuration changes which is attributed to residual stress/strain caused by morphology and size dependent structural imperfections of the ZnO crystals. The electrons confine at different nano-scale dimensions and the band gap modifies due to the quantum confinement effect. For the green luminescence the convolution of the following luminescence emissions is responsible: (1) zinc vacancies (VZn), (2) oxygen vacancies (VO), (3) interstitial zinc ions (Zni), (4) oxygen antisites (OZn), and (5) transitions of electrons from Zni to VZn. Various centers may be involved in the green luminescence simultaneously because of imperfections of the ZnO crystals, the instability of certain point defects, and the variety of their forms.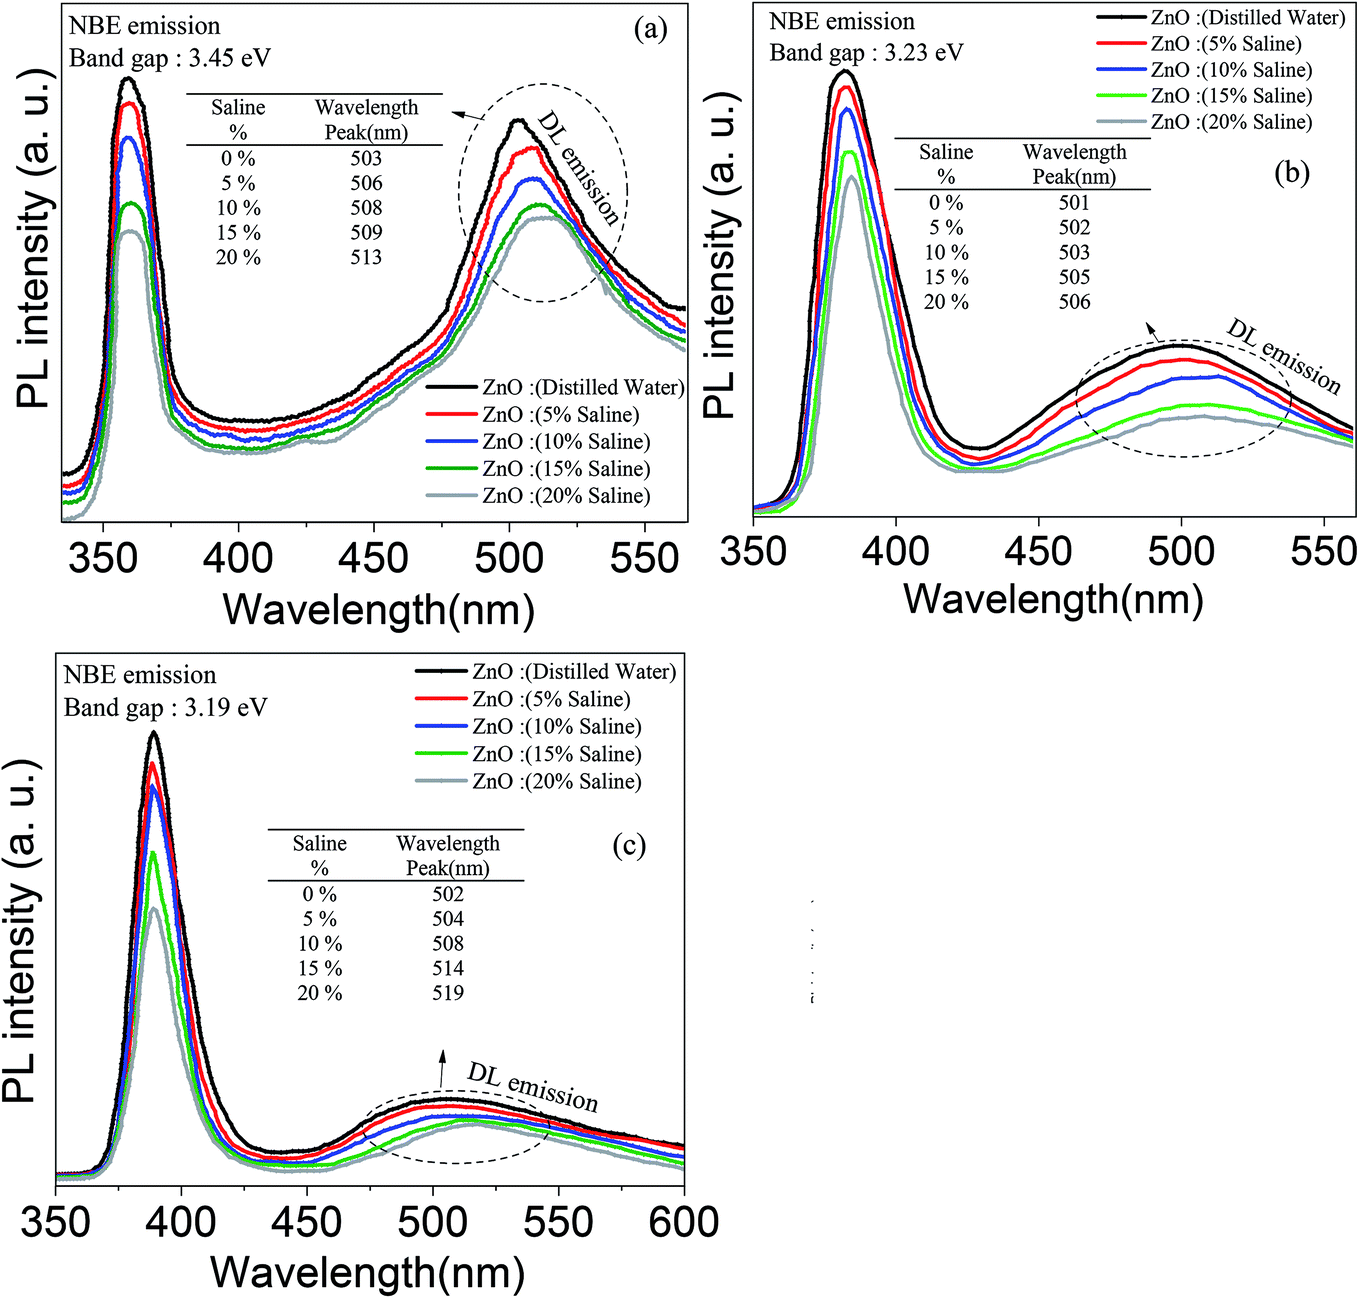 | ||
| Fig. 8 Room temperature photoluminescence (PL) emission spectra for ZnO (a) nanoparticles, (b) horizontal nanorods, and (c) vertical nanorods deposited on an Ag/polymer substrate excited by 334 nm light. | ||
Increasing the saline concentration leads to the occurrence of a blue shift of ∼5 nm, ∼10 nm and ∼17 nm in deep level emission for the ZnO(NRH), ZnO(NPs), ZnO(NRV) samples, respectively. Electrons transferring to the deep energy level of the ZnO from the attached Cl− ions to the ZnO surface molecules are the origin of this blue shift. The formation of a thick depletion layer on the ZnO surface is due to the oxygen vacancies created on the surface of the ZnO nanostructure induced by dissolved oxygen in distilled water as can be seen in the schematic diagram in Fig. 9. As mentioned in the ZP analysis, a higher adsorption of Cl− on the ZnO surface from the surrounding environment takes place in a higher saline concentration solution and this modifies the depletion layer (see Fig. 9). Increasing the salinity decreases the depletion layer thickness because of the introduction of more Cl− ions and reducing the dissolved oxygen in the solution results in easier migration of electrons to the conduction band of the ZnO and alters the band gap. As explained earlier the ZP is higher for ZnO(NRV) samples therefore, a higher number of electrons from negative ions move to deeper energy levels compared to ZnO(NRH) and agglomerated ZnO(NPs), consequently the band gap changes and is higher for the ZnO(NRV) sample.
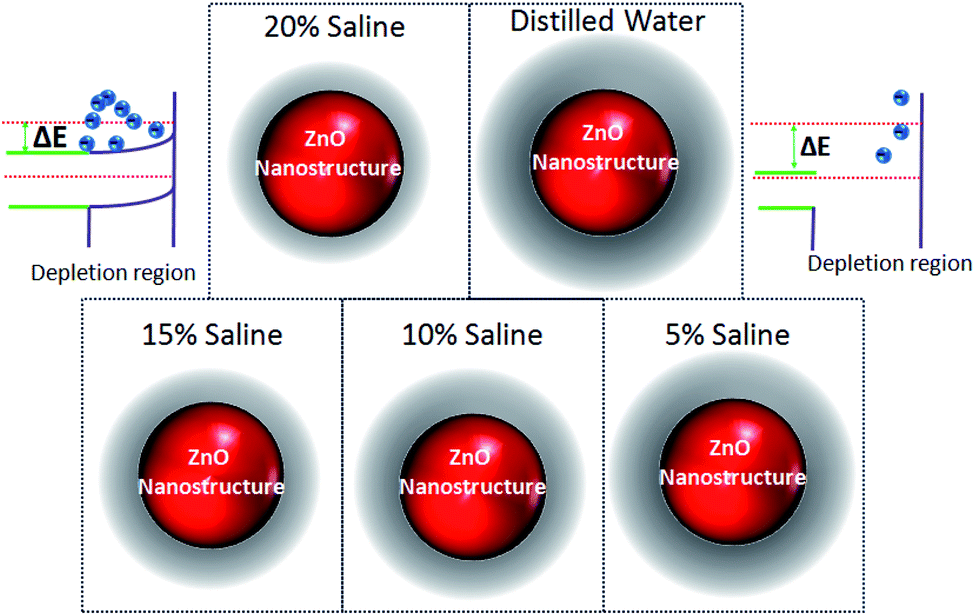 | ||
| Fig. 9 Schematic illustrations of changes in the band gap diagram of ZnO nanostructures due to alteration of the depletion layer width with saline concentration. | ||
The crystallinity level of the sample directly affects the ratio of NBE/DL. The PL spectrum of the ZnO nanoparticles exhibits stronger green emission compared to other nanostructures (the ZnO(NRV) and ZnO(NRH) samples). The lower structural defects in the larger sized crystal are responsible for this observation. The lower visible deep-level emission from the vertically oriented ZnO nanorods compared to other samples represents the defect-free and high quality formation of ZnO nanorods. This observation is consistent with the XRD spectra (Fig. 5).
The refractive index of the ZnO layer changes when its band gap is modified and this relationship was extracted from theory and experiment simultaneously and reported in our earlier research in which it was shown that by increasing the band gap the refractive index of ZnO exponentially decreases.32 Transfer of electrons to the ZnO energy bond occurred from two groups of electrons, first, the ZnO–saline interface electrons which were explained earlier and second, the electrons collected in the ZnO–Ag interface. Under irradiation of incident light with a wavelength larger than the particle size, the high-density electrons of the Ag nanoparticles form an electron cloud and oscillate. These electrons accumulated at the interface of Ag and ZnO and easily transfer to the downward band bending of the ZnO side and alter the band-gap of ZnO.
The absorbance spectra of saline with a variety of concentrations at the visible and IR regions are shown in Fig. 10. The dashed lines at 770, 940 and 1072 wavelengths are selected based on the absorbance of saline at three propagating main modes as presented in Fig. 11. In both regions increasing the salinity decreases the absorption as can be seen in the table inset in Fig. 10. By dissolving the ions in water and changing their structure, intermolecular and intramolecular interactions within the water molecule happened which consequently influenced the absorption spectrum. When a large quantity of salt was added to the water, the molecular concentration of water decreased. Na+ and Cl− ions decrease the average number of hydrogen bonds, reducing the absorption. Intramolecular vibrations are also dampened by the presence of salt in water, which leads to the formation of more structurally arranged water molecules with less freedom of the H–O–H angle. Therefore, the bending vibrations are reduced. Moreover, the length of the O–H bond is stricter because of the interactions with the ions in solution and both the symmetric and asymmetric vibrations are reduced. This hindering of the vibrations reduces the absorption bands therefore, increasing the amount of salt in water leads to a reduction in the absorption harmonics present in the near infrared and visible range. The higher absorption in the IR region compared to visible light is attributed to the stronger water absorption band harmonic in the IR wavelength.
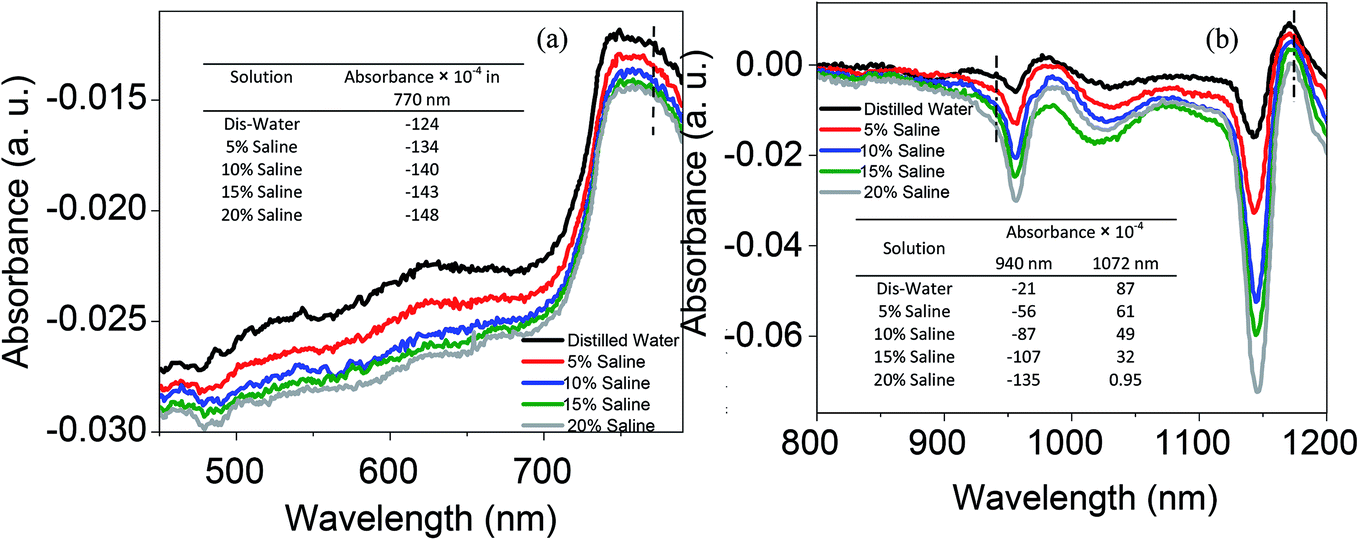 | ||
| Fig. 10 Absorption spectra of saline solutions of different concentrations in water measured using a LAMBDA 1050 UV-VIS/NIR spectrophotometer in the (a) visible and (b) IR ranges. The insets summarize that the absorption range for specific selected wavelengths matches with the main propagating modes through the fiber. | ||
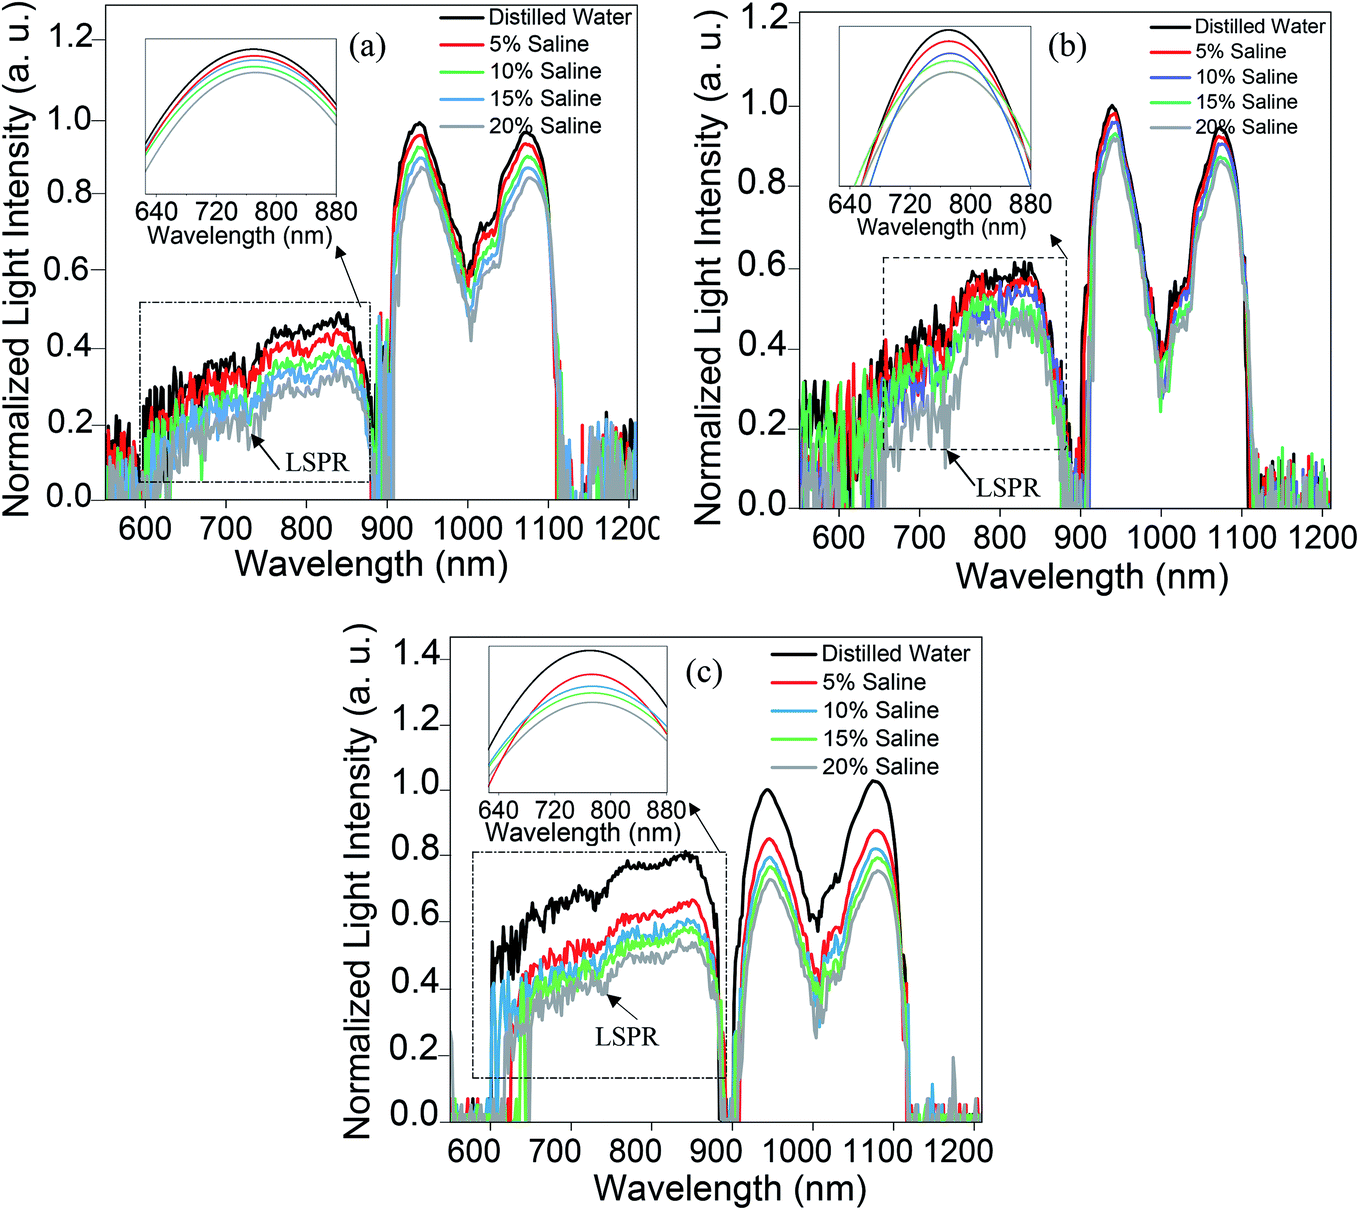 | ||
| Fig. 11 Transmission spectra of (a) ZnO(NPs)/Ag/POF, (b) ZnO(NRH)/Ag/POF and (c) ZnO(NRV)/Ag/POF fiber probes as a function of saline concentration. The insets show the Gaussian smoothed propagating mode centered at a wavelength of 770 nm. | ||
3.3 Sensing performance
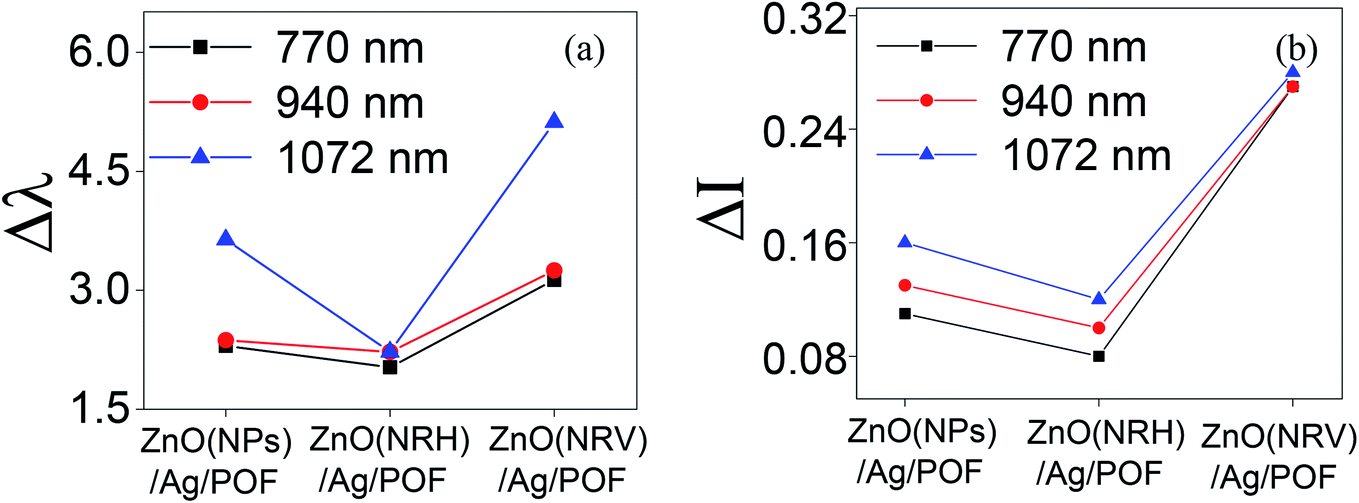
Fig. 11 displays the original emission spectra of the light passing through the probes together with the wavelength and intensity changes occurring in the main mode centered at 1072 nm wavelength. The spectra for all three main mode regions show intensity and wavelength modulation, when the probe is surrounded by saline with a variety of concentrations. However, the changes in intensity and wavelength for the sample ZnO(NRV)/Ag/POF are more prominent compared to the other samples. This greater sensitivity for the vertically deposited ZnO nanorods (ZnO(NRV)/Ag/POF) is clearly depicted in Fig. 11. This superior performance originates from several features: first, the larger surface area and higher average dispersion relation which is illustrated in the FESEM images together with the schematic diagram in Fig. 7; second, the better crystallinity as shown by the XRD pattern; third, the larger surface roughness revealed with AFM topographic images; and finally, the better adhesion and interactions with saline molecules as confirmed by the ZP analysis. Once visible light propagates in the probe a weak drop in the spectra at 730 nm appeared in the spectra which is associated with the localized surface plasmon of the Ag nanoparticles. When the Ag NPs are irradiated by evanescent electromagnetic waves in the visible frequency their surface free electrons start oscillating. This phenomenon enhances the light trapping of propagating light and appears as a noise-like shape in the spectra (shown by the arrow in Fig. 11).The trend of intensity and wavelength modulation of transmitted light for all samples follows a similar pattern in which by increasing the saline concentration from 0 to 20% the intensity diminishes and the wavelength becomes blue-shifted. Fig. 12 displays the modulation of light intensity for the three different samples while they are exposed to different saline concentrations as external surrounding media. By increasing the saline concentration from 0 to 20% the intensity for the ZnO(NPs)/Ag/POF, ZnO(NRH)/Ag/POF and ZnO(NRV)/Ag/POF samples dropped to 87%, 90% and 73% of their maximum value, respectively. Two phenomena are responsible for this intensity modulation, first, the interference of the core mode and reflected light from the ZnO layer (cladding mode) with different refractive indices and second, the varying of the evanescent wave transmittance by saline when the sensor is immersed in different saline concentrations. Maximum wavelength shifts of ∼3.6 nm, ∼2.2 nm and ∼5.2 nm are observed at 1072 nm wavelength for the samples ZnO(NPs)/Ag/POF, ZnO(NRH)/Ag/POF and ZnO(NRV)/Ag/POF, respectively.
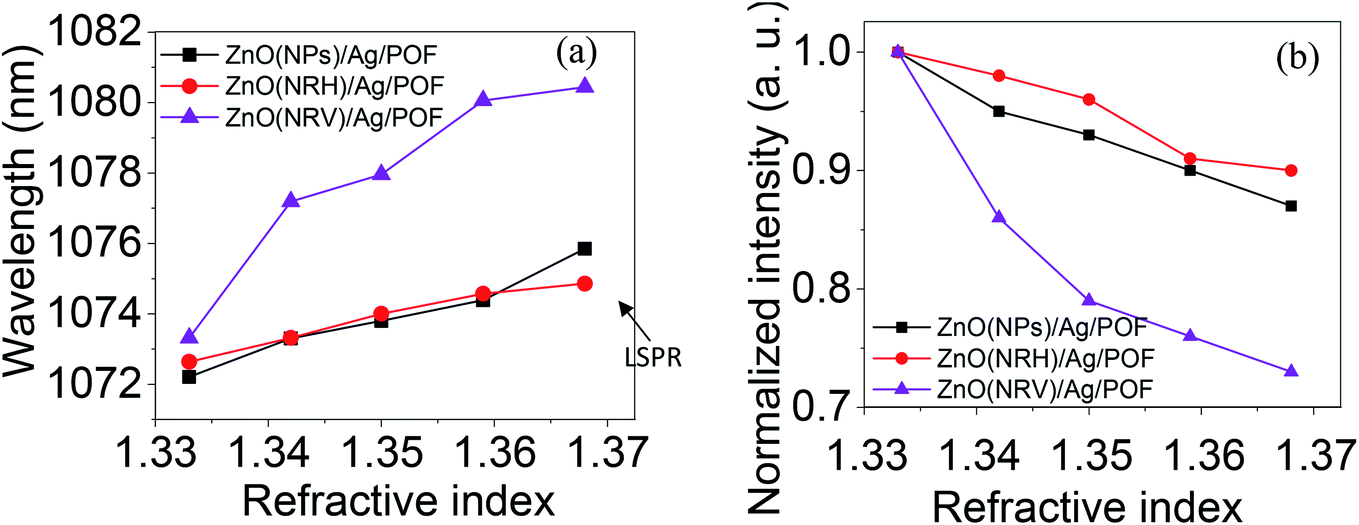 | ||
| Fig. 12 The wavelength and intensity changes as a function of refractive index in the propagating mode centered at a wavelength of 1072 nm for all samples. | ||
According to the two-beam optical interference equation,33 the difference between the effective refractive indices of the core and cladding modes (Δneff) are described as follows:
| Δneff = ncoreeff − ncladeff | (1) |
The max transmission appears when 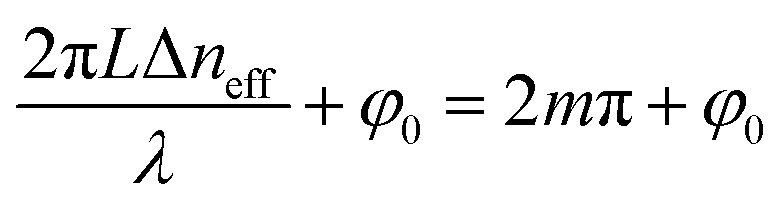 (m is an integer). Consequently, the transmission spectra reveal an intense peak at wavelengths given by:
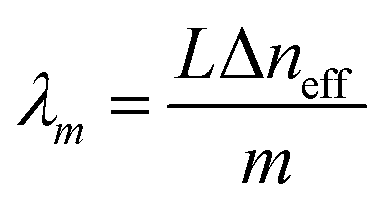 | (2) |
When the refractive index of the ZnO layer changes by exposure to different saline concentrations, the ncladeff and Δλm are both changed. The wavelength m order shift (Δλm) in the interference spectrum can be written as:
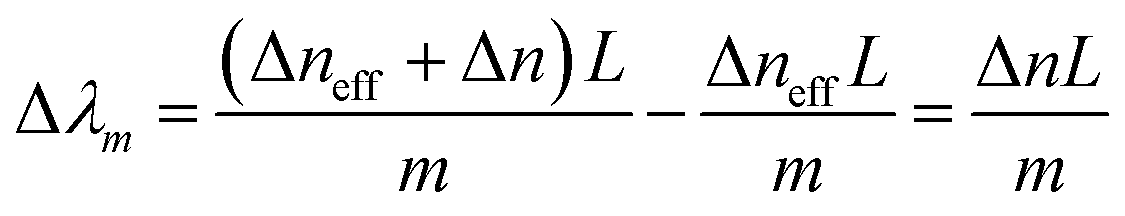 | (3) |
When extreme sensitivity is required, the sensitivity factor becomes an important parameter of sensor performance. Fig. 13 illustrates the wavelength and intensity variation of samples at three propagating main modes as shown in Fig. 11. As can be seen in Fig. 13 altering the intensity and wavelength at higher wavelengths is more distinguishable. This is because light with higher wavelengths can penetrate more deeply from the core to the other top layer material according to the following equation.32
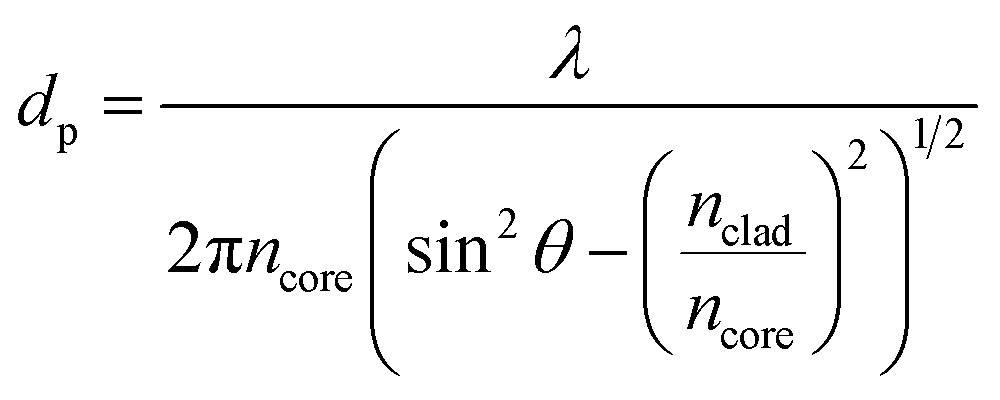 | (4) |
 | ||
| Fig. 13 The (a) wavelength and (b) intensity changes of samples in the three main propagating modes. | ||
4. Conclusions
In order to detect saline concentration changes in water solution, an intrinsic POF probe is fabricated via cladding treatment involving an initial partial uncladding process followed by the deposition of a ZnO/Ag nanolayer with different shapes of ZnO nanostructure on top. The light output of an optical fiber probe is shown to be a sensitive indicator of the refractive index which is linked to the saline concentration when the sensor is immersed in an external liquid. The characteristics of the fiber probe, such as crystallinity, surface morphology, optical band-gap, absorption and zeta potential, as a function of the ZnO nanostructure shape and saline concentration are investigated. We conclude that these sensors are capable of detecting any changes in the refractive index in the range of 1.333 to 1.368, and the maximum intensity and wavelength sensitivity are 22.85 dB RIU−1 and 146.28 nm RIU−1, respectively, for the ZnO vertical nanorod deposited sample in the main propagated mode centered at a 1072 nm wavelength. The highly sensitive, flexible and miniaturized features of our fabricated POF probe suggest that it could be employed for some applications where the accurate detection of saline concentration changes is required and bulk refractometers are inconvenient to use.Conflicts of interest
There is no conflicts to declare.Acknowledgements
The authors gratefully acknowledge Universiti Teknologi Malaysia and Universiti Teknologi Petronas via vote number R.J130000.7609.4C112. The authors would also like to thank Research Management Centre, Universiti Teknologi Malaysia and Frontier Material Research Alliance for the technical support.References
- C. Wu, K. Sun, Y. Xu, S. Zhang, X. Huang and S. Zeng, Safety Science, 2019, 117, 299–304 CrossRef.
- Y. Zhao, H. Zhao, R. Q. Lv and J. Zhao, Optics and Lasers in Engineering, 2019, 117, 7–20 CrossRef.
- R. Wang, X. Zhu, Y. Xing, A. G. Memon, H. Shi and X. Zhou, ACS Appl. Mater. Interfaces, 2019, 11, 36444–36448 CrossRef CAS PubMed.
- L. Liu, X. Zhou, Y. Lu, H. Shi, M. Ma and T. Yu, Environ. Int., 2019, 132, 105091 CrossRef CAS PubMed.
- R. Mohandoss, B. Renganathan, O. Annalakshmi and A. Ganesan, Sens. Actuators, A, 2019, 285, 158–164 CrossRef CAS.
- M. Singh, S. K. Raghuwanshi and O. Prakash, IEEE Photonics Technol. Lett., 2019, 31, 1473–1476 CAS.
- V. Matějec, I. Barton, M. Pospisilova and L. Traplova, Chem. Afr., 2019, 1–7 Search PubMed.
- C. Zhu, J. A. Perman, R. E. Gerald, S. Ma and J. Huang, ACS Appl. Mater. Interfaces, 2019, 11, 4393–4398 CrossRef CAS PubMed.
- O. Arrizabalaga, J. Velasco, J. Zubia, I. S. de Ocáriz and J. Villatoro, Sens. Actuators, B, 2019, 126700 CrossRef CAS.
- Z. Guo, F. Chu, J. Fan, Z. Zhang, Z. Bian, G. Li and X. Song, Sens. Rev., 2019, 39, 352–357 CrossRef.
- D. Pawar and S. N. Kale, Microchim. Acta, 2019, 186, 253 CrossRef PubMed.
- X. Li, S. C. Warren-Smith, H. Ebendorff-Heidepriem, Y.-n. Zhang and L. V. Nguyen, J. Lightwave Technol., 2019, 37, 2954–2962 CAS.
- Z. Yang, L. Xia, S. Li, R. Qi, X. Chen and W. Li, Sens. Actuators, A, 2019, 297, 111558 CrossRef CAS.
- M. Gu, S. Yuan, Q. Yuan and Z. Tong, Optics and Lasers in Engineering, 2019, 115, 86–89 CrossRef.
- X. Zhu, R. Wang, K. Xia, X. Zhou and H. Shi, RSC Adv., 2019, 9, 2316–2324 RSC.
- M. Azkune, T. Frosch, E. Arrospide, G. Aldabaldetreku, I. Bikandi, J. Zubia, J. Popp and T. Frosch, J. Lightwave Technol., 2019, 37, 2981–2988 CAS.
- N. Cennamo, M. Pesavento, S. Marchetti, L. De Maria, P. Zuppella and L. Zeni, Polishing Process Analysis for Surface Plasmon Resonance Sensors in D-Shaped Plastic Optical Fibers, Sensors, CNS 2018. Lecture Notes in Electrical Engineering, Springer, Cham, 2019, vol. 539, DOI:10.1007/978-3-030-04324-7_32.
- R. Oliveira, L. Bilro, T. H. Marques, C. M. Cordeiro and R. Nogueira, Optics and Lasers in Engineering, 2019, 114, 37–43 CrossRef.
- A. G. Leal-Junior, A. Frizera and M. J. Pontes, Opt. Laser Technol., 2018, 100, 272–281 CrossRef CAS.
- Y. Si, J. Lao, X. Zhang, Y. Liu, S. Cai, A. Gonzalez-Vila, K. Li, Y. Huang, Y. Yuan and C. Caucheteur, J. Lightwave Technol., 2019, 37(14), 3495–3502 CAS.
- M. Śmietana, P. Niedziałkowski, W. Białobrzeska, D. Burnat, P. Sezemsky, M. Koba, V. Stranak, K. Siuzdak, T. Ossowski and R. Bogdanowicz, Electroanalysis, 2019, 31, 398–404 CrossRef.
- V. P. Minkovich and A. B. Sotsky, Journal of the European Optical Society-Rapid Publications, 2019, 15, 7 CrossRef.
- X. Guo, N. Wu, J. Zhou, C. Du and X. Wang, Optics and Lasers in Engineering, 2020, 127, 105962 CrossRef.
- H. Fu, M. Zhang, J. Ding, J. Wu, Y. Zhu, H. Li, Q. Wang and C. Yang, Opt. Fiber Technol., 2019, 48, 34–39 CrossRef CAS.
- Y. Ran, P. Strobbia, V. Cupil-Garcia and T. Vo-Dinh, Sens. Actuators, B, 2019, 287, 95–101 CrossRef CAS.
- A. Ozcariz, D. A. Piña-Azamar, C. R. Zamarreño, R. Dominguez and F. J. Arregui, Sens. Actuators, B, 2019, 281, 698–704 CrossRef CAS.
- A. Ozcariz, M. Dominik, M. Smietana, C. Zamarreño, I. Del Villar and F. Arregui, Sens. Actuators, A, 2019, 290, 20–27 CrossRef CAS.
- S. Jagtap, S. Rane, S. Arbuj, S. Rane and S. Gosavi, Microelectron. Eng., 2018, 187, 1–5 CrossRef.
- Z. Samavati, A. Samavati, A. F. Ismail, N. Yahya, M. A. Rahman and M. H. D. Othman, Opt. Laser Technol., 2020, 123, 105896 CrossRef CAS.
- B. Hribar, N. T. Southall, V. Vlachy and K. A. Dill, J. Am. Chem. Soc., 2002, 124, 12302–12311 CrossRef CAS PubMed.
- H. Chen and E. Ruckenstein, J. Phys. Chem. B, 2015, 119, 12671–12676 CrossRef CAS PubMed.
- Z. Samavati, A. Samavati, A. F. Ismail, M. H. D. Othman and M. A. Rahman, Opt. Fiber Technol., 2019, 52, 101976 CrossRef CAS.
- H.-E. Joe, H. Yun, S.-H. Jo, M. B. Jun and B.-K. Min, International Journal of Precision Engineering and Manufacturing-Green Technology, 2018, 5, 173–191 CrossRef.
| This journal is © The Royal Society of Chemistry 2020 |