 Open Access Article
Mixing and jetting analysis using continuous flow microfluidic sample delivery devices
Majid Hejazian ,
Connie Darmanin,
Eugeniu Balaur* and
Brian Abbey*
ARC Centre of Excellence in Advanced Molecular Imaging, Department of Chemistry and Physics, La Trobe Institute for Molecular Sciences, La Trobe University, VIC 3086, Australia. E-mail: e.balaur@latrobe.edu.au; b.abbey@latrobe.edu.au
First published on 21st April 2020
Abstract
Serial femtosecond crystallography (SFX) methods used at X-ray free electron lasers (XFELs) offer a range of new opportunities for structural biology. A crucial component of SFX experiments is sample delivery. Microfluidic devices can be employed in SFX experiments to precisely deliver microcrystals to the X-ray beam and to trigger molecular dynamics via rapid mix-and-inject measurements. Here, for the first time, we have developed a process based on high-resolution photolithography using SU8 on glass to fabricate microfluidic mix-and-inject devices. In order to characterise these devices a broad range of flow rates are used and the mixing and jetting response of the devices monitored. We observe that a stable jet is formed using these devices when injecting DI-water. Three different jetting regimes, liquid column, ribbon, and cylindrical jet, were observed. Furthermore, fluorescence experiments confirm that rapid and uniform mixing of the two injected solutions is possible using these devices indicating that they could be used to probe molecular dynamics on sub-microsecond timescales.
Introduction
The increasing availability of X-ray Free Electron Laser (XFEL) facilities has created new opportunities for structural biology studies. The short pulse duration and extreme intensity of the XFEL enables the capture of the 3D structures of biomolecules at atomic resolution using micro and nanocrystals.1,2 Recently, there has been a growing interest in investigating the dynamics of molecules at the atomic scale using time-resolved serial femtosecond crystallography (TR-SFX).2,3 A crucial element in these studies is the sample injection which needs to be able to achieve high-throughput delivery of crystals in a controlled and continuous manner typically via a liquid jet.4 The most common approach to sample delivery is currently using a capillary-based Gas Dynamic Virtual Nozzle (GDVN). These devices are fabricated using specially designed co-axial capillaries specifically for this purpose.5–7 By creating a free-standing micro-jet, the GDVN is able to deliver a continuous flow of liquid sample to the XFEL beam. Although capillary based GDVNs are well-established in the field of XFEL science they suffer from several limitations. These include the fact that the production is manually intensive leading to variability in the geometry and characteristics of the devices.6 In addition, the range of possible device geometries is limited by the fact that capillary tubes are used as the building blocks. This has consequences, for example, for the devices' mixing efficiency since they rely on molecular diffusion to obtain a homogeneous mixture.6,8–13Compared to capillary-based solutions, microfluidics offers a far wider range of options in terms of possible geometries. It is also possible to achieve extremely large surface area to volume ratios within the microchannels.14 This enables the creation of large and controllable concentration gradients within the microchannels to rapidly mix and then initiate reactions between multiple liquid streams.15 In the context of synchrotrons, the use of enclosed microfluidic devices has been widely explored for performing serial crystallography and small-angle X-ray scattering (SAXS) experiments.16–18 In situ growth of protein crystals within microfluidic channels and time-resolved structure determination has also recently been achieved.19 In order to be compatible with X-rays, low-absorption materials such as PDMS and Kapton are used. However, despite the weak interaction of the X-ray beam with these materials they still produce a significant amount of background scatter resulting in a lower signal-to-noise ratio. In addition, enclosed microfluidic devices are not generally suitable for applications at the XFEL where the beam is intense enough to ablate material from the devices resulting in the rapid degradation of the microchannel walls.
Over the past decade there have been a number of devices fabricated that can achieve integrated mixing and spraying. One of the key applications for these types of devices has been in the deposition of microdroplets onto electron microscopy grids for time resolved studies of sub-second reactions using cryogenic electron microscopy (cryo-EM). Lu et al.20 have previously successfully developed a monolithic device for integrated microfluidic mixing and spraying. The microchannels in these devices were fabricated by etching silicon wafers using DRIE (Deep Reactive-Ion Etching) and then sealing them using a Pyrex glass wafer via anodic bonding. These devices enabled the integrated mixing and reaction of two solutions in a microfluidic channel, prior to being sprayed onto a conventional electron microscope grid. Similar integrated microfluidic mixing–spraying devices were also implemented for capturing multiple states of reactions between macromolecules by Joachim Franks group.21 In another work22 the same group also reported the fabrication of PDMS-based spray devices which can be integrated with a variety of different microfluidic operations including micromixing or microreaction.
Although still in its infancy, the integration of GDVN technology and microfluidic chips for sample delivery is an idea which is rapidly gaining traction. Along these lines, Trebbin et al.23 have reported the realisation of low sample consumption microfluidic devices capable of generating liquid micro-jets. These devices were fabricated using soft-lithographical techniques with PDMS. The group examined the effect of gas and liquid flow rate and gas pressure changes on the thickness, length, and breakup point of the liquid jets. Another PDMS based sample injection device was reported by Zhao et al.24 who fabricated a double nozzle microfluidic platform capable of synthesizing alginate microfibers and jetting them in the atmosphere. An outer sheet flow was used in their experiments to avoid disruption to the continuous flow of microfibres due to the formation of droplets at the device outlet. In addition to producing a stable jet these devices were thus capable of producing a solidified microfiber structure. In spite of the success of these previously reported PDMS-based devices however, there are several significant disadvantages to working in this material. The porous nature of PDMS leads to dehydration of aqueous samples which consequently can lead to blockage of the microchannels.25 In addition, the flexibility of PDMS results in expansion of microchannels, especially the gas channels, during the operation of the devices which can cause variations in flow rate.26,27 Finally, the devices can be prone to failure over extended periods of time, such as during lengthy experiments at the XFEL, which can typically last for up to 10 consecutive hours. This is due to the low pressure resistance of PDMS combined with the comparatively weak oxygen plasma assisted bonding.28,29 Recently, Koralek et al.30 analysed ultrathin (between 20 nm and 1 μm) free standing liquid sheets produced using a glass based microfluidic injector. Characterization of the devices was performed using optical, infrared, and X-ray spectroscopies. The devices fabricated by Koralek et al. were able to achieve stable jetting with a liquid flow rate range of 150–250 μL min−1 and gas flow rates less than 100 SCCM. They showed that the liquid sheets could be stable for days in vacuum demonstrating the potential of these devices for sample delivery at free-electron laser and synchrotron light sources.
Microfluidic platforms using 3D printing technology for serial crystallography experiments have gained notable attention recently. This new approach allows for the fast, affordable, and high-resolution fabrication of microchannels. For example, Monteiro et al.31 succesfully implemented a 3D printed flow focusing microfluidic device for serial synchrotron crystallography data collection. The device allowed for stable data acquisition over long periods of time and was successfully used for a proof of concept study involving rapid-mixing, time-resolved protein diffraction experiments. Knoska et al.32 also recently demonstrated the use of compact 3D printed microfluidic mix and inject devices for time-resolved crystallography at X-ray free-electron lasers (XFELs). Their devices could achieve high speed sub-micron jets which could match the megahertz repetition rates of the XFEL. A comparison of four different 3D printed micromixers is given by. Enders et al.33 which includes a comprehensive numerical and experimental analysis of the mixing performance. This study showed that chaotic mixing, induced by the geometry of the micromixers, significantly increases the mixing performance.
Previously, we reported a proof-of-concept experiment in which a multifunctional microfluidic device consisting of a micro-mixer and an integrated GDVN was fabricated on a single glass chip.34 Fabrication of low cost microfluidic devices using SU8 on glass have previously been reported by Garcia et al.35 Following on from this earlier work we here demonstrate the reliable fabrication of rigid and chemically inert microfluidic devices, capable of creating stable free-standing liquid jets in three different regimes. Further we show that the devices can operate at relatively high gas pressures without any detectable leakage. In this work, in order to characterise the mixing and jetting of the devices a wide range of gas pressures and sample flow rates were trialled. To illustrate the differences between turbulent and diffusive mixing both straight and serpentine-shaped mixing channels were tested. Finally, we identify and report the operating conditions required to simultaneously achieve homogeneous mixing and jetting of liquid samples. This will act as a guide for future TR-SFX experiments performed at XFEL facilities.
Materials and methods
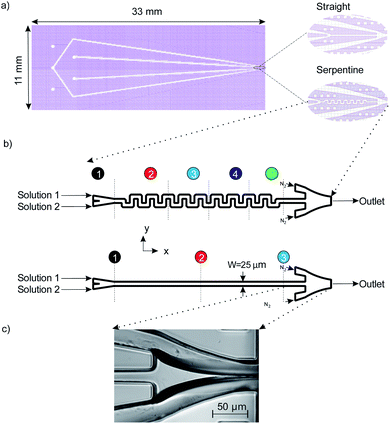
Photolithography is used for patterning the microchannels in SU8: first, we spin coat 45 μm of SU8 3050 (MicroChem Corp.) on a 700 μm thick glass wafer (Borofloat 33, University Wafer, Inc.). After soft baking for 10 minutes at 95 °C, the wafer is exposed using UV light at a dose of 300 mJ cm−2 to imprint the device's microstructure on the photoresist. In order to evaporate the SU8 solvent, post exposure baking is carried out on the substrate by heating on a hot plate for 1 minute at 75 °C, followed up by an additional 5 minute bake at 95 °C. After cooling down, we dissolve the unexposed SU8 by immersing the substrate in an SU8 developer for 6 minutes. To enclose the microstructure, we bond the substrate to a second glass wafer by spin coating a 2 μm layer of SU8 2000 using pressure-assisted thermal bonding. An automated dicing saw (Disco DAD321, Kiru, Kezuru and Migaku technologies) is then used to separate the individual devices. The microfluidic devices had three inlet holes: one inlet is dedicated to gas flow which is used for hydrodynamic focusing of the fluid, and two inlets are used for the liquid samples. We examined two mixer geometries in order to compare the mixing efficiency. The first is a single straight channel and the second is a serpentine channel consisting of 19 turns (see Fig. 1). The liquid channels are combined prior to entering the micro-mixer section of the devices. The mixed stream is then focused by the gas flow from both sides to create a free-standing liquid jet which exits the device.The devices used in our experiments employ the same nozzle taper previously used by Trebbin et al.23 In their work the 2.5D PDMS fluidic droplet nozzles pioneered by Weitz et al.36 were used (Fig. 1c). One of the key differences in the present work is the use of glass and the SU8 fabrication method. Compared to microfluidic devices fabricated in PDMS, glass devices offer advantages in terms of mechanical rigidity and chemical inertness. In addition, the 2D design employed here enables access to a ribbon-shaped jetting regime which has the advantage of lower background signal when the thin edge is oriented perpendicularly with respect to the incident X-ray beam.30
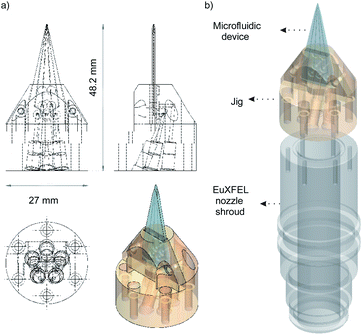
We use polyether ether ketone (PEEK) tubing (PEEK Tubing Green 1/16′′ OD, 0.030′′ ID, IDEX Health & Science LLC) to deliver the aqueous samples into the devices. A custom designed jig, also made of PEEK, is used to connect the microfluidic devices to the tubing (see Fig. 2). The jig is designed to fit the standard nozzle shroud used at the European X-ray Free-Electron Laser (EuXFEL) and can support up to 5 inlet ports. The inlets on the microfluidic devices are overlapped on the jig and sealed using O-rings (Applied Industrial Technologies Pty Ltd, 0.8 mm ID), they are held in place with a cap made from PEEK using two screws. The tubing is connected to the jig, which has 5 ports at the bottom, using SealTight™ Stainless Steel FlushNut™ (IDEX Health & Science LLC).
To pump the liquids through the devices and create sufficient control and pressure for jetting, two syringe pumps (Model: NE-1000, New Era Pump Systems, Inc.) are used. An electronic pressure regulator (Proportion-Air, Inc.) is used to precisely control the gas pressure going into the devices. A solution of 0.05 g of fluorescein sodium salt (acid yellow, Sigma-Aldrich Co.) in 20 mL of DI-water (6.64 mM) is used to investigate the performance of the mixing throughout the micro-mixer. The whole setup is located on an inverted microscope (Nikon eclipse Ti) equipped with a light source suitable for fluorescence imaging. The fluorescent light intensity distribution of the images is then processed using ImageJ37 and the results analysed and plotted in MATLAB (MathWorks, Inc.).
Results and discussion
The experiments were performed using both straight and serpentine shaped mixing channels whilst varying both the liquid flow rate and gas pressure. As shown in Fig. 1, the solutions used for all the experiments are fluorescein sodium salt dissolved in DI-water (solution 1) and DI-water (solution 2). Flow rates for both solutions were kept equal throughout the experiments, and the two solutions were combined prior to entering the micro-mixer component. After exiting the mixer component, the now-mixed solution, was hydrodynamically sandwiched by the gas sheath flows to form a free-standing liquid jet. The experiments were conducted at gas flow rates ranging between 0 to 240 mg min−1. The flow rates for solution 1 were varied between 0 and 200 μL min−1. Our goal is: first, to study the jetting behaviour of the devices by changing the gas pressure whilst holding the solution flow rate constant. Second, to evaluate the mixing performance of the devices whilst varying the flow rate by analysing the fluorescent signal.Jetting
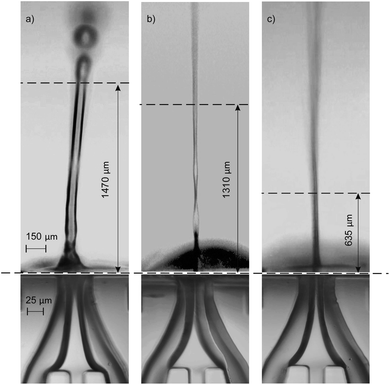
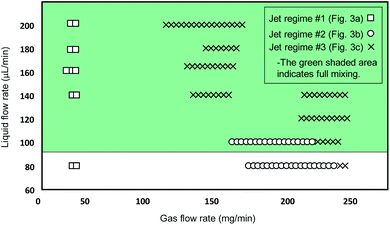
The jetting performance of our microfluidic devices was examined using DI-water as both solution 1 and 2. Here, we identify and discuss different regimes of stable jetting under a wide range of operating conditions varying both flow rates and gas pressures (as previously specified). Images from the inverted microscope were used in order to understand how the operating variables influenced the stability and shape of the liquid jets. From the optical data three distinct jetting regimes could be clearly distinguished, each with their own shape, diameter, and length. As depicted in Fig. 3, three jetting regimes are achieved, each having different break-up points indicated by the topmost horizontal dashed lines. Stable jetting was observed between the horizontal dashed lines once the initial gas pressure and liquid flow rates were set. The gaps between the horizontal dashed lines define the working distance for positioning the incident X-ray beam. The breakup of the jet occurs either via the formation of large (approximately 75 μm diameter) droplets (regime #1, Fig. 3a) or a spray of fine (diameter around 1 μm) droplets (regime #2 and 3, Fig. 3b and c).The first jetting regime, as shown in Fig. 3a, has a jet diameter of around 75 μm, and breaks up into droplets at an approximate distance of 0.5 mm. The operating condition map for our mix-and-inject devices is depicted in Fig. 4. Regime #1 occurs at very low gas flow rate between 0 to 54 mg min−1, and flow rates between 80 and 200 μL min−1, although it is absent in the range of 100 to 140 μL min−1. The mixed solution after exiting the micromixer component tends to expand into the nozzle area, which has a significantly larger diameter. The expanded solution is then focused from either side to from a free-standing liquid jet that exits the device.23
From observation, hydrodynamic focusing resulting in stable jetting only occurs under certain gas-dynamic force balance conditions. These conditions are met when the expansion pressure of the liquid solution is balanced with the flow-focusing gas pressure exerted from the sides. At relatively low gas flow rate of less than 54 mg min−1 the pressure exerted by the gas is insufficient to counteract the liquid expansion and so a secondary expansion of the solution is observed at the outlet of the device. The secondary expansion results in a jet diameter which is approximately twice the width of micromixer channel (25 μm). Eventually, the atmospheric air resistance breaks the jet apart into discrete droplets.
The second regime is shown in Fig. 3b and is characterised by a ‘ribbon’ like liquid sheet. The length of the jet is on the order of centimetres, and the width of the ribbon is around 15 μm. This regime occurs at flow rates between 80 and 100 μL min−1, and in the flow rate range of 162 to 234 mg min−1. Due to the two-dimensional device design, a radial momentum is exerted on the liquid jet which leads to the phenomenon of alternating orthogonal sheets.30 The gas-dynamic force balance is very subtle as demonstrated by the length of the stable and free-standing liquid sheet.
The third regime is a short and cylindrical shaped jet which rapidly breaks up into a fine liquid spray at approximately 0.5 mm. The diameter of the cylindrical jet is around 10 μm at its most focused point. As shown in Fig. 4, this regime is the dominant regime at flow rates higher than 100 μL min−1, and gas flow rates between 90 and 234 mg min−1. In addition, in the present work we were able to achieve stable jetting with flow rates down to 100 μL min−1, this could be further reduced by using smaller micromixer channels which using the current fabrication techniques could be as small as 15 μm. The advantage of using lower flow rates is that sample consumption can be minimized. However, decreasing the dimensions of the micromixer channel will also result in smaller jet diameters and higher jetting speeds. The devices reported in this work, have a mixer microchannel size of 25 × 45 μm (W × H) which for a jet diameter of 15 μm results in a jetting velocity of 4.7 m s−1. Conventional capillary GDVNs38 typically have sample line inner diameter of 50 μm which produce a jet diameter of around 4 μm with a velocity of 10 m s−1. In the present case the jet velocity can be increased by decreasing the SU8 layer thickness, based on simulations with the current design it is possible to achieve jet velocities of 10 m s−1 using an SU8 thickness of 30 μm. The final choice of micromixer channel size should be determined by considering the size of any particles/crystals which may be present in the solution, the sample consumption versus the hit rate, as well as the velocity required to ensure jet recovery between hits. For example, megahertz serial crystallography typically achieves jet diameters of around 2 μm with jet velocities routinely >50 m s−1 created by a co-propagating He gas flow.39
As depicted in Fig. 3, three jetting regimes are achieved, each having different break-up points shown by the dashed lines. Between the dashed lines, jetting is stable and will remain stable once the system reaches steady state conditions, i.e. after passing the initial variation of gas pressure and liquid flow rates at the start of the process. This is the working distance and is suitable positioning for the X-ray beam. Above the dashed lines the jets start to break up into large droplets (regime #1, Fig. 3a) or a spray of fine droplets (regime #2 and 3, Fig. 3b and c). In order to test the mixing and jetting for high viscosity solutions common to SFX we used a 10–50 mg mL−1 lysozyme solution (as solution #1), with a crystal size on the order of 2 μm and a standard crystallization buffer (as solution #2) containing both PEG and a high concentration of salt. The corresponding flow rate was 120 μL min−1. Using this solution stable jetting was observed over several hours and no issues were observed with the flow of crystals through the micromixer.
Mixing
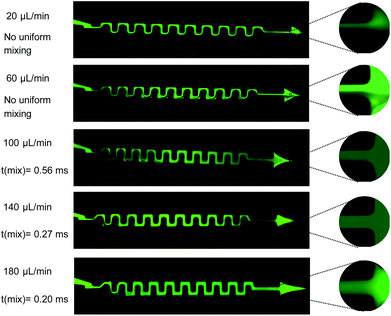
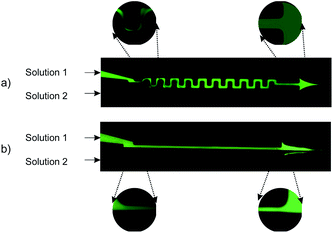
Mixing of 6.64 mM fluorescein sodium salt solution in DI-water (solution 1) and DI-water (solution 2) was evaluated for both the straight and serpentine mixing channels. Fig. 5. Presents two optical fluorescence images comparing the mixing characteristics of the two geometries. There is a stark contrast in the mixing performance of the two channel shapes. We observe that the serpentine rapidly achieves homogeneous mixing of the fluorescent dye (solution 1) and DI-water (solution 2) whilst in the straight channel the dye remains in the top section of the mixing channel until it reaches the outlet. It is clear that the repeated C-shaped geometry of the serpentine results in a chaotic mixing effect by distorting the interface between the two solutions.40 On the other hand, mixing in the straight channel is entirely dependent on molecular diffusion which acts very slowly throughout the length of the micromixer. Consequently, as shown in Fig. 4b, the interface between the two solutions is preserved throughout the straight channel.As shown in Fig. 1b three distinct measurement points were chosen along the straight channel mixer in order to perform a fluorescent signal analysis. For the analysis, the characteristic length scale (y*) obtained through normalisation by the channel width is used:41
| W = ytop − ybottom | (1) |
 | (2) |
We use a dimensionless form of intensity for the analysis:
 | (3) |
The maximum and minimum values of the intensity were measured at the inlet (point number 1 – Fig. 1) prior to mixing of the two streams occurring. The values of the light intensity can be directly related to the concentration of the fluorescein sodium salt in the solution (c* = 1 − I*). The results from the analysis are depicted in Fig. 6 for flow rates of: 20, 100, and 200 μL min−1, and for the three measurement points along the straight channel (see Fig. 1b).
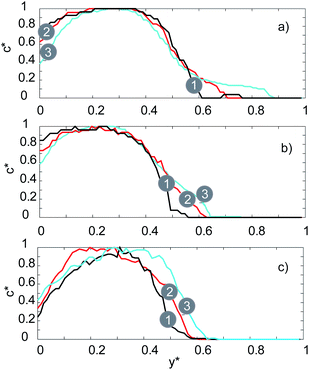 | ||
| Fig. 6 Fluorescence intensity profiles of the straight channel micromixer for: (a) 20 μL min−1, (b) 100 μL min−1, (c) 200 μL min−1. | ||
The two solutions are clearly distinguished according to the c* values in Fig. 6 at the inlet (curve number 1, black). Half of the channel is occupied by the fluorescein sodium salt solution (0 < y* < 0.5) and the other half by DI-water (0.5 < y* <1). The florescent intensity reaches a peak within the upper half of the channel (0.2 < y* < 0.4) where solution 1 is streaming. At the lower flow rate of 20 μL min−1, we observe a small amount of diffusion at the inlet. This is shown by the fact that curve number 1 (Fig. 6a) intercepts the x-axis at y* = 0.6 instead of at the interface which is at y* = 0.5. The negligible deviation from curve 1 as we move towards the outlet of the mixer (curves 2 and 3 – Fig. 6a) indicates only a tiny amount of diffusion of the fluorescein salt into the DI-water stream occurs. As the flow rate is increased to first 100 μL min−1 and then 200 μL min−1 (Fig. 5b and c respectively) the same trend is observed but with even less diffusion occurring at the interface.
The effect of increasing the flow rate on the uniform mixing of the two solutions is depicted in Fig. 7 for the serpentine mixer. Fluorescence images of the mixer are shown for five flow rates (20, 60, 100, 140, 180 μL min−1) with a magnified image of the outlet for each of the images shown inset (Fig. 7). We observe that increasing the flow rate results in a more homogeneous mixture at the outlet. In addition, full mixing is achieved near the inlet at higher flow rates, i.e. for a flow rate of 180 μL min−1 we can achieve homogeneous mixing, t(mix), within 0.2 ms.
It is worth noting that the flow regime throughout the microchannels is laminar (Re < 2300). The corresponding Reynolds number varies between 10 (for a flow rate of 20 μL min−1) and 96.2 (for a flow rate of 200 μL min−1). The chaotic mixing induced by the serpentine shaped micromixer assists in dissolving the interface between the fluorescent salt solution and DI-water, resulting in higher mass transfer rates compared to molecular diffusion alone.
This phenomenon is illustrated in more detail in Fig. 8 where the fluorescent signal is used to quantify the mixing efficiency. For the serpentine channel the fluorescent signal was measured at 5 distinct points (see Fig. 1a) at 3 different flow rates (20, 100, 200 μL min−1). For the lowest flow rate of 20 μL min−1, there is a noticeable and gradual increase in the fluorescence intensity for 0.5 < y* <1 as we move towards the outlet. For this flow rate, mixing is still primarily dominated by molecular diffusion (as is the case with the straight channel), therefore the efficiency of the mixing is very low.
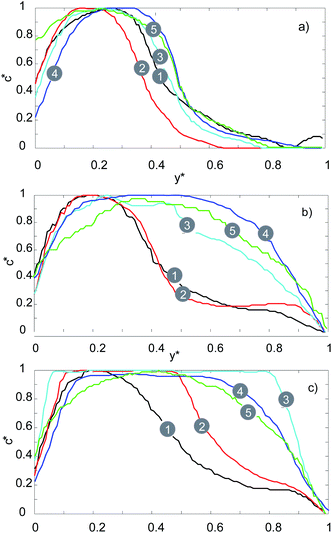 | ||
| Fig. 8 Fluorescence intensity profiles of serpentine micromixer for: (a) 20 μL min−1, (b) 100 μL min−1, (c) 200 μL min−1. | ||
For the medium flow rate of 100 μL min−1, the mixing is significantly enhanced, as can be seen in Fig. 8b. The chaotic mixing, which arises from the serpentine shaped geometry, creates secondary flows which significantly increases the interfacial area between the two solutions. Consequently, the diffusion between the two solutions is significantly accelerated. Uniform mixing is achieved at point number 4 for a flow rate of 100 μL min−1, whilst for 200 μL min−1 it is achieved at point number 2.
Therefore, by increasing the flow rate, uniform mixing can be achieved faster and at a point which is closer to the inlet (lower t(mix)) due to the increase in the amount of chaotic mixing. This agrees with the recent results reported by Maeots et al.42 demonstrating that higher mixing efficiencies can be achieved at higher liquid flow rates as shown by using Fig. 4, and the results of the mixing experiments, we can see that a cylindrical liquid jet with uniform mixing of the two solutions is achieved at flow rates higher than 100 μL min−1 and at medium gas flow rates between 126 and 162 mg min−1.
In the present work, we have demonstrated that homogenous mixing is achievable using a simple serpentine mixing and SU8 nozzle-on-chip microfluidic device. However, we also note that using dye quencher pairs it is possible to more accurately quantify the pre-mixing times of these devices as well as recently demonstrated by Huyke et al.43 Future experiments will investigate the use of dye–quencher pairs for characterising pre-mixing which will allow us to further optimise the design resulting in even faster mixing with lower sample consumption.
Conclusions
Structural biology studies carried out at the XFEL and synchrotron face significant challenges in terms of low sample consumption, as well as precise and reliable sample delivery. The microfluidic devices presented here address this problem by providing a robust yet flexible architecture which is reproducible and can be fabricated to high accuracy. The first implementation of the SU8 on glass novel fabrication technique for integrated mixing and GDVN jetting devices into a single chip has been demonstrated. The devices operated reliably over long time periods making them suitable for experiments at both the synchrotron and XFEL. The jetting characteristics of the devices were explored using DI water and demonstrated the potential for continuous jetting with three distinct regimes observed. Through the characterisation work presented it is now possible for the user to select the desired jet characteristics by modifying the operating conditions for a single device. Further, we demonstrated the superior mixing performance of the serpentine versus straight channel mixer. Based on an analysis of the fluorescence intensity when mixing fluorescein sodium salt and DI water, homogeneous mixing of two solutions was achieved in the serpentine for a wide range of different flow rates. The operation map presented in this work can be used as a guide to select the desired mixing-and-jetting conditions. The fabrication protocol used here has a relatively high yield of 60 devices per fabrication round, which takes up to 5 days to complete. This is achievable by using the high resolution and repeatable photolithography technique which allows fast reproduction of structures on the glass wafers. We note that a critical step in achieving a good yield is our rapid adhesive bonding technique. In summary, due to the stability, rapid mixing afforded by the flexible geometry, as well as the device rigidity, SU8 on glass shows excellent potential as a platform for performing ultra-fast, time-resolved, mixing experiments.Conflicts of interest
There are no conflicts to declare.Acknowledgements
This work was performed in part at the Melbourne Centre for Nanofabrication (MCN) in the Victorian Node of the Australian National Fabrication Facility (ANFF). The authors would like to acknowledge the support of the Australian Research Council (ARC) Centre of Excellence in Advanced Molecular Imaging.References
- M. Schmidt, Int. J. Mol. Sci., 2019, 20, 1401 CrossRef CAS PubMed.
- M. Luise Grunbein and G. Nass Kovacs, Acta Crystallogr., 2019, D75, 178–191 Search PubMed.
- A. M. Orville, BMC Biol., 2018, 16, 55 CrossRef PubMed.
- I. Martiel, H. M. Muller Werkmeister and A. E. Cohen, Acta Crystallogr., 2019, D75, 160–177 Search PubMed.
- D. P. DePonte, U. Weierstall, K. Schmidt, J. Warner, D. Starodub, J. C. H. Spence and R. B. Doak, J. Phys. D Appl. Phys., 2008, 41, 195505 CrossRef.
- G. D. Calvey, A. M. Katz, C. B. Schaffer and L. Pollack, Struct. Dyn., 2016, 3, 054301 CrossRef PubMed.
- C. Kupitz, J. L. Olmos Jr, M. Holl, L. Tremblay, K. Pande, S. Pandey, D. Oberthur, M. Hunter, M. Liang, A. Aquila and J. Tenboer, Struct. Dyn., 2017, 4, 044003 CrossRef PubMed.
- C. Kupitz, J. L. Olmos Jr, M. Holl, L. Tremblay, K. Pande and S. Pandey, Struct. Dyn., 2017, 4, 44003 CrossRef PubMed.
- G. D. Calvey, A. M. Katz and L. Pollack, Anal. Chem., 2019, 91, 7139–7144 CrossRef CAS PubMed.
- D. Wang, U. Weierstall, L. Pollack and J. Spence, J. Synchrotron Radiat., 2014, 21, 1364–1366 CrossRef CAS PubMed.
- I. Steinke, M. Walther, F. Lehmkuhler, P. Wochner, J. Valerio, R. Mager, M. A. Schroer, S. Lee and W. Roseker, Rev. Sci. Instrum., 2016, 87, 063905 CrossRef CAS PubMed.
- A. Echelmeier, M. Sonker and A. Ros, Anal. Bioanal. Chem., 2019, 411, 6535–6547 CrossRef CAS PubMed.
- G. Nelson, R. A. Kirian, U. Weierstall, N. A. Zatsepin, T. Farago, T. Baumbach, F. Wilde and F. B. P. Niesler, Opt. Express, 2016, 24, 11515 CrossRef CAS PubMed.
- D. T. Chiu, A. J. deMello, D. D. Carlo, P. S. Doyle, C. Hansen, R. M. Maceiczyk and R. C. R. Wootton, Chem, 2017, 2, 201–223 CAS.
- A. S. Pawate, V. S. Rajer, J. Schieferstein, S. Guha, R. Henning, I. Kosheleva, M. Schmidt, Z. Ren, P. J. A. Kenisa and S. L. Perry, Acta Crystallogr., 2015, F71, 823–830 Search PubMed.
- C. L. Hansen, E. Skordalakes, J. M. Berger and S. R. Quake, Proc. Natl. Acad. Sci., 2002, 99, 16531–16536 CrossRef CAS PubMed.
- M. Maeki, A. S. Pawate, K. Yamashita, M. Kawamoto, M. Tokeshi, P. J. A. Kenis and M. Miyazaki, Anal. Chem., 2015, 87, 4194–4200 CrossRef CAS.
- M. Maeki, H. Yamaguchi, M. Tokeshi and M. Miyazaki, Anal. Sci., 2016, 32, 3–9 CrossRef CAS PubMed.
- S. Sui and S. L. Perry, Struct. Dyn., 2017, 4, 032202 CrossRef.
- Z. Lu, T. R. Shaikh, D. Barnard, X. Meng, H. Mohamed, A. Yassin, C. A. Mannella, R. K. Agrawal, T.-M. Lu and T. Wagenknecht, J. Struct. Biol., 2009, 168, 388–395 CrossRef PubMed.
- B. Chen, S. Kaledhonkar, M. Sun, B. Shen, Z. Lu, D. Barnard, T.-M. Lu, J. Gonzalez, L. Ruben and J. Frank, Structure, 2015, 23, 1097–1105 CrossRef CAS PubMed.
- X. Feng, Z. Fu, S. Kaledhonkar, Y. Jia, B. Shah, A. Jin, Z. Liu, M. Sun, B. Chen, R. A. Grassucci, Y. Ren, H. Jiang, J. Frank and Q. Lin, Structure, 2017, 25, 663–670 CrossRef CAS PubMed.
- M. Trebbin, K. Kruger, D. DePonte, S. V. Roth, H. N. Chapman and S. Forster, Lab Chip, 2014, 14, 1733–1745 RSC.
- J. Zhao, W. Xiong, N. Yu and X. Yang, Micromachines, 2017, 8, 1–11 Search PubMed.
- R. Schirrer, P. Thepin and G. Torres, J. Mater. Sci., 1992, 27, 3424–3434 CrossRef CAS.
- C. Kang, C. Roh and R. A. Overfelt, RSC Adv., 2014, 4, 3102 RSC.
- C. Roh, J. Lee and C. Kang, Mater. Chem. Phys., 2016, 9, 836 Search PubMed.
- U. Abidin, N. A. S. M. Daud and V. L. Brun, AIP Conf. Proc., 2019, 2062, 020064 CrossRef.
- X. Chen, S. Hou, J. Chu, Y. Xiong, P. Xiong, G. Liu and Y. Tian, Micromachines, 2017, 8, 64 CrossRef.
- J. D. Koralek, J. B. Kim, P. Bruza, C. B. Curry, Z. Chen and H. A. Bechtel, Nat. Commun., 2018, 9, 1353 CrossRef PubMed.
- D. C. F. Monteiro, D. v. Stetten, C. Stohrer, M. Sans, A. R. Pearson, G. Santoni, P. v. d. Lindeng and M. Trebbin, IUCrJ, 2019, 7, 207–219 CrossRef PubMed.
- J. Knoska, L. Adriano, S. Awel, K. R. Beyerlein, O. Yefanov, D. Oberthuer, G. E. P. Murillo, N. Roth, I. Sarrou, P. Villanueva-Perez, M. O. Wiedorn, F. Wilde, S. Bajt, H. N. Chapman and M. R. Heymann, Nat. Commun., 2020, 11, 657 CrossRef CAS PubMed.
- A. Enders, I. G. Siller, K. Urmann, M. R. Hoffmann and J. Bahnemann, Small, 2019, 15, 1804326 Search PubMed.
- M. Hejazian, E. Balaur, L. Flueckiger, L. Hor, C. Darmanin and B. Abbey, presented in part at the SPIE BiOS, San Francisco, California, United States, 2019 Search PubMed.
- C. Garcia, A. Schomacker, I. Klarholz, C. Harms and W. Lang, Sensor 2009 Proceedings I, 2009 Search PubMed.
- M. B. Romanowsky, A. R. Abate, A. Rotem, C. Holtze and D. A. Weitz, Lab Chip, 2012, 12, 802 RSC.
- C. T. Rueden, J. Schindelin and M. C. Hiner, BMC Bioinf., 2017, 18, 529 CrossRef PubMed.
- U. Weierstall, Philos. Trans. R. Soc. Lond. B Biol. Sci., 2014, 369, 20130337 CrossRef PubMed.
- M. O. Wiedorn, D. Oberthur and R. Bean, et al., Nat. Commun., 2018, 9, 4025 CrossRef PubMed.
- R. H. Liu, M. A. Stremler, K. V. Sharp, M. G. Olsen, J. G. Santiago, R. J. Adrian, H. Aref and D. J. Beebe, J. Microelectromech. Syst., 2000, 9, 1057–7157 Search PubMed.
- M. Hejazian and N. T. Nguyen, Micromachines, 2017, 8, 37 CrossRef.
- M. E. Maeots, B. Lee, A. Nans, S. G. Jeong, M. M. N. Esfahani, D. J. Smith, C. S. Lee, S. S. Lee, M. Peter and R. I. Enchev, Visual Biochemistry: modular microfluidics enables kinetic insight from time-resolved cryo-EM, bioRxiv DOI:10.1101/2020.03.04.972604.
- D. A. Huyke, A. Ramachandran, D. I. Oyarzun, T. Kroll, D. P. DePonte and J. G. Santiago, Anal. Chim. Acta, 2020, 1103, 1–10 CrossRef PubMed.
| This journal is © The Royal Society of Chemistry 2020 |

![[thin space (1/6-em)]](https://www.rsc.org/images/entities/char_2009.gif) :
: