
 Open Access Article
 This Open Access Article is licensed under a Creative Commons Attribution-Non Commercial 3.0 Unported Licence
Organic polymorphs based on an AEE-active tetraphenylethene salicylaldehyde Schiff-base derivative: the effect of molecular conformation on luminescence properties†
Chunshuang Liang *
*
Institute of Petrochemical Technology, Jilin Institute of Chemical Technology, Jilin, China. E-mail: csliang0229@163.com
First published on 6th August 2020
Abstract
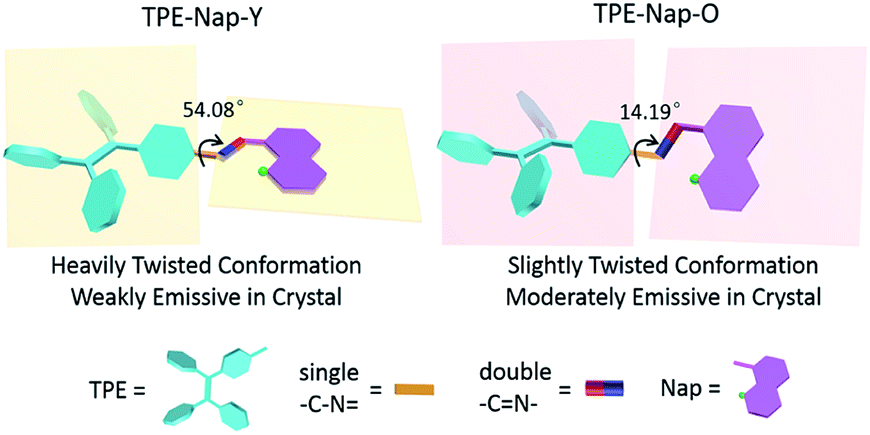
An aggregation-enhanced emission (AEE)-active tetraphenylethene salicylaldehyde Schiff-base derivative, TPE-Nap, was prepared using a facile synthesis. The AEE property of TPE-Nap was studied by luminescence and absorption spectra, and was attributed to the C![[double bond, length as m-dash]](https://www.rsc.org/images/entities/char_e001.gif) N isomerization restriction and the excited-state intramolecular proton transfer (ESIPT) process. Polymorphs TPE-Nap-Y and TPE-Nap-O were prepared from TPE-Nap, and their emission color and intensity were compared. TPE-Nap-Y is a yellow block crystal with a very weak yellow emission, with its main peak at 565 nm, while TPE-Nap-O is an orange plate crystal that gave a stronger orange emission, with its main peak at 583 nm. Single crystal diffraction data were used to demonstrate the structure–property relationship. The most unique feature was that the torsion angle of TPE-Nap-Y between the benzene ring of the TPE unit and the Nap unit was 54.08°, while that of TPE-Nap-O was 14.19°. Interestingly, the TPE unit assumed propeller-like nonplanar conformations that likely led to different intermolecular interactions, such as C–H⋯O interactions (2.529 Å and 2.617 Å) in TPE-Nap-O and C–H⋯π interactions (3.224 Å and 3.791 Å) in TPE-Nap-Y. These were influenced by the torsion angle, although the molecules in both crystals were arranged in a similar end-to-end slip-stacking mode. These results inferred that the molecular conformation was evidently affected by luminescent properties. Crystals possessing a slightly twisted molecular conformation exhibited stronger emission than those possessing a heavily twisted molecular conformation. These investigations will expand the research on the relationship between the molecular conformation and the emission properties of organic solids, and might provide a new development strategy for organic polymorphs.
N isomerization restriction and the excited-state intramolecular proton transfer (ESIPT) process. Polymorphs TPE-Nap-Y and TPE-Nap-O were prepared from TPE-Nap, and their emission color and intensity were compared. TPE-Nap-Y is a yellow block crystal with a very weak yellow emission, with its main peak at 565 nm, while TPE-Nap-O is an orange plate crystal that gave a stronger orange emission, with its main peak at 583 nm. Single crystal diffraction data were used to demonstrate the structure–property relationship. The most unique feature was that the torsion angle of TPE-Nap-Y between the benzene ring of the TPE unit and the Nap unit was 54.08°, while that of TPE-Nap-O was 14.19°. Interestingly, the TPE unit assumed propeller-like nonplanar conformations that likely led to different intermolecular interactions, such as C–H⋯O interactions (2.529 Å and 2.617 Å) in TPE-Nap-O and C–H⋯π interactions (3.224 Å and 3.791 Å) in TPE-Nap-Y. These were influenced by the torsion angle, although the molecules in both crystals were arranged in a similar end-to-end slip-stacking mode. These results inferred that the molecular conformation was evidently affected by luminescent properties. Crystals possessing a slightly twisted molecular conformation exhibited stronger emission than those possessing a heavily twisted molecular conformation. These investigations will expand the research on the relationship between the molecular conformation and the emission properties of organic solids, and might provide a new development strategy for organic polymorphs.
Introduction
Since 2001, when the novel concept of aggregation-induced emission (AIE) was proposed by Tang and coworkers,1 many AIE-active organic materials have been designed and applied in optoelectronics, bio-imaging, and sensors.2 Among them, there has been great interest in luminescent organic crystals over the past few decades due to their wide application in organic light-emitting diodes (OLEDs)3 and organic solid-state lasers (OSSLs).4 The fluorescence properties such as emission color and organic crystal intensity are determined by chemical structures. They are also determined by molecular conformations and packing structures, which indicate that an organic compound may produce solid forms with different fluorescence properties through conformation and/or aggregation structure tuning. Thus, there has been intense research on how molecular conformations affect related properties.Polymorphism is the occurrence of a solid material in more than one crystalline state.5 Polymorphs can exhibit different physical and/or chemical properties. There has been great interest in the polymorphism of organic optoelectronic materials because the different solid-state forms of one molecule can exhibit significantly different optical and electronic properties.6 Studying polymorphism will enable a greater understanding of structure–property relationships and optical property regulation based on the same molecule. Some experimental as well as theoretical studies showing polymorph-dependent luminescence provide insights into the structure–property relationship of organic materials.7 However, organic polymorphs with the same or similar packing style but different molecular conformations have seldom been reported. Therefore, it is urgent to demonstrate the impact of molecular conformations on the emission properties of organic solids, because multicolor optoelectronic devices such as OLEDs and OSSLs might be realized based on one organic compound.8
Among the typical AIE fluorophores, tetraphenylethylene (TPE) is a promising building block with the advantages of facile synthesis and an excellent AIE effect.9 The TPE group exhibits either clockwise or anticlockwise rotational patterns in its propeller-like configurations due to the steric hindrance between the phenyl rings.10 Until now, there have been few investigations on the polymorphism of molecules containing TPE units, and even fewer that focus on the influence of their rotational patterns. Salicylaldehyde Schiff-base derivatives are widely used in the development of sensors, catalysts, and crystals because of their easy synthesis and low cost.11 Considering that the synthesis of optoelectronic materials is difficult and time-consuming, polymorphism based on salicylaldehyde Schiff-base derivatives is quite a convenient approach to tune the emission properties of organic solids. Hence, the development of model systems that disclose the impact of molecular conformations on the luminescent properties of solid emitters is urgently demanded and highly important.
In the course of our study on salicylaldehyde Schiff-bases containing a TPE unit, the compound 1-(((4-(1,2,2-triphenylvinyl)phenyl)imino)methyl)naphthalen-2-ol (TPE-Nap) formed two crystals with different fluorescence emission colors and intensities, and their luminescent properties were compared by fluorescence methods. The X-ray crystallographic and X-ray diffraction (XRD) data were compared to explain that the difference in emission intensity and color of the two polymorphs was mainly attributed to the influence of molecular conformations.
Results and discussion
Synthesis and aggregation-enhanced emission (AEE) property of TPE-Nap
4-(1,2,2-Triphenylvinyl)aniline (TPE-NH2) was synthesized according to the reported literature,12 and TPE-Nap was synthesized via a simple aldehyde–amine condensation reaction between TPE-NH2 and 2-hydroxy-1-naphthaldehyde in a ratio of 1![[thin space (1/6-em)]](https://www.rsc.org/images/entities/char_2009.gif) :1 in ethanol followed by boiling under reflux for three hours (Scheme 1).13 The chemical structure of TPE-NH2 and TPE-Nap was confirmed by standard spectroscopic techniques including 1H NMR, MALDI-ToF-mass spectrometry analysis, FT-IR spectrometry, and fluorescence and UV-Vis spectrometry analysis (Fig. S1–S8, ESI†). The product TPE-Nap was an orange powder that emitted very strong yellow fluorescence as a solid when observed under ultraviolet (UV) light (365 nm). It was speculated that TPE-Nap was an AIE-active molecule.
:1 in ethanol followed by boiling under reflux for three hours (Scheme 1).13 The chemical structure of TPE-NH2 and TPE-Nap was confirmed by standard spectroscopic techniques including 1H NMR, MALDI-ToF-mass spectrometry analysis, FT-IR spectrometry, and fluorescence and UV-Vis spectrometry analysis (Fig. S1–S8, ESI†). The product TPE-Nap was an orange powder that emitted very strong yellow fluorescence as a solid when observed under ultraviolet (UV) light (365 nm). It was speculated that TPE-Nap was an AIE-active molecule.
 | ||
| Scheme 1 Synthetic routes for (a) TPE-NH2 and (b) TPE-Nap. | ||
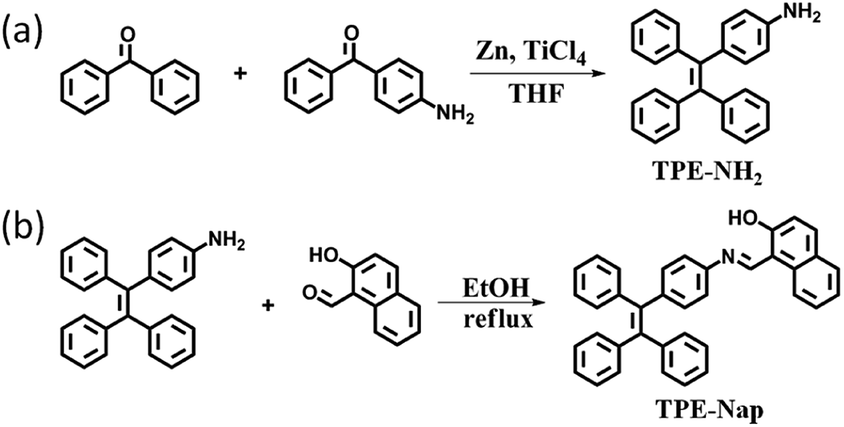
The fluorescence characteristics of TPE-Nap were investigated in tetrahydrofuran (THF)/H2O mixture solutions with a water fraction (fw) from 0% to 95% (v/v). As shown in Fig. 1, the fluorescence emission of TPE-Nap was rather weak in THF, which was ascribed to its conformational relaxation in solution. The fluorescence emission gradually increased as the fw reached 90%, and a gradual redshift in the emission peak occurred from 505 nm to 520 nm. The redshift should be attributed to not only the increasing polarity of the mixtures but also the formation of aggregates with different morphologies.14 When fw reached 90%, the fluorescence emission was almost 5-fold greater than that in THF solution. The fluorescence quantum yield of TPE-Nap in pure THF and fw = 90% mixture solutions was 2.70% and 7.74%, respectively. The corresponding amplification factor αAIE was calculated as 2.87. In addition, the naked eye fluorescence change of TPE-Nap in THF/H2O mixture solution with different fw is given in Fig. 1a. The enhanced fluorescence emission likely occurred because of the poor solubility of TPE-Nap in water than that in THF. This indicated that TPE-Nap exhibited typical aggregation-enhanced emission (AEE) characteristics, namely, these molecules exhibit moderate emissions in solutions, and their emissions could be further enhanced in aggregates due to the restriction of intramolecular motion (RIM) by steric constraint from neighbouring molecules.
 | ||
| Fig. 1 (a) Fluorescence photograph taken under UV light (365 nm); (b) fluorescence emission spectra of TPE-Nap (50 μM) in THF/H2O mixtures with different water fraction (0–95%), λex = 485 nm; (c) fluorescence emission intensity at 520 nm of TPE-Nap as a function of water fraction. | ||
To further verify that the emission enhancement was induced by aggregation, the absorption spectra of TPE-Nap in solutions with different fw were measured (Fig. S9, ESI†). A yellow solution was obtained when TPE-Nap was dissolved in pure THF, while the color change of TPE-Nap in the THF/H2O mixture solution with different fw was not obvious enough to distinguish with the naked eye (Fig. S9a, ESI†). In pure THF, the absorption band of TPE-Nap at 322 nm and 396 nm was observed; the former was attributed to the π–π* transitions of the anthracene group and the latter corresponded to the intramolecular charge transfer (ICT) transition.15 Along with the increase in fw from 0% to 60%, the absorption band at 396 nm decreased and a new band at 454 nm emerged and gradually increased. Additionally, an isosbestic point was observed at 421 nm (Fig. S9b, ESI†). Along with a further increase in the water content (higher than 60%), the intensity of the absorption band at 454 nm was decreased, and a shoulder peak at 487 nm (redshift of 33 nm) was observed. At the same time, level-off tails began to appear on the red side of the absorption spectra (Fig. S9c, ESI†), which was attributed to the light scattering of aggregate suspensions.14b,16 The aggregation of TPE-Nap in aqueous solution of 90% H2O/THF (v/v) was further proved by the dynamic light scattering (DLS) measurement (Fig. S10, ESI†). As shown, particles approximately 1000 nanometers in size were detected. On the contrary, no particles were observed for TPE-Nap in THF.
These luminescence and absorption spectra indicated that TPE-Nap exhibited a typical AEE characteristic that probably occurred because of the cooperative effects of J-aggregation17 and the restriction of the cis–trans tautomerization. CN isomerization is the predominant decay process of the excited states in compounds with an unbridged CN structure.18 In low water volume fractions, the fluorescence derived from ICT was weak because the excited-state intramolecular proton transfer (ESIPT) process was suppressed, which might be ascribed to free rotation around CN. However, with the high water volume fraction, rotation was restricted due to closely packed molecules in an aggregated state, and with the occurrence of the ESIPT process, strong emission resulted.19
Luminescence properties and X-ray crystal structure
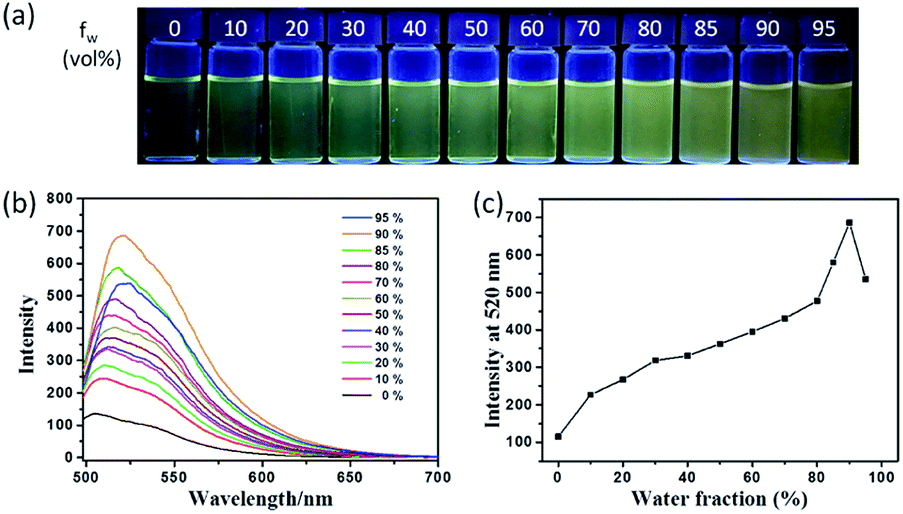
Crystal TPE-Nap-Y and TPE-Nap-O are organic polymorphs, and they were prepared in dichloromethane/methanol mixture solution with different volume ratios (details are in the ESI).† TPE-Nap-Y is a yellow block crystal with very weak dark yellow emission, while TPE-Nap-O is an orange plate crystal with stronger orange emission. Compared with TPE-Nap, the orange powder emitted a very strong yellow fluorescence, but with a very different emission color and intensity. Photographic images were obtained under room light and UV light (365 nm) and are shown in (Fig. 2).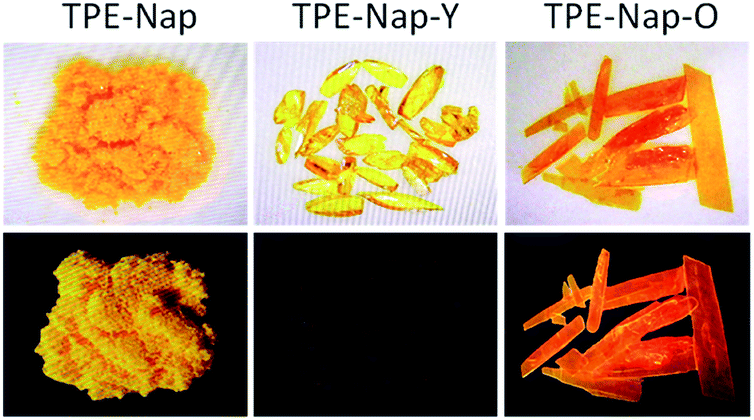 | ||
| Fig. 2 Photos of TPE-Nap (powder), TPE-Nap-Y (crystal), and TPE-Nap-O (crystal) under daylight (top line) and UV light (365 nm, bottom line) at room temperature. | ||
The single-crystal structures of TPE-Nap-Y and TPE-Nap-O were obtained by X-ray diffraction. The crystal structures of TPE-Nap-Y and TPE-Nap-O are shown in Fig. 3. The bond lengths (Å), angles (°), crystal cell structures, and packing structures for TPE-Nap-Y and TPE-Nap-O are shown in Tables S1–S3 and Fig. S11–S13 (ESI†). Crystal TPE-Nap-Y and TPE-Nap-O were all triclinic with a space group of P![[1 with combining macron]](https://www.rsc.org/images/entities/char_0031_0304.gif) . The crystal structure of TPE-Nap-Y revealed the presence of an intramolecular hydrogen bond (H-bond) between the hydroxyl group and the nitrogen atom of the CN group with OH⋯N distance of 1.834 Å (Fig. 3a). This intramolecular H-bond endowed the 2-hydroxyl-phenylmethanimine (Nap) unit with a planar structure. A similar intramolecular H-bond (OH⋯N distance of 1.790 Å, Fig. 3b) was also observed in crystal TPE-Nap-O.
. The crystal structure of TPE-Nap-Y revealed the presence of an intramolecular hydrogen bond (H-bond) between the hydroxyl group and the nitrogen atom of the CN group with OH⋯N distance of 1.834 Å (Fig. 3a). This intramolecular H-bond endowed the 2-hydroxyl-phenylmethanimine (Nap) unit with a planar structure. A similar intramolecular H-bond (OH⋯N distance of 1.790 Å, Fig. 3b) was also observed in crystal TPE-Nap-O.
 | ||
| Fig. 3 The crystal structure of (a) TPE-Nap-Y and (b) TPE-Nap-O with 50% probability ellipsoids and hydrogen bond geometry. | ||
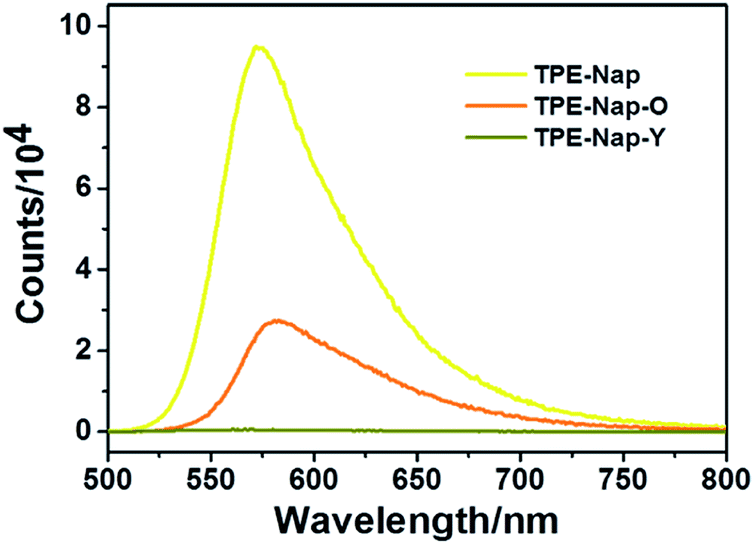
Next, the luminescence properties as well as fluorescence quantum yield of crystal TPE-Nap-Y, TPE-Nap-O, and TPE-Nap powder were compared. The emission spectra of TPE-Nap, TPE-Nap-Y, and TPE-Nap-O are shown in Fig. 4. When using the same slits, the fluorescence intensity of TPE-Nap was obviously higher than that of TPE-Nap-O, and the fluorescence intensity of TPE-Nap-O was obviously higher than that of TPE-Nap-Y, whose intensity was very weak. The main fluorescence peaks are compared in Fig. S14 (ESI†). TPE-Nap shows an emission band peaking at 572 nm with a fluorescence quantum yield of 9.9%, while the emission peak for TPE-Nap-Y and TPE-Nap-O was 565 nm and 583 nm with a fluorescence quantum yield of 0.8% and 5.1%, respectively.
 | ||
| Fig. 4 Fluorescence emission spectra of TPE-Nap, TPE-Nap-Y and TPE-Nap-O at room temperature (λex = 466 nm). | ||
TPE-Nap powder was directly collected from the synthesis process as a precipitate. Aggregates with different morphologies were probably formed, while crystal TPE-Nap-Y and TPE-Nap-O had the determined crystal structure. The reason why higher fluorescence quantum yield was found for TPE-Nap powder might be that its fluorescence properties were the comprehensive result of different morphologies. The emission of TPE-Nap-O was redshifted by 11 nm, and the emission of TPE-Nap-Y was blueshifted by 7 nm when compared with that of TPE-Nap. These results indicated that the crystal fluorescence properties including intensity and color were polymorph-dependent.
The effect of molecular conformation
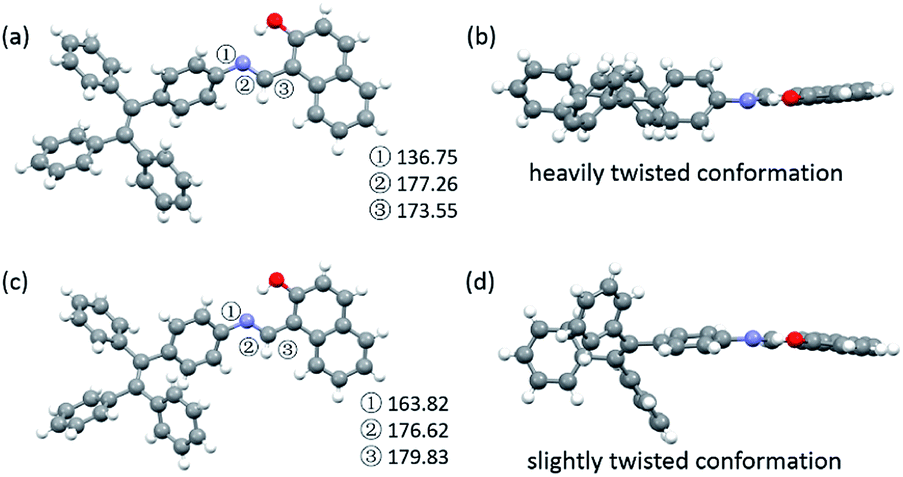
To explore the underlying mechanism of the emissive properties of TPE-Nap-Y and TPE-Nap-O, crystal analyses of these polymorphs were further performed by single crystal diffraction data. The molecular configurations were taken into consideration for their possible influence on their emissive properties. The C–N single bond between the benzene ring of the TPE unit and the Nap unit (including the intramolecular OH⋯N bond) was able to rotate, which resulted in a twisted conformation for the entire molecule.The molecules in crystals TPE-Nap-Y and TPE-Nap-O were arranged in different conformations. The dihedral angle between these two parts of TPE-Nap-Y was 54.08°, while that of TPE-Nap-O was 14.19° (Fig. S15, ESI†). The torsion angles of molecules in these two crystals are also compared in Fig. 5. The three torsion angles (①, ②, and ③) in crystal TPE-Nap-O were 163.82°, 176.62°, and 179.83°, while those in crystal TPE-Nap-Y were 136.75°, 177.26°, and 173.55°. These results indicated that the molecules in TPE-Nap-O adopted a more planar structure. As a result, the molecules in crystal TPE-Nap-Y assumed a heavily twisted conformation, while a slightly twisted conformation was observed for the molecules in crystal TPE-Nap-O. It could be inferred that the difference in fluorescence properties was mainly due to the conformation of the molecules in the crystals, and consequently, the different molecular configurations in crystals resulted in their different emissive properties.
 | ||
| Fig. 5 Molecular conformations of the individual molecules in crystals (a and b) TPE-Nap-Y and (c and d) TPE-Nap-O (①–③: torsion angle/°). | ||
The relationship between molecular conformation and fluorescence properties of organic crystals has been previously discussed in many studies.20 However, organic polymorphs based on TPE derivatives have rarely been studied. A schematic diagram showing the molecular conformation-fluorescence efficiency relationship appears in Fig. 6. Combined with the former results of fluorescence spectra and fluorescence quantum yield, it inferred that a crystal emitted stronger fluorescence when molecules assumed a more planar conformation, resulting in a narrowed band gap and a red-shifted fluorescence. Oppositely, a crystal had a weaker fluorescence when there was a highly twisted molecular conformation, and the wavelength of emission was blueshift.1,7d,21
 | ||
| Fig. 6 Schematic diagram of molecular conformation-fluorescence efficiency relationship. | ||
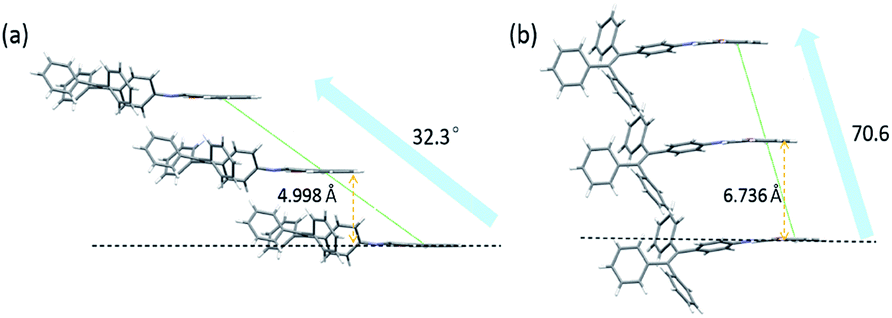
Since the aggregation mode is another important factor influencing the solid-state fluorescence of organic materials, the packing structures of molecules in these two crystals were further investigated. In TPE-Nap-Y and TPE-Nap-O, all molecules are stacked in a typical J-type aggregation mode, as shown in Fig. 7. Molecules in both crystals were arranged in a typical end-to-end slip-stacking mode, and these molecular packing structures effectively avoided π–π interaction.22 The slip-angles for TPE-Nap-Y and TPE-Nap-O were approximately 32.3° and 70.6°, respectively. The interlayer distance between the adjacent molecular sheets for TPE-Nap-Y and TPE-Nap-O was 4.998 Å and 6.736 Å, respectively, and these distances were larger than the typical distance for π–π stacking interaction (3.5 Å).23 The difference in the interlayer distance for TPE-Nap-Y and TPE-Nap-O was presumably caused by the TPE group, which exhibited propeller-like configurations that caused steric hindrance between the phenyl rings. The emission properties of TPE-Nap-Y and TPE-Nap-O were thought to depend on their conformation rather than the packing arrangement because of the absence of π–π stacking interactions in these crystal structures.7n
 | ||
| Fig. 7 Molecular packing structures of (a) TPE-Nap-Y and (b) TPE-Nap-O along crystallography a axis. | ||
Weak intermolecular interactions between neighboring molecules were compared, as different molecular conformations were accompanied by diverse intermolecular interactions (Fig. S16, ESI†). Each molecule in TPE-Nap-Y connected its neighboring molecules by weak C–H⋯π (3.224 Å and 3.791 Å) intermolecular interactions, and each molecule in TPE-Nap-Y connected its neighboring molecules by weak C–H⋯O (2.529 Å and 2.617 Å) intermolecular interactions. The intermolecular interactions in crystal TPE-Nap-Y were much weaker. Thus, the weaker intermolecular interactions in crystal TPE-Nap-Y would result in a relatively lower quantum efficiency in comparison with crystal TPE-Nap-O, in which stronger intermolecular interactions existed.
It is well known that TPE assumes a propeller-like, nonplanar conformation that presents two orientational configurations of the vinyl bond.10 In the two crystals discussed here, both TPE units assumed right-handed helical (P) rotational configurations. This inferred that the difference in the intermolecular interactions relied on the steric effect of the peripheral phenyl rings, because the P orientational configurations of TPE based on different dihedral angles might lead to various types and strengths of intermolecular interactions. These results have expanded the recent research on polymorphs based on TPE derivatives, and further study will be necessary to explore the structure–property relationships of polymorphs based on TPE derivatives.
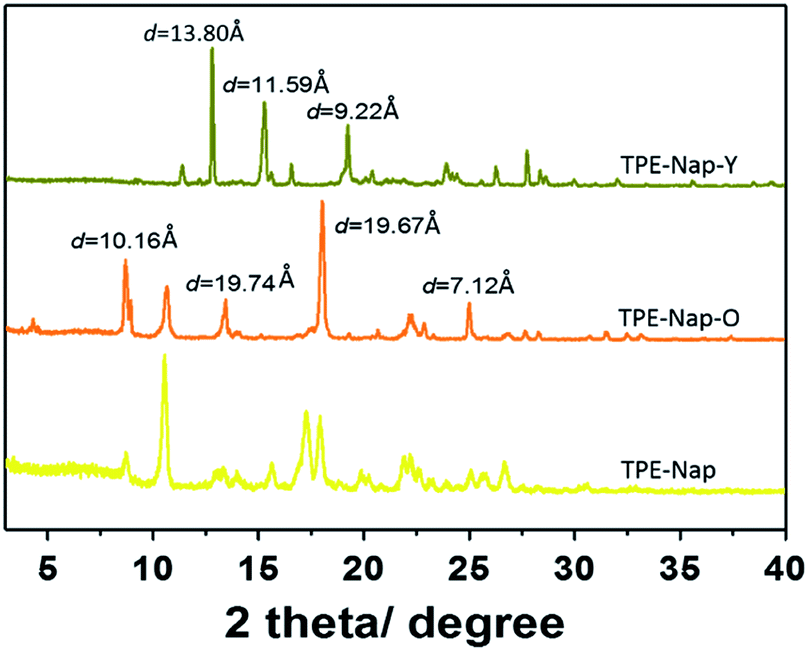
Finally, the structures of TPE-Nap-Y and TPE-Nap-O were examined by powder X-ray diffraction (PXRD). Different PXRD patterns for TPE-Nap, TPE-Nap-Y, and TPE-Nap-O are shown in Fig. 8. Compared with molecular conformation, packing was a secondary factor for the luminescent properties, because it was inferred to be influenced by the variation in molecular conformations in this system. These two crystals presented different PXRD peaks, indicating their different molecular packing distance. The data for crystal TPE-Nap-Y were used to calculate that the d-spacings were 9.22 Å, 11.59 Å, and 13.80 Å, while those of TPE-Nap-O were 7.12 Å, 10.16 Å, and 19.67 Å. These calculated d-spacings were similar to the unit cell dimensions (Table S1, ESI†). Additionally, the observed PXRD pattern closely matched the theoretical PXRD pattern calculated from the corresponding single crystal diffraction data (Fig. S17, ESI†), indicating that these bulk powders had the same overall structure as their crystalline solids. The PXRD pattern for TPE-Nap powder was different from the crystals it formed, because molecules formed aggregates with different morphologies or adopted a random conformation and were accidentally packed into the amorphous solid. Some of the peaks correspond to those of TPE-Nap-O, demonstrating that some molecules might have the same packing models, while others had a different molecular packing distance.
 | ||
| Fig. 8 XRD patterns of TPE-Nap, TPE-Nap-O and TPE-Nap-Y at room temperature. | ||
Conclusions
A facile synthesized tetraphenylethene salicylaldehyde Schiff-base derivative TPE-Nap was prepared, and its AEE property, probably attributed to the CN isomerization restriction and ESIPT process, was studied by luminescence and absorption spectra. Polymorphs TPE-Nap-Y and TPE-Nap-O displaying different emission intensity and color were obtained from TPE-Nap. TPE-Nap-Y and TPE-Nap-O adopted different molecular conformations demonstrated by single crystal diffraction data. The torsion angle between the TPE unit and Nap unit of TPE-Nap-Y was 54.08°, while that of TPE-Nap-O was 14.19°. The molecules in both crystals were arranged in a typical end-to-end slip-stacking mode. Intriguingly, the presence of the TPE unit, which assumed a propeller-like nonplanar conformation, probably led to different intermolecular interactions influenced by different torsion angles. The C–H⋯O distance (2.529 Å and 2.617 Å) in TPE-Nap-O was shorter than the C–H⋯π distance (3.224 Å and 3.791 Å) in TPE-Nap-Y. These results indicated that stronger emission was measured from crystals possessing a slightly twisted conformation as compared to those crystals possessing a heavily twisted conformation. This work not only reveals the effect of the molecular conformation on the luminescence properties for the two polymorphs, but also provides guidance for the design of other AIE or AEE polymorphs, especially those based on TPE derivatives.
Experimental
Chemicals and instruments
All the materials for synthesis and spectra were purchased from commercial chemical suppliers and used as received without further purification. Reagents: benzophenone (99%), 4-aminobenzophenone (98%), TiCl4 (≥98%), zinc powder (≥98%), and 2-hydroxy-1-naphthaldehyde (98%). Solvents: tetrahydrofuran (THF, AR), ethyl acetate (EtOAc, AR), ethanol (EtOH, AR), dichloromethane (DCM, AR), and methanol (AR).Nuclear magnetic resonance spectra were recorded on a Bruker Ultra Shield spectrometer, and chemical shifts are expressed in ppm using tetramethylsilane (TMS) as an internal standard. FT-IR spectra were recorded on a Nicolet 6700 spectrometer, using KBr discs. The fluorescence spectra of solutions were obtained with a Shimadzu RF-5301 PC spectrophotometer with a quartz cuvette (path length = 1 cm). UV-Vis absorption spectra of solutions were recorded using a Specord 210 PLUS UV-Vis spectrophotometer (Analytik Jena). Mass spectra were measured using a Bruker Autoflex speed TOF/TOF. Dynamic light scattering (DLS) experiments were performed using a Malvern dynamic light scattering particle size/zeta potential analyzer at room temperature. X-ray powder diffraction (XRD) patterns were obtained using a Rigaku SmartLab X-ray diffractometer with Cu Kα (k = 1.5406 Å) incident beam. The fluorescence spectra of solids were obtained with an Edinburgh Instruments (EI) FLS920 steady state and transient state fluorescence spectrometer.
The synthesis of TPE-NH2
TPE-NH2 [4-(1,2,2-triphenylvinyl)aniline] was readily prepared by simple McMurry reactions as reported.12 A three-necked flask was charged with 1.97 g (30 mmol) zinc powder and 40 mL dry THF under N2 atmosphere. The suspension was cooled from −5 to 0 °C, and 1.66 mL TiCl4 (15 mmol) was slowly added. The suspension was warmed to room temperature and stirred for 0.5 h, and then heated to reflux for 2.5 h. The mixture was again cooled from −5 to 0 °C, and a solution of 4-aminobenzophenone (0.99 g, 5 mmol) and benzophenone (0.91 g, 5 mmol) in 15 mL THF was added dropwise. After addition, the reaction mixture was heated to reflux until the carbonyl compound was completely consumed (monitored by thin-layer chromatography (TLC)). The reaction was quenched with 10% K2CO3 aqueous solution and extracted with EtOAc. The organic layer was collected and concentrated. After the crude material was purified by column chromatography, a white product, TPE-NH2, was obtained (Scheme 1a). Yield: 38.0% (0.66 g).The structure of TPE-NH2 was confirmed by 1H NMR, 13C NMR, HRMS (MALDI-ToF), and FT-IR spectroscopy (Fig. S1–S4, ESI†).
1H NMR (500 MHz, CDCl3) δ (ppm) = 7.16–6.97 (m, 15H), 6.81 (d, J = 8.5 Hz, 2H), 6.44 (d, J = 8.4 Hz, 2H), 3.75 (s, 2H, –NH2);
13C NMR (101 MHz, CDCl3) δ (ppm) = 144.77, 144.34, 144.21, 144.17, 140.94, 139.30, 134.02, 132.48, 131.46, 131.40, 131.35, 127.65, 127.53, 127.50, 126.23, 126.05, 114.31; HRMS m/z: [M]+ calc. for C26H21N 347.1674; found 347.0040; FT-IR (cm−1, KBr): 3469, 3379, 3021, 1618, 1512, 1442, 1282, 1178, 1074, 1028, 823, 750, 700, 607, 546.
The synthesis of TPE-Nap
TPE-Nap [1-(((4-(1,2,2-triphenylvinyl)phenyl)imino)methyl)naphthalen-2-ol] was synthesized by mixing TPE-NH2 (0.35 g, 1 mmol) and 2-hydroxy-1-naphthaldehyde (0.17 g, 1 mmol) in a ratio of 1:1 in ethanol followed by boiling under reflux for three hours (Scheme 1b).13 An orange solid powder was precipitated, and was subsequently filtered and washed with cold ethanol and finally dried under vacuum. Yield: 87.8% (0.44 g).
The structure of TPE-Nap was confirmed by 1H NMR, 13C NMR, HRMS (MALDI-ToF) and FT-IR spectroscopy (Fig. S5–S8, ESI†).
1H NMR (400 MHz, CDCl3) δ (ppm) = 9.24 (s, 1H), 8.03 (d, J = 8.4 Hz, 1H), 7.80 (d, J = 8.4 Hz, 1H), 7.77–7.66 (m, 1H), 7.51 (t, J = 7.5 Hz, 1H), 7.33 (t, J = 7.3 Hz, 1H), 7.20–6.95 (m, 20H);
13C NMR (101 MHz, CDCl3) δ (ppm) = 171.55, 153.27, 143.60, 143.54, 143.46, 142.57, 142.29, 141.52, 139.99, 136.90, 133.28, 132.72, 131.38, 131.35, 131.31, 129.39, 128.08, 127.90, 127.80, 127.68, 127.18, 126.69, 126.65, 126.56, 123.49, 122.72, 119.37, 118.77, 108.71; HRMS m/z: [M + H]+ calc. for C37H27NO 502.2171; found 502.2772; FT-IR (cm−1, KBr): 3442, 3020, 1624, 1491, 1442, 1327, 1157, 1076, 1030, 970, 827, 744, 698, 607.
AIE properties measurements
A stock solution of TPE-Nap was prepared (c = 1 × 10⁻³ M) in THF. Aliquots (150 μL) of the stock solution were added to a centrifuge tube and diluted to 3 mL with water and THF in the proper ratios at room temperature, with the concentration being maintained at 50 μM. Fluorescence and UV-Vis methods were used to record the spectra of these solutions.Crystal growth, X-ray data collection, and structural determination
Organic polymorphs of TPE-Nap were prepared as follows: in one test tube, 1 mmol of TPE-Nap was dissolved in DCM (2 mL), and then methanol (4 mL) was added along the tube wall without destroying the previous solution surface. In a second test tube, 1 mmol of TPE-Nap was dissolved in DCM (4 mL) and then methanol (2 mL) was added along the tube wall without destroying the previous solution surface. After standing at room temperature for 3–7 days, two types of crystals, TPE-Nap-Y (block) and TPE-Nap-O (plate), were generated respectively. Crystals TPE-Nap-Y and TPE-Nap-O were polymorphs, with obviously different color and shape (Fig. 2).The crystals were used for X-ray crystallographic analysis. The diffraction data for crystals TPE-Nap-Y and TPE-Nap-O were collected on a Bruker Smart CCD 1 K diffractometer equipped with a monochromator using a Mo Kα (k = 0.71073 Å) incident beam. The crystals were mounted on a glass fiber. The CCD data were integrated and scaled using the Bruker-Saint software package, and the structures were solved and refined using the SHEXTL program. Structural information was deposited at the Cambridge Crystallographic Data Centre (CCDC 1954666 and 1954667).
Conflicts of interest
There are no conflicts to declare.Acknowledgements
This work was supported by the foundation of Jilin Institute of Chemical Technology (No. 2018006). The author thanks Prof. Bao Li (Jilin University) for the crystal structural determination.Notes and references
- J. D. Luo, Z. L. Xie, J. W. Y. Lam, L. Cheng, H. Y. Chen, C. F. Qiu, H. S. Kwok, X. W. Zhan, Y. Q. Liu, D. B. Zhu and B. Z. Tang, Chem. Commun., 2001, 1740–1741 RSC.
- (a) J. Mei, N. L. Leung, R. T. Kwok, J. W. Lam and B. Z. Tang, Chem. Rev., 2015, 115, 11718–11940 CrossRef CAS; (b) L. Yao, S. T. Zhang, R. Wang, W. J. Li, F. Z. Shen, B. Yang and Y. G. Ma, Angew. Chem., Int. Ed., 2014, 53, 2119–2123 CrossRef CAS; (c) H. Y. Li, Z. G. Chi, X. Q. Zhang, B. J. Xu, S. W. Liu, Y. Zhang and J. R. Xu, Chem. Commun., 2011, 47, 11273–11275 RSC; (d) S. J. Chen, H. Wang, Y. N. Hong and B. Z. Tang, Mater. Horiz., 2016, 3, 283–293 RSC; (e) L. L. Yan, Y. Zhang, B. Xu and W. J. Tian, Nanoscale, 2016, 8, 2471–2487 RSC; (f) R. Y. Zhang, Y. K. Duan and B. Liu, Nanoscale, 2019, 11, 19241–19250 RSC; (g) R. T. Kwok, C. W. Leung, J. W. Lam and B. Z. Tang, Chem. Soc. Rev., 2015, 44, 4228–4238 RSC; (h) S. D. Xu, T. T. Liu, Y. X. Mu, Y.-F. Wang, Z. G. Chi, C.-C. Lo, S. W. Liu, Y. Zhang, A. Lien and J. R. Xu, Angew. Chem., Int. Ed., 2015, 54, 874–878 CrossRef CAS.
- (a) K. W. Yee, M. Y. okoyama and M. H iramoto, Appl. Phys. Lett., 2006, 88, 083511 CrossRef; (b) J. Yang, J. Huang, N. Sun, Q. Peng, Q. Q. Li, D. G. Ma and Z. Li, Chem.–Eur. J., 2015, 21, 6862–6868 CrossRef CAS; (c) W. L. Li, T. Xu, G. Chen, H. Zhang, X. C. Gao, X. H. Zhou, H. F. Huang, H. L. Fan, M. Cai, X. W. Zhang, L. Q. Yang, W. Q. Zhu and B. Wei, Dyes Pigm., 2016, 130, 266–272 CrossRef CAS.
- (a) M. Ichikawa, R. Hibino, M. Inoue, T. Haritani, S. Hotta, T. Koyama and Y. Taniguchi, Adv. Mater., 2003, 15, 213–217 CrossRef CAS; (b) H. Yanagi, T. Ohara and T. Morikawa, Adv. Mater., 2001, 13, 1452 CrossRef CAS.
- J. Bernstein, Polymorphism in Molecular Crystals, Clarendon, Oxford, 2002 Search PubMed.
- (a) J. W. Chung, Y. M. You, H. S. Huh, B.-K. An, S.-J. Yoon, S. H. Kim, S. W. Lee and S. Y. Park, J. Am. Chem. Soc., 2009, 131, 8163–8172 CrossRef CAS; (b) Z. L. Zhang, Y. Zhang, D. D. Yao, H. Bi, I. Javed, Y. Fan, H. Y. Zhang and Y. Wang, Cryst. Growth Des., 2009, 9, 5069–5076 CrossRef CAS.
- (a) P.-Y. Gu, G. F. Liu, J. Zhao, N. Aratani, X. Ye, Y. Liu, H. Yamada, L. N. Nie, H. X. Zhang, J. Zhu, D.-S. Li and Q. C. Zhang, J. Mater. Chem. C, 2017, 5, 8869–8874 RSC; (b) Y. X. Xu, K. Wang, Y. J. Zhang, Z. Q. Xie, B. Zou and Y. G. Ma, J. Mater. Chem. C, 2016, 4, 1257–1262 RSC; (c) C. Wang, B. J. Xu, M. S. Li, Z. G. Chi, Y. J. Xie, Q. Q. Li and Z. Li, Mater. Horiz., 2016, 3, 220–225 RSC; (d) D. Yan and D. Evans, Mater. Horiz., 2014, 1, 46–57 RSC; (e) Y. J. Xie, Y. W. Ge, Q. Peng, C. G. Li, Q. Q. Li and Z. Li, Adv. Mater., 2017, 29, 1606829 CrossRef; (f) K. Wang, H. Y. Zhang, S. Y. Chen, G. C. Yang, J. B. Zhang, W. J. Tian, Z. M. Su and Y. Wang, Adv. Mater., 2014, 26, 6168–6173 CrossRef CAS; (g) H. Y. Zhang, Z. L. Zhang, K. Q. Ye, J. Y. Zhang and Y. Wang, Adv. Mater., 2006, 18, 2369–2372 CrossRef CAS; (h) D. P. Yan, A. Delori, G. O. Lloyd, B. Patel, T. Friščić, G. M. Day, D.-K. Bučar, W. Jones, J. Lu, M. Wei, D. G. Evans and X. Duan, CrystEngComm, 2012, 14, 5121–5123 RSC; (i) S.-J. Yoon, J. W. Chung, J. Gierschner, K. S. Kim, M.-G. Choi, D. Kim and S. Y. Park, J. Am. Chem. Soc., 2010, 132, 13675–13683 CrossRef CAS; (j) X. G. Gu, J. J. Yao, G. X. Zhang, Y. L. Yan, C. Zhang, Q. Peng, Q. Liao, Y. S. Wu, Z. Z. Xu, Y. S. Zhao, H. B. Fu and D. Q. Zhang, Adv. Funct. Mater., 2012, 22, 4862–4872 CrossRef CAS; (k) T. Mutai, H. Tomoda, T. Ohkawa, Y. Yabe and K. Araki, Angew. Chem., Int. Ed., 2008, 47, 9522–9524 CrossRef CAS; (l) J. Wuest, Nat. Chem., 2012, 4, 74–75 CrossRef CAS; (m) C. Wang and Z. Li, Mater. Chem. Front., 2017, 1, 2174–2194 RSC; (n) Z. Q. Wang, M. Z. Wang, J. Q. Peng, Y. F. Xie, M. C. Liu, W. X. Gao, Y. B. Zhou, X. B. Huang and H. Y. Wu, J. Phys. Chem. C, 2019, 123, 27742–27751 CrossRef CAS; (o) Y. T. Chen, X. Y. Zhang, M. Z. Wang, J. Q. Peng, Y. B. Zhou, X. B. Huang, W. X. Gao, M. C. Liu and H. Y. Wu, J. Mater. Chem. C, 2019, 7, 12580–12587 RSC; (p) Y. B. Zhou, L. B. Qian, M. C. Liu, X. B. Huang, Y. X. Wang, Y. X. Cheng, W. X. Gao, G. Wu and H. Y. Wu, J. Mater. Chem. C, 2017, 5, 9264–9272 RSC.
- (a) X. Luo, J. Li, C. Li, L. Heng, Y. Dong, Z. Liu, Z. Bo and B. Z. Tang, Adv. Mater., 2011, 23, 3261 CrossRef CAS; (b) H. Wang, F. Li, B. R. Gao, Z. Q. Xie, S. J. Liu, C. L. Wang, D. H. Hu, F. Z. Shen, Y. X. Xu, H. Shang, Q. D. Chen, Y. G. Ma and H. B. Sun, Cryst. Growth Des., 2009, 9, 4945–4950 CrossRef CAS.
- (a) J. H. Jia and H. X. Zhao, Org. Electron., 2019, 73, 55–61 CrossRef CAS; (b) C. Zhang, Y. Yang and W. l. Li, RSC Adv., 2017, 7, 1348–1356 RSC; (c) Y. H. Wang, D. F. Xu, H. Z. Gao, Y. Wang, X. L. Liu, A. X. Han, C. Zhang and L. Zang, Dyes Pigm., 2018, 156, 291–298 CrossRef CAS; (d) Y. Wang, D. D. Cheng, H. K. Zhou, J. R. Liu, X. L. Liu, J. F. Cao, A. X. Han and C. Zhang, Dyes Pigm., 2019, 171, 107739 CrossRef CAS; (e) H. Z. Gao, D. F. Xu, X. L. Liu, A. X. Han, L. Zhou, C. Zhang, Z. Li and J. Dang, Dyes Pigm., 2017, 139, 157–165 CrossRef CAS; (f) H. Z. Gao, D. F. Xu, Y. H. Wang, Y. Wang, X. L. Liu, A. X. Han and C. Zhang, Dyes Pigm., 2018, 150, 59–66 CrossRef CAS.
- (a) J. B. Xiong, H. T. Feng, J. P. Sun, W. Z. Xie, D. Yang, M. H. Liu and Y. S. Zheng, J. Am. Chem. Soc., 2016, 138(36), 11469–11472 CrossRef CAS; (b) H. Qu, Y. Wang, Z. H. Li, X. C. Wang, H. X. Fang, Z. Q. Tian and X. Y. Cao, J. Am. Chem. Soc., 2017, 139(50), 18142–18145 CrossRef CAS.
- (a) C. S. Liang, W. H. Bu, C. L. Li, G. W. Men, M. Y. Deng, Y. K. Jiangyao, H. C. Sun and S. M. Jiang, Dalton Trans., 2015, 44, 11352–11359 RSC; (b) P. G. Cozzi, Chem. Soc. Rev., 2004, 33, 410–421 RSC; (c) C. J. Whiteoak, G. Salassa and A. W. Kleij, Chem. Soc. Rev., 2012, 41, 622–631 RSC.
- (a) Y. Cai, L. Li, Z. Wang, J. Z. Sun, A. Qin and B. Z. Tang, Chem. Commun., 2014, 50, 8892–8895 RSC; (b) Z. G. Song, D. Mao, S. H. P. Sung, R. T. K. Kwok, J. W. Y. Lam, D. L. Kong, D. Ding and B. Z. Tang, Adv. Mater., 2016, 28, 7249–7256 CrossRef CAS; (c) Y. Q. Jiang, J. Q. Wang, G. X. Huang, Z. Li, B. S. Li and B. Z. Tang, J. Mater. Chem. C, 2019, 7, 11790–11796 RSC.
- T. Sun, D. D. Cheng, Y. S. Chai, J. Gong, M. Y. Sun and F. Zhao, Dyes Pigm., 2019, 170, 107619 CrossRef CAS.
- (a) Y. P. Zhang, D. D. Li, Y. Li and J. H. Yu, Chem. Sci., 2014, 5, 2710–2716 RSC; (b) A. Maity, F. Ali, H. Agarwalla, B. Anothumakkool and A. Das, Chem. Commun., 2015, 51, 2130–2133 RSC.
- (a) I. Berlman, Handbook of Fluorescence Spectra of Aromatic Molecules, Academic Press, New York, 2nd edn, 1971 Search PubMed; (b) Y. Y. Gong, J. Liu, Y. R. Zhang, G. F. He, Y. Lu, W. B. Fan, W. Z. Yuan, J. Z. Sun and Y. M. Zhang, J. Mater. Chem. C, 2014, 2, 7552–7560 RSC; (c) T. Mutai, H. Sawatani, T. Shida, H. Shono and K. Araki, J. Org. Chem., 2013, 78, 2482–2489 CrossRef CAS; (d) J. M. Hancock, A. P. Gifford, Y. Zhu, Y. Lou and S. A. Jenekhe, Chem. Mater., 2006, 18, 4924–4932 CrossRef CAS.
- (a) P. F. Barbara, S. D. Rand and P. M. Rentzepis, J. Am. Chem. Soc., 1981, 103, 2156–2162 CrossRef CAS; (b) C. S. Liang and S. M. Jiang, Analyst, 2017, 142, 4825–4833 RSC.
- (a) F. C. Spano, Acc. Chem. Res., 2010, 43, 429–439 CrossRef CAS; (b) Z. Zhao, S. Chen, J. W. Y. Lam, Z. Wang, P. Lu, F. Mahtab, H. H. Y. Sung, I. D. Williams, Y. Ma, H. S. Kwok and B. Z. Tang, J. Mater. Chem., 2011, 21, 7210–7216 RSC; (c) B.-K. An, S.-K. Kwon, S.-D. Jung and S. Y. Park, J. Am. Chem. Soc., 2002, 124, 14410–14415 CrossRef CAS; (d) Q. Zeng, Z. Li, Y. Q. Dong, C. A. Di, A. J. Qin, Y. N. Hong, L. Ji, Z. C. Zhu, C. K. W. Jim, G. Yu, Q. Q. Li, Z. A. Li, Y. Q. Liu, J. G. Qin and B. Z. Tang, Chem. Commun., 2007, 70–72 RSC; (e) W. X. Tang, Y. Xiang and A. J. Tong, J. Org. Chem., 2009, 74, 2163–2166 CrossRef CAS; (f) S. C. Dong, Z. Li and J. G. Qin, J. Phys. Chem. B, 2009, 113, 434–441 CrossRef CAS.
- (a) J. S. Wu, W. M. Liu, J. C. Ge, H. Y. Zhang and P. F. Wang, Chem. Soc. Rev., 2011, 40, 3483–3495 RSC; (b) G. W. Men, G. R. Zhang, C. S. Liang, H. L. Liu, B. Yang, Y. Y. Pan, Z. Y. Wang and S. M. Jiang, Analyst, 2015, 140, 5454–5458 RSC; (c) C. S. Liang and S. M. Jiang, Spectrochim. Acta, Part A, 2017, 183, 267–274 CrossRef CAS.
- (a) S. K. Behera, A. Murkherjee, G. Sadhuragiri, P. Elumalai, M. Sathiyendiran, M. Kumar, B. B. Mandal and G. Krishnamoorthy, Faraday Discuss., 2017, 196, 71–90 RSC; (b) L. L. Wang, Y. Y. Li, X. J. You, K. Xu, Q. Feng, J. M. Wang, Y. Y. Liu, K. Li and H. W. Hou, J. Mater. Chem. C, 2017, 5, 65–72 RSC.
- (a) X. Cheng, F. Li, S. H. Han, Y. F. Zhang, C. J. Jiao, J. B. Wei, K. Q. Ye, Y. Wang and H. Y. Zhang, Sci. Rep., 2015, 5, 9140 CrossRef CAS; (b) X. Cheng, Y. F. Zhang, S. H. Han, F. Li, H. Y. Zhang and Y. Wang, Chem. - Eur. J., 2016, 22, 4899–4903 CrossRef CAS; (c) H. Liu, X. Cheng, Z. Y. Bian, K. Q. Ye and H. Y. Zhang, Chin. Chem. Lett., 2018, 29, 1537–1540 CrossRef CAS; (d) E. Sakuda, K. Tsuge, Y. Sasaki and N. Kitamura, J. Phys. Chem. B, 2005, 109, 22326–22331 CrossRef CAS; (e) C. Kitamura, T. Ohara, N. Kawatsuki, A. Yoneda, T. Kobayashi, H. Naito, T. Komatsu and T. Kitamura, CrystEngComm, 2007, 9, 644–647 RSC; (f) B. Jena and S. S. Manoharan, Chem. Commun., 2009, 4426–4428 RSC.
- (a) J. Huang, Q. Q. Li and Z. Li, ACS Symp. Ser., 2016, 1226, 127–154 Search PubMed; (b) H. P. Liu, Z. Q. Lu, B. L. Tang, Z. L. Zhang, Y. Wang and H. Y. Zhang, Dyes Pigm., 2018, 149, 284–289 CrossRef CAS.
- (a) S. W. Thomas, G. D. Joly and T. M. Swager, Chem. Rev., 2007, 107, 1339–1386 CrossRef CAS; (b) R. Yang, A. Garcia, D. Korystov, A. Mikhailovsky, G. C. Bazan and T.-Q. Nguyen, J. Am. Chem. Soc., 2006, 128, 16532–16539 CrossRef CAS; (c) M. Levitus, G. Zepeda, H. Dang, C. Godinez, T.-A. V. Khuong, K. Schmieder and M. A. Garcia-Garibay, J. Org. Chem., 2001, 66, 3188–3195 CrossRef CAS.
- (a) R. U. Kadam, D. Garg, J. Schwartz, R. Visini, M. Sattler, A. Stocker, T. Darbre and J. L. Reymond, ACS Chem. Biol., 2013, 8, 1925–1930 CrossRef CAS; (b) C. Janiak, J. Chem. Soc., Dalton Trans., 2000, 3885–3896 RSC; (c) S. Alvarez, Dalton Trans., 2013, 42, 8617–8636 RSC; (d) Y. J. Cai, K. Samedov, B. S. Dolinar, H. Albright, Z. G. Song, C. C. Zhang, B. Z. Tang and R. West, Dalton Trans., 2015, 44, 12970–12975 RSC.
Footnote |
| † Electronic supplementary information (ESI) available: Organic compounds characterisation (1H NMR, MS, FTIR); absorption and fluorescence spectra; crystal data for TPE-Nap-Y and TPE-Nap-O. CCDC 1954666 and 1954667. For ESI and crystallographic data in CIF or other electronic format see DOI: 10.1039/d0ra00118j |
| This journal is © The Royal Society of Chemistry 2020 |