 Open Access Article
Radical-dominated reaction of CO–NO on a CaFe2O4 surface in sintering flue gas recirculation†
Chaoqun Li ac,
Qingzhen Hana,
Tingyu Zhuab and
Wenqing Xu
 *ab
*ab
aResearch Center of Process Pollution Control, National Engineering Laboratory for Hydrometallurgical Cleaner Production Technology, State Key Laboratory of Multiphase Complex Systems, Institute of Process Engineering, Chinese Academy of Sciences, No. 1, 2nd North Lane, ZhongGuanCun, Beijing 100190, China. E-mail: wqxu@ipe.ac.cn
bCenter for Excellence in Regional Atmospheric Environment, Institute of Urban Environment, Chinese Academy of Sciences, Xiamen 361021, China
cUniversity of Chinese Academy of Sciences, Beijing 100049, China
First published on 19th June 2020
Abstract
The catalytic reduction behaviours between NO and CO on a CaFe2O4 surface were studied using flue gas recirculation. The reaction mechanism and control principle were investigated via experiment and theoretical calculations. The experiment results show that CaFe2O4 can catalyse the reduction of NO by CO, and the NO conversion rate increases with the increase in CO concentration. The theoretical calculations indicate that the CO–NO reaction on CaFe2O4 surfaces complies with the Eley–Rideal mechanism, and the reaction path is controlled by nitrogen, oxygen and isocyanate radicals. Specifically, the dissociation of NO into nitrogen and oxygen radicals, and the formation of subsequent isocyanate radicals dominate the reaction. The results provide new insight into the intrinsic reaction mechanism and the meso-scale control principle, allowing us to propose a novel process design scheme to improve the NOx emission reduction efficiency in the flue gas recirculation process.
1. Introduction
The reduction of NOx emission has gained much attention owing to its role in the formation of photochemical smog and acid rain.1 The iron ore sintering process can discharge approximately 0.1 million tons of NOx annually, accounting for approximately 48% of the total emissions from the iron and steel industries.2,3 A lot of studies have been done in order to decrease NOx emission, but as the emission control regulations get stricter, NOx reduction remains a challenging problem.There are two methods used to inexpensively reduce NOx emissions from sintering plants. One method is the treatment of exhaust gas.4–7 However, the large exhaust emission (around 100 m3 (m2 min)−1) and low NOx emission concentration (200–300 ppm)2,3 lead to huge capital investment and high operational cost, which makes it difficult to apply this method and have reduced the competitiveness of the plants. Another method is to reduce NOx through combustion control during the sintering process.8–12 The flue gas recirculation technique was proposed on this basis, and it is beneficial to the reduction of flue gas volume.13–15
Fig. 1 shows the typical flow process of the flue gas recirculation technology, selecting specific flue gas in the bellows and sending it back into the circulation hood for re-combustion.10,15 A recent study reported that when the proportion of flue gas recirculation is 30%, the NOx emission reduction can reach 15.51% at most.16
The reduction of NOx via flue gas recirculation is mainly due to the changes in the combustion atmosphere and the occurrence of NOx reduction reactions.17 Compared with conventional sintering process, flue gas recirculation sintering process has a low oxygen content, and a large amount of pollutants enter the combustion bed.18 Take the process design in Fig. 1 as an example, the oxygen content of circulating flue gas is about 16%, CO ∼ 1% and NO ∼ 400 ppm. Firstly, fuel combustion leads to a continuous decrease in the oxygen content, which is conducive to the conversion of fuel N to nitrogen,17 and reduces the generation of NOx.18 Secondly, the NOx generated and carried can be reduced on the surface of coke.19 In addition, calcium ferrite, main products of iron ore sintering,20,21 has been proven that there is a good catalytic effect on the reduction of NO by CO in local anaerobic conditions.22–25 Compared with other combustion processes, the special high temperature anaerobic atmosphere and the catalysis of the products make this reaction attract wide attention in the study of NO reduction in sintering.26,27
Although many researches of the CO–NO reaction in flue gas recirculation have been done,12,18,27–29 the intrinsic reaction mechanism and the control principle with the microscopic electronic structures are still not quite clear. Metallurgists had hypothesized that the catalytic process consists of two steps: iron-bearing minerals are reduced to lower valence oxides by CO, and then NO is reduced to N2 by lower valence oxides.11,16 Unfortunately, due to the small specific surface area of the material and the high reaction temperature, it is difficult to obtain direct experimental evidence to support the hypothesis.
Therefore, a further systematic research of the CO–NO reaction on CaFe2O4 surface is required. In this manuscript, aiming at uncovering the intrinsic reaction mechanism, the CO–NO reaction on CaFe2O4 surface will be studied through experimental design and DFT calculation. The results were conducive to further understanding of the NOx eliminate mechanism and the meso-scale control principle during flue gas recirculation sintering.
2. Materials and methods
2.1 Synthetic procedures
The CaFe2O4 in this work was synthesized by solid sintering methods using ferric oxide (Fe2O3) and calcium carbonate (CaCO3) as precursors. CaFe2O4 were prepared by following steps. The precursors were first mixed in a mortar at a molecular ratio of 1![[thin space (1/6-em)]](https://www.rsc.org/images/entities/char_2009.gif) :
:![[thin space (1/6-em)]](https://www.rsc.org/images/entities/char_2009.gif) 1. After mixing, the powder was then tableted and placed into a muffle furnace to be calcined for 12 hours in air at 1150 °C.
1. After mixing, the powder was then tableted and placed into a muffle furnace to be calcined for 12 hours in air at 1150 °C.
2.2 Experimental setup and activity test
The activity tests were evaluated in a continuous-flow fixed-bed quartz microreactor (Fig. S1,† i.d. = 4 mm) from 200 °C to 600 °C with 3 g of sample (40–60 mesh). The reaction was kept at 5 min for temperature improvement and 55 min at each temperature to ensure steady state operation. The default gaseous hourly space velocity (GHSV) is approximately 95![[thin space (1/6-em)]](https://www.rsc.org/images/entities/char_2009.gif) 000 h−1, which is designed to eliminate the effects of external diffusion in order to study the intrinsic reaction. The reaction conditions are feeding 0–1% CO, and 0–500 ppm NO, with Ar balance. The inlet and outlet gases were monitored using a FTIR spectrometer (Nicolet 6700) equipped with a 2 m gas cell and a DTGS detector with a resolution of 0.5 cm−1. The collection region was 4000–600 cm−1 and 16 scans per time.
000 h−1, which is designed to eliminate the effects of external diffusion in order to study the intrinsic reaction. The reaction conditions are feeding 0–1% CO, and 0–500 ppm NO, with Ar balance. The inlet and outlet gases were monitored using a FTIR spectrometer (Nicolet 6700) equipped with a 2 m gas cell and a DTGS detector with a resolution of 0.5 cm−1. The collection region was 4000–600 cm−1 and 16 scans per time.
2.3 Material characterization
The X-ray powder diffraction (XRD) patterns of the various specimens were collected by an X-ray powder diffractometer (Bruker D8 ADVANCE Diffractometer) with Cu Kα radiation (λ = 0.15406 nm) operated at 40 kV and 40 mA. The patterns were measured over a 2θ range of 5–80° with a scanning step of 0.02°.Diffuse reflectance infrared Fourier transform spectroscopy (DRIFTS) were obtained using a Nicolet 6700-FTIR equipped with a smart collector and a liquid N2 cooled MCT detector. The flow of the feed gas mixture was controlled by MFCs. Prior to each experiment, the sample (approximately 30 mg) was pre-treated with pure Ar at 500 °C for 1 h, and then cooled to room temperature (25 °C). All spectra were obtained with a resolution of 4 cm−1 and accumulating 32 scans. A background spectrum was subtracted from each spectrum.
2.4 Theoretical methods
All calculations presented in this work were performed with the Cambridge Serial Total Energy Package in the Materials Studio package30 based on the plane-wave ultrasoft pseudo potential method of the density functional theory (DFT). The exchange–correlation potential was described by the Perdew–Burke–Ernzerhof (PBE) functional of the generalized gradient approximation (GGA).31 The cut off energy for the plane-wave basis set was set at 380 eV. The Monkhorst–Pack scheme k-point grid sampling for the Brillouin zone was set as 3 × 3 × 3 for the CaFe2O4 unit cell, and 3 × 3 × 1 for the CaFe2O4 surface models. The convergence criterion for the self-consistent field (SCF) was set at 5.0 × 10⁻⁷ eV per atom. All the atom coordinates are fully optimized until the forces on every atom were smaller than 0.01 eV Å−1. The interaction between the valence electrons and the ionic core was described by the ultrasoft pseudo potential.Finally, the band structure, the electronic densities of states, and the electron localization function of the optimized CaFe2O4 unit cell were calculated by GGA for the exchange–correlation functional information.
The adsorption energy Ea is defined by the following formula:
| Ea = Etotal − Ec − Eg, | (1) |
3. Results and discussion
3.1 Activity
The NO conversion over CaFe2O4 and SiO2 was conducted under the conditions of 400 ppm NO, 1% CO and Ar balance at a GHSV of 95![[thin space (1/6-em)]](https://www.rsc.org/images/entities/char_2009.gif) 000 h−1 within 200–600 °C. As shown in Fig. 2, CO can react with NO under SiO2 filling when the temperature is higher than 350 °C, but the maximum conversion rate of NO is only 10% at 600 °C under the experimental conditions. When filling CaFe2O4, the reaction can occur at 300 °C, and 100% NO conversion was obtained at 500 °C. In addition, NO2 and N2O were not detected in the whole reaction process (Fig. S2†).
000 h−1 within 200–600 °C. As shown in Fig. 2, CO can react with NO under SiO2 filling when the temperature is higher than 350 °C, but the maximum conversion rate of NO is only 10% at 600 °C under the experimental conditions. When filling CaFe2O4, the reaction can occur at 300 °C, and 100% NO conversion was obtained at 500 °C. In addition, NO2 and N2O were not detected in the whole reaction process (Fig. S2†).
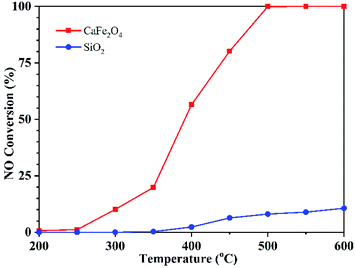 | ||
Fig. 2 NO conversion over CaFe2O4 and SiO2 at different temperatures. Reaction conditions: 1% CO, 400 ppm NO, Ar balance, GHSV 95![[thin space (1/6-em)]](https://www.rsc.org/images/entities/char_2009.gif) 000 h−1. 000 h−1. | ||
SiO2 is inert, so it can be considered that when SiO2 is filled, the homogeneous reaction occurs between the gas CO and NO, and the NO conversion is very low when the reaction is below 600 °C. The filling of CaFe2O4 significantly improved the NO conversion at low temperature, which reduced the reaction activation energy. These results indicate that CaFe2O4 can catalyse CO to reduce NO during sintering flue gas recirculation.
3.2 Mechanism
To determine how the reaction occurred, the adsorption of CO and NO was confirmed by in situ DRIFTS adsorption experiments, and the dynamic DRIFTS spectra with time are given in Fig. 3.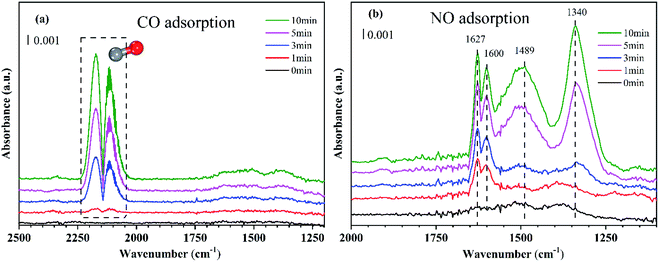 | ||
| Fig. 3 Dynamic changes of in situ DRIFTS for the CaFe2O4 as a function of time in a flow of (a) CO and (b) NO at 50 °C. Reaction conditions: (a) 1% CO, Ar balance; (b) 400 ppm NO, Ar balance. | ||
As shown in Fig. 3(a), when the CaFe2O4 was exposed to a flow of CO, bands appeared at 2220–2050 cm−1. This was ascribed to the gaseous CO molecular vibration peak. Besides, CO adsorption peaks were not observed on the graph, so it can be inferred that CO does not adsorb on the CaFe2O4 surface.
The CaFe2O4 was exposed to a flow of NO, and the corresponding changes are displayed as a function of time in Fig. 3(b). As can be seen, the bands at 1627 cm−1, 1600 cm−1, 1489 cm−1, and 1340 cm−1 appeared. According to previous studies, we ascribed the bands at 1627 cm−1 to bridging bidentate nitrate, and at 1600 cm−1 to chelated double ligand nitrate.32 The bands near 1489 cm−1 were related to monodentate nitrate33 and the peaks at 1340 cm−1 were associated with the nitrocompound.11,34 As the adsorption time increases, chelated double ligand nitrate and bridging nitrates first appear, followed by monodentate nitrates and nitrocompound, indicating that NO can continue to adsorb on the catalyst surface. Based on the gas adsorption results observed in in situ DRIFTS, it could be inferred that CO may participate in the reaction in a gaseous state, that is, the reaction may accord with the Eley–Rideal reaction mechanism.
3.3 Calculation results
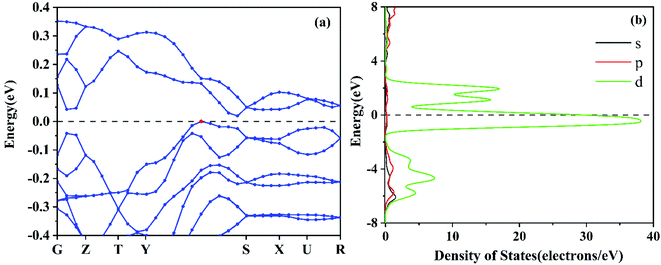
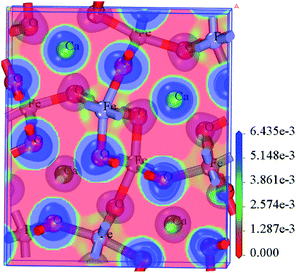
According to the XRD crystal data (Fig. S1†), the calculation model of the CaFe2O4 crystal structure is constructed and optimized (Fig. S3†). The results showed that the CaFe2O4 shows a distinct spinel structure, and belongs to the primitive-cantered structure with a space group of Pnma. The optimized lattice parameters a, b, c, and space group (Table S1†) are in good agreement with the former experimental measurements from XRD data in this work and the literature.35In order to explore the activity and the active centres of the NO–CO catalytic reaction, the band structure, the electronic density of states, and the electron localization function of the CaFe2O4 are analysed. Fig. 4(a) depicts the band structure of the optimized CaFe2O4 unit cell. The Fermi surface is close to the energy level (−0.278 eV → 0.0 eV) above the valence band top, which demonstrates that CaFe2O4 is a p-type semiconductor, and there are more free holes in the valence band that can accept electrons from reactions and activate the nearby atoms on the CaFe2O4 surface. The Fe partial density of states in CaFe2O4 (Fig. 4(b)) indicates that this energy level (−0.278 eV → 0.0 eV) is mainly composed of the d orbital of Fe atoms, showing that the Fe atoms and the nearby atoms possess high catalytic activity for reduction reactions. The electron localization function (Fig. 5) also demonstrates that there is weak interaction between some Fe atoms and the surrounding atoms, which indicates that these Fe atoms and their nearby O atoms may be the active centres of the catalytic reaction.
To select the suitable crystal surface, all the CaFe2O4 surfaces were built and optimized based on the optimized structure of the CaFe2O4 unit cell. The CaFe2O4 crystal surfaces work functions of (110), (001), (100), (111), and (101) are 4.271 eV, 4.547 eV, 5.241 eV, 4.602 eV and 5.011 eV, respectively. Obviously, the CaFe2O4 (110) surface work function is the smallest, indicating that the catalytic activity of the CaFe2O4 (110) surface is the highest. So, the CaFe2O4 (110) was selected as the catalytic reaction surface. Then the 10-layer-atoms periodic structure of CaFe2O4 (110) adsorbed the NO and CO molecules (Fig. S5†) was adopted as the best adsorption method. The initial adsorption distance was set at 2.5 Å. For each gas molecule, the steadiest adsorption structure with the lowest energy was determined by comparing lots of optimized structures from different initial configurations designed by in situ DRIFTS.
Furthermore, the adsorption methods for all reactants (NO and CO) and products (CO2 and N2) were optimized and analysed on CaFe2O4 (110). The adsorption energies Ea (Table S2†) of reaction gases CO, NO, CO2, and N2 on the CaFe2O4 (110) surface are −0.57 eV, −2.54 eV, −9.48 eV and −1.84 eV, respectively, which illustrates that the adsorption rate-control step is CO adsorption, and the desorption rate-control step is CO2 desorption. In addition, the work function (Table S2†) of the catalytic reaction system after NO adsorption and CO adsorption are 4.727 eV and 4.831 eV, respectively, showing that the surface electrons of the catalyst are easier to excite after NO adsorption, and the reaction occurs more easily. It is clear that NO gas molecules are first activated and dissociated on the CaFe2O4 (110) surface.
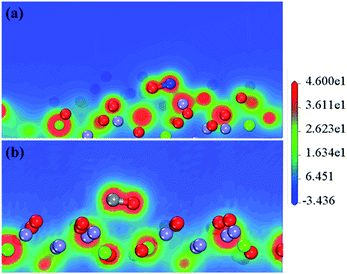
Fig. 6 intuitively shows the electron interactions between NO, CO, and the surface of the catalyst. It shows that after NO adsorption on the CaFe2O4 (110) surface, the NO electrons transfer to the Fe atoms (0.55e → 0.91e) and nearby O atoms (−0.67e → −0.71e), resulting in an increase in catalytic activity. Moreover, the N–O interaction in the NO molecule is weakened, leading to NO dissociation by activation. The NO and CO partial density of states (Fig. 7) also shows that NO-adsorbed electrons enter the catalyst's conduction band and valence band near the Fermi surface, causing the Fermi surface of the catalyst to move upwards. The CO adsorption does not affect the catalyst's conduction band near the Fermi surface. All the results indicate that the reaction proceeds by NO adsorption on the oxygen near the Fe atom, and that activation dissociation occurs first. The results are consistent with previous experimental results.
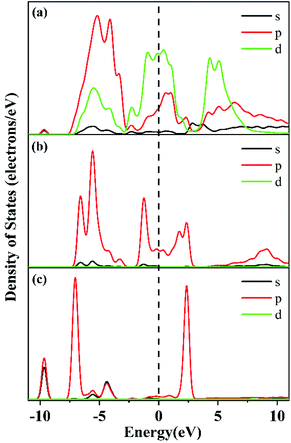 | ||
| Fig. 7 The partial density of states of (a) CaFe2O4 + CO + NO, (b) NO adsorption on CaFe2O4, and (c) CO adsorption on CaFe2O4. | ||
Combined with the previous results of adsorption energy, work function, density of states, and surface interaction analysis before and after adsorption, and the desorption rate-control step is CO2 desorption. The elementary reaction path of this reaction can be set as follows:
Adsorption:
| CO (g) + CaFe2O4 (110) ↔ CO (a) |
| NO (g) + CaFe2O4 (110) ↔ NO (a) |
NO dissociation:
| NO (a) → N· (a) + O· (a) (RDS) |
Reaction:
| CO (a) + O· (a) → CO2 (a) |
| N· (a) + N· (a) → N2 (a) |
| N· (a) + NO (a) → N2O (a) |
| N· (a) + CO (g) → NCO· (a) |
| NCO· (a) + NO (g) → CO2 (a) + N2 (a) |
| N2O (a) → N2 (a) + O· (a) |
Desorption:
| N2 (a) → N2 (g) + CaFe2O4 (110) |
| CO2 (a) → CO2 (g) + CaFe2O4 (110) |
Total reaction equation:
| 2CO (g) + 2NO (g) → N2 (g) + 2CO2 (g) |
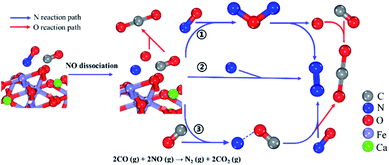
The variations in the Gibbs free energy and activation energy for the reactions with different paths were obtained as shown in Fig. 8. The reaction rate-control step is NO (a) dissociation (Δ≠G = 9.047 eV). First, NO (a) are activated and dissociated near the Fe atoms of the CaFe2O4 (110) surface. Next, the dissociated oxygen free radical (O· (a)) reacts with the adsorbed CO (CO (a)) to form CO2 (a) (Δ≠G = −8.096 eV). The dissociated nitrogen free radicals (N· (a)) follow three paths (Fig. 9): ① one N· (a) combines with the NO (a) to generate the N2O (a) intermediate (Δ≠G = 0.1206 eV). The N2O (a) are unstable and decompose into N2 (a) and O· (a) (Δ≠G = −4.132 eV). ② Two N· (a) are combined to form N2 (N2 (a)) (Δ≠G = −20.368 eV). ③ One N· (a) combines with the CO (g) to generate the NCO· (a) intermediate (Δ≠G = −15.697 eV), and then the NCO· (a) intermediate will continue to react with the NO (g) to form stable CO2 (a) and N2 (a) (Δ≠G = −5.235 eV). These results are exactly the same as that of the previous experimental phenomena, in which N2O gas is not observed.
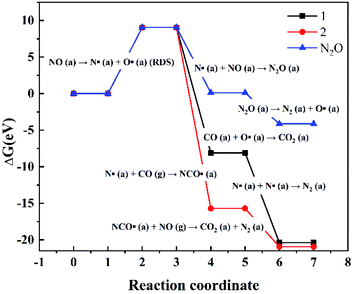 | ||
| Fig. 8 The variation in the Gibbs free energy and activation energy for the reactions with different paths on the CaFe2O4 (110) at 298.15 K and 1 atm. | ||
In addition, we also can find that the CO has a weak physical adsorption interaction with the CaFe2O4 (110) surface from the results of the adsorption energy and the DOS in the calculation results. However, the CO adsorption interaction is very weak and the structure of the adsorbed CO is also very unstable, so it is almost impossible to be measured in the case of excessive CO (g) in the actual reaction, and the calculation results also show that CO is mainly in a gaseous state participated in the reaction from the results of the Gibbs free energy and activation energy. Therefore, the trace amounts of CO (a) only reaction with O· (a) to form CO2 (a), and a large amount of CO (g) mainly reaction with N· (a) to generate the NCO· (a) intermediate.
Furthermore, since the collision probability of the two nitrogen free radicals is very small, and the Gibbs free energy variation in the NCO· intermediate is also very low, the reaction path of the NCO· intermediate is more likely to occur in the case of excessive CO (g) in the actual reaction, which is consistent with the previous experimental results.
3.4 Effect of reaction atmosphere
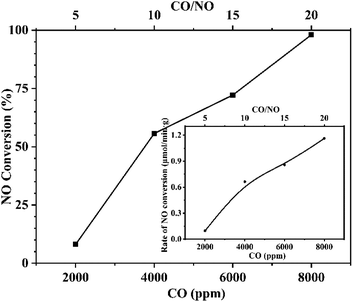
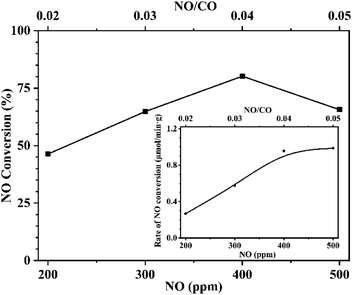
To further confirm this conclusion, CaFe2O4 was selected to conduct an additional reaction analysis. The rate of NO conversion was examined by changing the ratio of NO to CO in the reactor feed. Fig. 10 shows the effect of changing the CO concentration ratio on the conversion and the normalized conversion rate at a fixed NO feed concentration of 400 ppm. Fig. 11 shows the effect of changing NO concentration when the concentration of CO is fixed at 1%. Examining Fig. 10, it is found that increased concentration of CO in the reactant feed improves both, the conversion of NO as well as the rate of NO disappearance (Fig. 10 inset). The result is more significant given the fact that the enhanced rate of NO disappearance is even observed when CO concentration is 8000 ppm. This demonstrates that a CO molecule does not provide any competition to the NO molecule for site occupancy on the catalyst surface and that the CO participates in the reaction in a gaseous state. This observation is supported by the data shown in Fig. 11 and Fig. 11-inset, which show that an increase in NO concentration from 200 to 400 ppm while maintaining a fixed concentration of CO resulted in increasing the NO conversion while the rate of NO conversion peaks to a maximum. Further increase of NO concentration to 500 ppm leads to the decrease of reaction rate, and the conversion rate tends to be stable because the adsorbed NO cannot be dissociated in time. The above analysis further proves the fact that the CO participates in the reaction in the gaseous state, and the adsorption and dissociation of NO is the rapid step in the reaction. This phenomenon inspired us to propose a flue gas recirculation process to enhance NOx emission reduction. A bellows with high CO concentration can be selected to increase the CO concentration in the circulating flue gas, thus promoting the reduction of NO in the sintered bed and enhancing the NOx reduction effect of flue gas recycling.4. Conclusions
In the present work, we confirmed that CaFe2O4 shows a significant catalytic effect on the CO–NO reaction in the flue gas recirculation. On this basis, we carefully investigated the reaction mechanism and reaction path. Both the in situ DRIFTS experiments and DFT calculations all demonstrated that the CO–NO reaction on the surface of CaFe2O4 accorded with the Eley–Rideal mechanism. And the results show that the reaction is dominated by free radicals. Firstly, NO is adsorbed on the surface of CaFe2O4, and the adsorbed NO will be dissociated into nitrogen radicals and oxygen radicals to continue, which is also the rate-determining step of the reaction. Next, the dissociated nitrogen radicals will react with gaseous CO to form isocyanate radicals, the isocyanate radicals further react with gaseous NO to form CO2 and N2. Intensive experiment studies have also verified the limitations of free radicals and further confirmed that increasing the concentration of CO during flue gas recycling is beneficial to reduce this limitation, which provides new theoretical guidance for the design of the flue gas circulation process.Conflicts of interest
There are no conflicts to declare.Acknowledgements
This work was supported by the National Key Research and Development Program of China (No. 2017YFC0210304), Hebei Science and Technology Major Special Projects (No. 19074013Z) and National Natural Science Foundation of China (No. 51938014).References
- P. C. Wang, L. Yao, Y. J. Pu, L. Yang, X. Jiang and W. J. Jiang, RSC Adv., 2019, 9, 36658–36663 RSC.
- F. Xiaohui, Y. Zhiyuan and G. Min, Ironmak. Steelmak., 2016, 43, 403–410 CrossRef.
- L. Lu, T. C. Ooi and X. Li, Iron Ore, 2015, 551–579 CrossRef.
- S. Singh, M. A. Nahil, X. Sun, C. F. Wu, J. H. Chen, B. X. Shen and P. T. Williams, Fuel, 2013, 105, 585–594 CrossRef CAS.
- F. M. Wang, B. X. Shen, S. W. Zhu and Z. Wang, Fuel, 2019, 249, 54–60 CrossRef CAS.
- W. J. Zhang, G. F. Liu, J. Jiang, Y. C. Tan, Q. Wang, C. H. Gong, D. K. Shen and C. F. Wu, RSC Adv., 2019, 9, 32110–32120 RSC.
- J. Q. Xu, H. L. Wang, F. Guo, C. Zhang and J. Q. Xie, RSC Adv., 2019, 9, 824–838 RSC.
- X. Fan, Z. Yu, M. Gan, X. Chen, Q. Chen, S. Liu and Y. Huang, ISIJ Int., 2015, 55, 2074–2081 CrossRef CAS.
- G. Wang, Z. Wen, G. F. Lou, R. F. Dou, X. W. Li, X. L. Liu and F. Y. Su, Int. J. Heat Mass Tran., 2016, 97, 964–974 CrossRef CAS.
- Y. Chen, Z. Guo and G. Feng, Int. J. Min. Met. Mater., 2011, 18, 390–396 CrossRef CAS.
- B. V. Reddy and S. N. Khanna, Phys. Rev. Lett., 2004, 93, 068301 CrossRef CAS PubMed.
- W. J. Ni, H. F. Li, Y. Y. Zhang and Z. S. Zou, Energies, 2019, 12 DOI:10.3390/en12020213.
- X. Fan, G. Wong, M. Gan, X. Chen, Z. Yu and Z. Ji, J. Clean. Prod., 2019, 235, 1549–1558 CrossRef CAS.
- G. Wang, Z. Wen, G. F. Lou, R. F. Dou, X. W. Li, X. L. Liu and F. Y. Su, Appl. Therm. Eng., 2016, 102, 648–660 CrossRef CAS.
- H. Zhang, M. Rao, Z. Fan, Y. Zhang, G. Li and T. Jiang, ISIJ Int., 2012, 52, 2139–2144 CrossRef CAS.
- Z. Yu, X. Fan, M. Gan, X. Chen and W. Lv, JOM, 2017, 69, 1570–1574 CrossRef CAS.
- H. Zhou, M. Zhou, Z. Liu, M. Cheng and J. Chen, Fuel, 2016, 179, 322–331 CrossRef CAS.
- H. Zhou, P. Ma, M. X. Zhou, Z. Y. Lai and M. Cheng, J. Energy Inst., 2019, 92, 1476–1486 CrossRef CAS.
- S. Takeshi, S. Wu, K. Morioka, E. Kasai and Y. Omori, Tetsu to Hagané, 1994, 80, 276–281 CrossRef.
- R. Mezibricky and M. Frohlichova, J. Min. Metall. B Metall., 2018, 54, 9–20 CrossRef CAS.
- X. Tang and D. Wang, Sintering Theory and Technology, 1992, 107–125 Search PubMed.
- X. Fan, Z. Yu, M. Gan, X. Chen and Y. Huang, Ironmak. Steelmak., 2016, 43, 712–719 CrossRef CAS.
- K. Taira, Fuel, 2019, 236, 244–250 CrossRef CAS.
- M. Gan, Z. Y. Ji, X. H. Fan, Y. J. Zhao, X. L. Chen and Y. Fan, J. Clean. Prod., 2019, 232, 1335–1347 CrossRef CAS.
- K. Morioka, S. Inaba, M. Shimizu, K. Ano and T. Sugiyama, ISIJ Int., 2000, 40, 280–285 CrossRef CAS.
- X. L. Chen, X. H. Fan, M. Gan, Y. S. Huang and Z. Y. Yu, Ironmak. Steelmak., 2018, 45, 434–440 CrossRef CAS.
- Z. Y. Yu, X. H. Fan, M. Gan, X. L. Chen and W. Lv, JOM, 2017, 69, 1570–1574 CrossRef CAS.
- M. Gan, X. H. Fan, Z. Y. Yu, X. L. Chen, Z. Y. Ji, W. Lv, S. Liu and Y. S. Huang, Ironmak. Steelmak., 2016, 43, 442–449 CrossRef CAS.
- H. Zhou, P. N. Ma, M. Cheng, M. X. Zhou and Y. W. Li, ISIJ Int., 2018, 58, 1650–1658 CrossRef CAS.
- M. D. Segall, P. J. D. Lindan, M. J. Probert, C. J. Pickard, P. J. Hasnip, S. J. Clark and M. C. Payne, J. Phys. Condens. Matter, 2002, 14, 2717–2744 CrossRef CAS.
- J. P. Perdew, J. A. Chevary, S. H. Vosko, K. A. Jackson, M. R. Pederson, D. J. Singh and C. Fiolhais, Phys. Rev. B: Condens. Matter Mater. Phys., 1993, 48, 4978 CrossRef CAS PubMed.
- A. Zecchina, D. Scarano, S. Bordiga, G. Ricchiardi, G. Spoto and F. Geobaldo, Catal. Today, 1996, 27, 403–435 CrossRef CAS.
- K. I. Hadjiivanov, Catal. Rev., 2000, 42, 71–144 CrossRef CAS.
- P. L. Sun, X. X. Cheng, Y. H. Lai, Z. Q. Wang, C. Y. Ma and J. C. Chang, RSC Adv., 2018, 8, 36604–36615 RSC.
- D. D. Miller and R. Siriwardane, Appl. Energy, 2018, 224, 708–716 CrossRef CAS.
Footnote |
| † Electronic supplementary information (ESI) available. See DOI: 10.1039/d0ra00064g |
| This journal is © The Royal Society of Chemistry 2020 |


