DOI:
10.1039/C9RA10927G
(Paper)
RSC Adv., 2020,
10, 11400-11409
Effects of oxygen-containing functional groups on the synergy effect in pulsed bipolar plasma-catalytic reactions of volatile organic compounds
Received
26th December 2019
, Accepted 5th March 2020
First published on 20th March 2020
Abstract
This study investigated the synergy effect of three high-concentration oxygenated reactants (4000 ppmv), namely 2-butanol, butanone, and ethyl acetate, in pulsed bipolar plasma-catalytic reactions using prepared La0.7Sr0.3MnO3/mullite and isopentane as the catalyst and control compound, respectively. The intensity of the N I 336.62* peak of in situ optical emission spectra was used as the representative intensity to depict the behavior of plasma discharge. The results demonstrate that the variation in trends of plasma discharge with temperature for the four reactants was similar in terms of rising rates, and differences in functional groups did not significantly affect behavior during the reactions. The selected oxygenated organics were clearly more susceptible to catalysis alone and plasma catalysis than the control compound. The results indicate that the relative polarity of oxygenated reactants is a more crucial factor in plasma catalysis than their dielectric constant and ionization potential. A synergy quantitative index (ΛX) and synergy factor (ΨX) were defined to characterize the synergistic behavior of plasma catalysis. The variation of ΛX with conversion X demonstrates that plasma dissociation was dominant at low conversion rates, and catalysis was dominant at high conversion rates in the plasma-catalytic reaction. The order of ΨX values was opposite to that of relative polarities for the reactants. Overall, the plasma-catalytic reaction was construed as the combination of plasma dissociation and synergistic catalysis. ΨX was introduced into synergistic catalysis to establish a theoretical formula for the plasma-catalytic reaction. This theoretical formula was proven to be accurate by comparing experimental and theoretical results, and it successfully predicted the conversion–temperature curve of plasma catalysis.
1. Introduction
Small-chain oxygenated compounds such as alcohols, esters, and carbonyls compounds are widely used as solvents, raw materials, or fuel additives.1–3 In addition, they are the main components in vehicle exhaust.4,5 Therefore, they are often present in high concentrations in the exhaust gases resulting from industrial processes and mobile sources and require treatment. Plasma-catalytic reactions remove volatile organic compounds (VOCs) from exhaust gases; these reactions have been proven to be an efficient method, especially in terms of energy efficiencies.6 Catalysis is enhanced by plasma discharge activation of the source gas. Nonthermal plasma can be generated using corona discharges, dielectric barrier discharges, microwave discharges, plasma jets using direct current (DC), pulsed current, DC and pulsed current, alternating current (AC), AC and DC, radio frequencies, and microwaves.7 The discharge strength and active species yield of bipolar pulses are greater than those of AC and DC.8 Several studies have applied plasma catalysis to remove VOCs using supported metals,9–11 metal oxides,12–14 supported metal–metal,15 metal–metal oxides,16,17 or perovskite-type18–20 catalysts. Perovskite oxide has a crystal structure similar to that of calcium titanate (CaTiO3).21 Perovskite oxide has high temperature resistance, a satisfactory dielectric value (ε = 2000–10![[thin space (1/6-em)]](https://www.rsc.org/images/entities/char_2009.gif) 000),22,23 ferroelectricity, and catalytic ability.24,25 Thus, mullite-supported La0.7Sr0.3MnO3 perovskite oxide was selected as the catalyst in this study.
000),22,23 ferroelectricity, and catalytic ability.24,25 Thus, mullite-supported La0.7Sr0.3MnO3 perovskite oxide was selected as the catalyst in this study.
The interaction between plasma and catalyst is highly complex because their interaction occurs at a far-from-equilibrium state. Whitehead26,27 described various interactions between plasma and the catalyst, effects of catalysts on the properties of the discharge, and changes in the performance of the catalyst. Neyts et al.6 reported that relatively less information is available on the factors of observed synergy because the process of plasma catalysis is highly complex. The plasma modifies the source gas composition to form reactive species (ions, atoms, radicals, and molecules) on the surface where the plasma–catalyst interactions occur, and these interactions reduce the activation barriers for certain reactions. In this study, the effects of oxygen-containing functional groups on the energy synergy effect in pulsed bipolar plasma-catalytic reactions were investigated. Three oxygenated compounds with different oxygen-containing functional groups, namely 2-butanol, butanone, and ethyl acetate, were selected as representative organic reactants because they are commonly used oxygenated compounds in industrial processes and are usually present in high concentrations in exhaust gas. In addition, isopentane was used as the control compound because it is similar in terms of the number of carbon atoms and molecular weight. The structures of the four reactants are shown in Fig. 1. The kinetics of the reactions were also investigated.
 |
| | Fig. 1 The structures of four reactants. | |
2. Materials and methodology
2.1 Catalyst preparation and characterization
Excessive impregnation, comprising a two-stage calcination method, was used to prepare the La0.7Sr0.3MnO3/mullite catalyst for pulsed bipolar plasma-catalytic reactions on high-concentration oxygenated compounds. The La0.7Sr0.3MnO3/mullite catalyst was used as a representative catalyst in this study because of its high catalytic activity and suitable dielectric property. The detailed preparation process is described in our previous study.28 First, the Kaolin K99-C pellet (diameter: approximately 2 mm) was calcined at 700 °C to prepare a semi-finished mullite support. The semi-finished mullite support was then excessively impregnated by immersing it in a precursor solution (1 M) containing stoichiometrically balanced amounts of La(NO3)3, Sr(NO3)3, and Mn(NO3)3. Next, the impregnated product was dried and calcined at 120 °C for 1 h and 1000 °C for 6 h, respectively. The result obtained using a porosimetry analyzer (Micromeritics ASAP 2020) showed that the specific surface area, pore volume, and pore diameter of the La0.7Sr0.3MnO3/mullite catalyst were 1.6778 m2 g−1, 0.01395 cm3 g−1, and 52.226 Å, respectively. The X-ray diffraction pattern (obtained using a Bruker D2 phaser XRD) indicated that the predominant structure of the prepared catalyst was that of perovskite. The morphology of the prepared catalyst exhibited some disorder that contained interwoven block-like constructs in a size range of approximately 5–10 μm, which were observed using a cold field emission scanning electron microscope (HITACHI, S-4800 FESEM/EMAX400). The block-like construct exhibited a satisfactory crystalline configuration.
2.2 Reaction apparatus and procedures
The experimental apparatus consisted of a feed system, pulse bipolar plasma power supply unit, reactor, analyzers, and electrical measurement systems (Fig. 2). The feed system comprised a syringe pump (Stoelting, Model-100) for injecting liquid organic reactants, an evaporator with a proportional–integral–differential (PID) temperature controller for evaporating organic reactants, and an air cylinder with a mass flow controller for delivering the reaction gas into the reactor. The plasma power system consisted of a dual-channel DC generator (ENI DCG-100), pulsed DC power controller (SPIK 2000A), and high-frequency transformer (ShenChang HV-3K-40-1), which provided high-frequency pulse bipolar plasma discharge for plasma catalysis. A coaxial dielectric barrier discharge (DBD) plasma-catalytic reactor was placed in a furnace (two curved heaters, HCYTECH models FTE and T-FTE) with a PID temperature controller. The reactor used a stainless steel tube (outer diameter [OD]: 21 mm, inner diameter [ID]: 18 mm, and length: 140 mm) as an external electrode, which was placed in a quartz tube (OD: 25.4 mm and ID: 21.4 mm). A mica O-ring and a ceramic honeycomb structure were placed on the upper and lower ends, respectively, of this stainless steel tube as a sealing washer and gas distributer, respectively. The internal electrode was a stainless steel rod (OD: 4 mm), which was placed in a bottom-sealed quartz tube (OD: 6 mm and thickness: 1 mm). This quartz tube also acted as a dielectric layer.
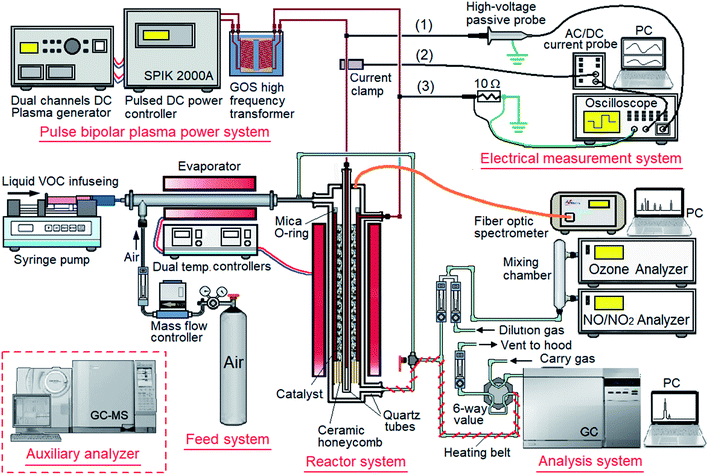 |
| | Fig. 2 Schematic diagram of the experimental apparatus, where lines (1), (2), and (3) are measuring for applied voltage, responded system current, and plasma current, respectively. | |
The analytical system consisted of a gas chromatograph-mass spectrometer (Shimadzu GC-14) with a 60 m capillary column (Supelco, fused silica column, ID: 0.25 mm) for analyzing the gases in the inlet and outlet of reactor, an ozone analyzer (ShengYi, Ozone Monitor Model-205) for analyzing residual O3, an NOx analyzer (API, NOx Monitor Model-8200A), and a dynamic double-flow dilution set for diluting the gases for analysis. An optical emission spectrometer (Avantes AvaSpec-USB2) with an optical fiber cable connected to the optical quartz window on the top of the reactor was used to obtain the in situ optical emission spectra of elements and species produced. In addition, a gas chromatograph-mass spectrometer (Shimadzu QP-2010 SE GC-MS) with a 60 m capillary column (Supelco, fused silica column, ID: 0.25 mm) was used as an auxiliary analyzer for the qualitative and quantitative analysis of the products. The measurement system consisted of a four-channel digital storage oscilloscope (Tektronix TBS 1064) with a high-voltage passive probe (Tektronix P6015A, line (1) in Fig. 2), an AC/DC current probe (Tektronix Tcp-A300, line (2) in Fig. 2), and an electric wire with a resistance of 10 Ω (line (3) in Fig. 2) for the measuring the applied voltage, response of the system current, and plasma current, respectively.
The La0.7Sr0.3MnO3/mullite catalyst pellet (34.5 g, with 1 g containing approximately 0.13 g of catalyst) was placed in the gap between the external electrode and dielectric layer. The initial concentration of the organic reactants was maintained at 4000 ± 100 ppmv. The total flow rate was maintained at 1 L min−1, and the resulting weight hourly space velocity (WHSV) was maintained at 1739 mL h−1 g−1 of the supported catalyst (or 13![[thin space (1/6-em)]](https://www.rsc.org/images/entities/char_2009.gif) 378 mL h−1 g−1 of catalyst). The frequency of 12.5 kHz was selected because it has optimal energy consumption,28 which had a bipolar cycle of 80 μs. The in situ optical emission spectra of the element and species products were determined using an optical emission spectrometer (AvaSpec-USB2, Avantes) by using an optical fiber cable connected to an optical quartz window on the top of the reactor.
378 mL h−1 g−1 of catalyst). The frequency of 12.5 kHz was selected because it has optimal energy consumption,28 which had a bipolar cycle of 80 μs. The in situ optical emission spectra of the element and species products were determined using an optical emission spectrometer (AvaSpec-USB2, Avantes) by using an optical fiber cable connected to an optical quartz window on the top of the reactor.
2.3 Pulsed bipolar plasma discharge
In this study, the operation of pulsed bipolar (PBP) plasma generation included four steps in a 50% duty cycle with 80 μs (frequency of 12.5 kHz), and the time for each step was 20 μs (Fig. 3a). The pulsed plasma was alternately discharged from the internal and external electrodes, and the power was turned off for 20 μs between the two discharges. Fig. 3b shows the waveforms of applied voltage, plasma current, and response of the system current under a frequency of 12.5 Hz and atmospheric pressure. The results showed that plasma discharge was composed of DBD with instantaneous sharp discharge and continuous surface discharge (SD). Furthermore, a weak third harmonic was observed when the power was turned off in each half cycle. These waveforms were all reversed symmetrically on two half cycles because of the pulsed bipolar electric fields had a floating output (Fig. 3b). Each waveform of the half cycle was not a rectangular pulse wave because of Debye relaxation; thus, the electric field continued to be active even when the power was turned off. The distortion of waveforms was due to the power system, particularly because a high-frequency transformer cannot respond as fast as the changes occurring in the amplitude of the input applied voltage from the pulsed DC power controller.
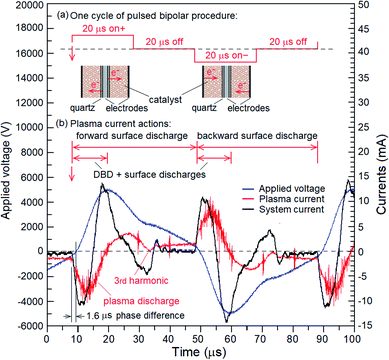 |
| | Fig. 3 Schematic diagram of one cycle of pulsed bipolar procedure and the curves of applied voltage, plasma current, and responded system current under frequency of 12.5 Hz and atmospheric pressure. | |
The pulsed bipolar plasma discharge power is a product of average plasma current and average applied voltage in a cycle. Thus, the specific energy density (SED) of the plasma can be defined as the average power (pavg, in W or J s−1) deposited per unit volume of the gas flow (Q):
| |
 | (1) |
Fig. 4 shows the optical emission spectra of air over the La0.7Sr0.3MnO3/mullite catalyst in the plasma-catalytic reactor at different SEDs. The results indicated that the intensity of in situ optical emission spectra of products (either elements or species) in the pulsed bipolar plasma-catalytic reactor increased proportionally with SED at atmospheric air pressure. The flowing gas was ionized proportionally through a gap between electrodes. The dominant emission peaks were in the wavelength region of 310–440 nm, which were emissions from excited O, N, and O3 atoms, ions, or molecules. The maximum intensity peak was observed at 336.62 nm, which was an emission from N I 336.62*. In the follow-up work, the intensity of this peak was used as the representative emission for elucidating the optical emission characterization of pulsed bipolar plasma-catalytic reactions at different reaction temperatures. In addition, seven emission peaks at 406.05, 631.0, 673.8, 715, 727, 777.53, and 844.63 nm were observed; the aforementioned peaks represented the intensities of excited O atoms, OH radicals, and O2 molecules, which were also crucial because their intensities are related to the oxidation of VOCs.
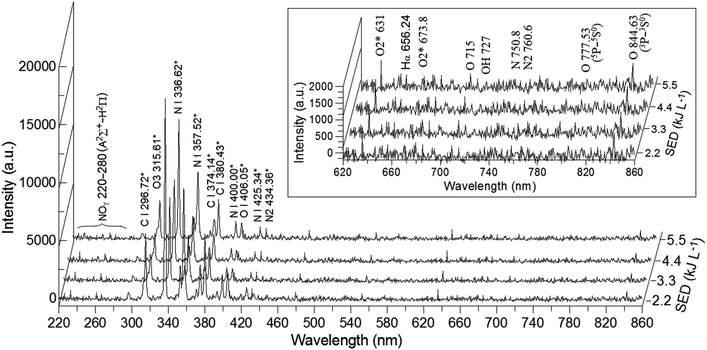 |
| | Fig. 4 Optical emission spectra of air over La0.7Sr0.3MnO3/mullite catalyst in the plasma-catalytic reactor at different applied SEDs. | |
3. Results and discussion
3.1 Catalysis
As aforementioned, 2-butanol, butanone, and ethyl acetate were selected as representative oxygenated organic reactants, and isopentane was used as the control reactant. Fig. 5 shows the conversion curves of the oxidation of the four reactants without plasma discharge over the prepared La0.7Sr0.3MnO3/mullite catalysts. The catalytic reactivity of the four reactants was follows: 2-butanol > butanone > ethyl acetate > isopentane. The temperatures at the 99% conversion rates (T99) of 2-butanol, butanone, ethyl acetate, and isopentane oxidations over the La0.7Sr0.3MnO3/mullite catalysts were 302 °C, 320 °C, 339 °C, and 440 °C, respectively. The results revealed that the T99 between the three small-chain oxygenated compounds differed by a pitch of approximately 20 °C; T99 values were in the following order: carboalkoxy > carbonyl > hydroxyl groups. By contrast, the T99 of isopentane (control compound) is considerably higher than that of the other reactants (>100 °C). The conversion rates of four reactants at T ≤ 120 °C were close to zero, which indicated that their catalysis was negligible at low temperatures.
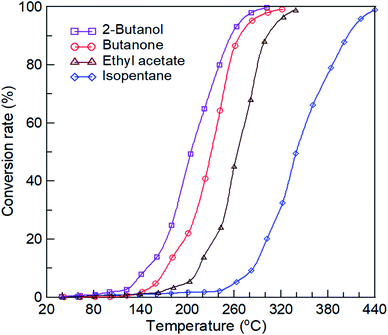 |
| | Fig. 5 Conversion curves of four reactants oxidation over La0.7Sr0.3MnO3/mullite catalysts. The feed concentration of reactants and the weight-hour space velocity (WHSV) were kept at 4000 ± 100 ppmv and 1739 mL per h per g-supported catalyst, respectively. | |
3.2 Plasma catalysis
The conversion curves of the oxidation of the four reactants in the pulsed bipolar plasma-catalytic reaction over the prepared La0.7Sr0.3MnO3/mullite catalyst are shown in Fig. 6a. The conversions of the four reactants at 40 °C and applied SED of 3.32 kJ L−1 in the pulsed bipolar plasma-catalytic reaction were higher than 20%, which indicated that strong plasma dissociation occurred when the power of pulsed bipolar plasma was turned on. The conversion rates of 2-butanol, butanone, ethyl acetate, and isopentane at 40 °C were approximately 39%, 37%, 26%, and 20%, respectively. The order of catalytic reactivity of the four reactants was same as that in catalysis: 2-butanol > butanone > ethyl acetate > isopentane. The T99 values of 2-butanol, butanone, ethyl acetate, and isopentane plasma catalysis over the prepared La0.7Sr0.3MnO3/mullite catalyst were 220 °C, 222 °C, 238 °C, and 341 °C, respectively. Compared with catalysis alone, the reduction in the T99 of the reactants was 80 °C to 100 °C, and 2-butanol demonstrated the lowest reduction (approximately 80 °C). Because the feed concentration of the reactants was extremely high (4000 ± 100 ppmv), the results demonstrated the benefits of using the La0.7Sr0.3MnO3/mullite catalyst in treating organic exhaust in high-variation operations.
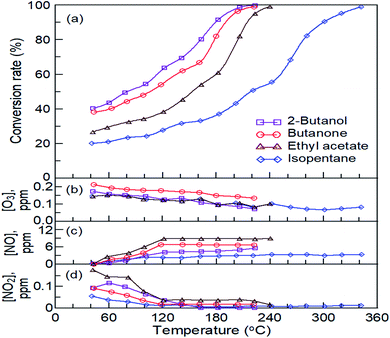 |
| | Fig. 6 The conversions (a) and the residue ozone (b) and nitrogen oxides (c and d) concentrations of four reactants over La0.7Sr0.3MnO3/mullite catalyst at specific energy density of 2.77 kJ L−1 in the plasma-catalytic reactor. | |
Residual ozone (O3), nitric oxide (NO), and nitrogen dioxide (NO2) concentrations produced by the four reactants after plasma-catalytic reactions over the La0.7Sr0.3MnO3/mullite catalyst are shown in Fig. 6b, c, and d, respectively. The residual concentrations of O3 after the oxidation of the four reactants over the La0.7Sr0.3MnO3/mullite catalyst at an applied SED of 3.32 kJ L−1 were lower than 0.25 ppmv; the highest yield of O3 was found for butanone (Fig. 6b). The residual concentrations of O3 decreased with a decrease in the temperature for plasma catalysis of the four reactants. The decrease in residual O3 may have been due to its rapid reaction with other species, such as reactants and products (elemental and species products of plasma), in the reactor. The residual NO curve exhibited an increase in the residual concentrations of NO with increasing temperature, which was exactly opposite to the curves of produced NO2 and O3 (Fig. 6c). However, the amounts of NO produced from butanone and ethyl acetate plasma catalysis were approximately the same at T ≥ 120 °C. Conversely, all of the yielded amounts of NO2 by conducting plasma catalysis were decreased to a constant amount when T ≥ 120 °C (Fig. 6d). The conversion rates of the four reactants during catalysis at T > 120 °C gradually increased; this increase may have caused the almost constant yields of NO and NO2 at T ≥ 120 °C. Catalysis inhibited the yields of NO and NO2.
The high dielectric constant and high polarity of gaseous reactants favored plasma discharge, but the ionization potential exhibited exactly opposite behavior. Table 1 presents the dielectric constants, ionization potentials, and relative polarities of the four reactants. Isopentane exhibited the lowest dielectric constant and polarity and the highest ionization potential; hence, plasma discharge under it was the worst. Although the electrical properties of dielectric constant and ionization potential of butanone were superior to those of 2-butanol in plasma discharge, the relative polarity of 2-butanol was significantly higher than that of butanone; thus, the plasma dissociation of 2-butanol was the strongest (Fig. 6). Because the amounts of air in the catalysis of for reactant were excess. Therefore, the difference between the electrical characteristics of the gas flow between the plasma-catalyzed reactions of the four reactants attributable to air was small. However, water and carbon dioxide were the two main products that would affect the electrical characteristics of the gas flow in the reactor. The dielectric constant and ionization potential of carbon dioxide are similar to that of air and slightly higher than of the four reactants, respectively. Therefore, the produced carbon dioxide has little influence on the electrical characteristics of gas flow during the reaction. But the dielectric constant of water (∼81) is larger than that of the reactants, air, and carbon dioxide. Thus the dielectric value of the gas flow varied significantly in the reactor. In addition, the stoichiometric yields of water and carbon dioxide of four oxygen-containing reactants during the plasma catalyses were same, except iso-pentane. Thus, the difference of electrical characteristics of the gas flow between the plasma catalysis of the three oxygen-containing reactants attributable to water and carbon dioxide were small.
Table 1 The three electrical properties of the four reactants, air, CO2 and H2O
| Compounds |
Dielectric constant |
Ionization potential (eV) |
Relative polarity |
| Ionization potential of air = ionization potential of N2 × 0.79 + ionization potential of O2 × 0.21. |
| 2-Butanol |
17.8 |
10.04 |
0.506 |
| Butanone |
18.5 |
9.54 |
0.327 |
| Ethyl acetate |
6.0 |
10.11 |
0.228 |
| Isopentane |
1.8 |
10.32 |
0.009 |
| Air |
1.0 |
14.95a |
Nonpolar |
| Carbon dioxide |
1.4 |
13.77 |
Nonpolar |
| Water |
∼81 |
12.62 |
10.2 |
Fig. 6 also shows the residual concentrations of ozone and nitrogen oxides produced by the four reactants over the La0.7Sr0.3MnO3/mullite catalyst at an SED of 3.32 kJ L−1 in the plasma-catalytic reactor. Only one organic by-product was found that come from PBP plasma catalysis of 2-butanol. The results of qualitative and quantitative analysis by gas chromatograph mass spectrometer show that this by-product is butanone. The curve of butanone yield versus temperatures shows in Fig. 7. 2-Butanol demonstrated the maximum yield of butanone at approximately 80 °C. Butanone achieved zero yield at T ≥ 120 °C, and the final product was CO2. The plasma catalysis of 2-butanol over the La0.7Sr0.3MnO3/mullite catalyst is complex. Generally, the O atom (or O3 molecule) can extract the two most weakly bound hydrogen atoms in the 2-butanol molecule to yield a water molecule. Thus, the following plasma-catalytic reforming reaction is possible:
| | |
CH3CH(OH)CH2CH3 + O (or O3) → CH3C(O)CH2CH3 + H2O (or H2O + O2)
| (2) |
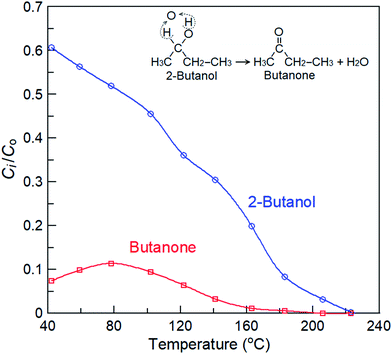 |
| | Fig. 7 The productive yield of 2-butanol in the plasma catalysis over La0.7Sr0.3MnO3/mullite catalyst, where Co is the concentration of 2-butanol feed and Ci is the concentration of product or reactant. | |
3.3 Effect of temperature on the intensity of plasma discharge
The pulsed bipolar plasma discharge is a no uniform discharge, particularly during DBD that comprises multiple moving and interacting microdischarges (Fig. 3). Therefore, the instantaneous intensity of plasma discharge varies slightly. However, the discharge characteristics of plasma do not change. Thus, the discharge characteristics of plasma can be observed by analyzing its emission spectra. Here, the intensity of the N I 336.62* peak was used as the representative intensity for the pulsed bipolar plasma discharge to identify the effect of temperature on plasma discharge, because its intensity was the highest (Fig. 4). Fig. 8 shows the relationship between the average intensity of N I 336.62* peak and temperatures of the four reactants at an applied SED of 3.32 kJ L−1. The intensity curves of N I 336.62* peak of the four reactants were all not smooth, but the intensities clearly increased as the temperature increased. The results demonstrated that the variation in the trends of plasma discharge with temperature for the four reactants was similar to the rising rates. Different functional groups did not cause significant effects.
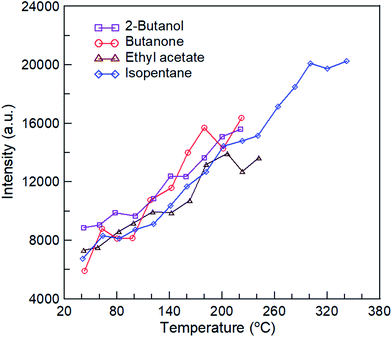 |
| | Fig. 8 The relationship between the average intensity of N I 336.62* peak and temperatures of four reactants at applied SED of 2.77 kJ L−1. | |
3.4 Conversion characteristics caused by plasma catalysis
Differences in oxygen-containing functional groups would affect the synergistic behavior of plasma catalysis. Thus, conversion characteristics caused by the plasma catalysis of various oxygen-containing functional groups were investigated in this study. The relative temperatures at different conversion rates of the four reactants were quantitatively analyzed using the following equation to describe the degree of synergy of plasma catalysis:| |
 | (3) |
where ΛX is the quantitative index of synergy at the conversion X; TX,pc and TX,c are the temperatures (K) of plasma catalysis and catalysis alone at the conversion X, respectively. Higher values of Λ indicate higher synergistic performance. Fig. 9 shows the plot of curves of the quantitative index of synergy versus conversion rates for the four reactants. The results demonstrated that the value of Λ increased rapidly at low conversion rates but increased slowly at high conversion rates. This may be due to the dominance of plasma dissociation in plasma catalysis at a low conversion rates and the dominance of catalysis dominant at high conversion. Butanone and 2-butanol showed similar quantitative index curves of synergy, which indicated similar effects of carbonyl and hydroxyl groups in plasma catalysis on conversion characteristics. Notably, the difference in conversion characteristics in plasma catalysis between carboalkoxy and methyl groups was relatively small. The values of Λ at X = 0.99 were observed to increase or decrease, which may be because of drastic variations in the reaction and/or reactant concentrations as X approached 1.
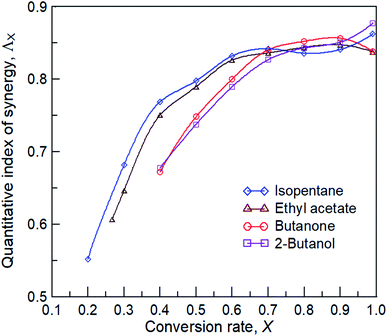 |
| | Fig. 9 The relationship between the quantitative index of synergy and conversion rate. | |
3.5 Kinetics of plasma-catalytic reactions
3.5.1. Catalysis alone. For catalysis alone, the reaction rate can be expressed as follows:| |
 | (4) |
where C and Co, respectively, are the concentrations of the reactants at time t = t and t = 0; k′ is the apparent rate constant. The expression of the conversion rate Xc is as follows:| |
 | (5) |
In which, k′ can be estimated using the Arrhenius law as follows:| |
 | (6) |
where Ea, R, T, and ko are the activation energy, gas constant, temperature, and pre-exponential factor of the reaction, respectively.By substituting eqn (6) in eqn (5), Xc is obtained as follows:
| | |
Xc = exp(−ae−b/T) or ln(1 − Xc) = −ae−b/T
| (7) |
where
a =
kot and
b =
Ea/
R. Rearranging and applying natural logarithm yields the following:
| |
 | (8) |
Fig. 10 displays the graphs of 1/T versus ln[−ln(1 − Xc)] obtained using eqn (8) with the data in Fig. 5; −b and ln![[thin space (1/6-em)]](https://www.rsc.org/images/entities/char_2009.gif) a represent the slope and intercept, respectively. The estimated ln
a represent the slope and intercept, respectively. The estimated ln![[thin space (1/6-em)]](https://www.rsc.org/images/entities/char_2009.gif) a, b, Ea, and R-squared (R2) values for the four reactants catalyses are also listed in Fig. 10. The activation energies (Ea = bR) of isopentane, 2-butanol, butanone, and ethyl acetate oxidations over the La0.7Sr0.3MnO3/mullite catalyst are 21.26, 12.91, 16.61, and 19.99 kcal mol−1, respectively. The activation energies of the four reactants varies in the following sequence: 2-butanol > butanone > ethyl acetate > isopentane, which is identical to the order of their catalytic reactivity (Fig. 5).
a, b, Ea, and R-squared (R2) values for the four reactants catalyses are also listed in Fig. 10. The activation energies (Ea = bR) of isopentane, 2-butanol, butanone, and ethyl acetate oxidations over the La0.7Sr0.3MnO3/mullite catalyst are 21.26, 12.91, 16.61, and 19.99 kcal mol−1, respectively. The activation energies of the four reactants varies in the following sequence: 2-butanol > butanone > ethyl acetate > isopentane, which is identical to the order of their catalytic reactivity (Fig. 5).
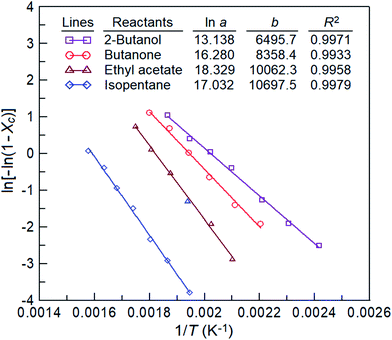 |
| | Fig. 10 Plot of ln[−ln(1 − Xc)] versus 1/T for the oxidation of four reactants over the La0.7Sr0.3MnO3 catalyst/mullite, from which their −b and ln![[thin space (1/6-em)]](https://www.rsc.org/images/entities/char_2009.gif) a values are obtained. a values are obtained. | |
3.5.2. Plasma catalysis. Plasma-catalytic reactions comprise plasma dissociation and synergistic catalysis. Thus, the overall plasma-catalytic reaction was construed as plasma dissociation and synergistic catalysis:| | |
roverall = rplasma dissociation + rsynergistic catalysis
| (9) |
Plasma dissociation is caused by discharge action on the reaction gas and produces various reactive species, such as excited atoms, ions, and molecules, and the strength depends on the applied SED and temperature. Synergistic catalysis is caused by the interaction of the catalytic reactions of reactive species and reactants that are beneficial to the oxidation of reactants. Eqn (9) can be expressed in terms of a differential rate formula as follows:
| |
 | (10) |
where
C is the organic reactant concentration;
kE is the rate constant of plasma dissociation (L kJ
−1), which is a function of SED and temperature; and
kSC is the apparent rate constant of synergistic catalysis (s
−1).
Eqn (10) can be integrated as
eqn (11):
| |
 | (11) |
The overall conversion rate XPC can be described as follows:
| |
 | (12) |
For plasma dissociation alone, the rate equation is as follows:
| |
 | (13) |
Integration gives the following result:
| |
 | (14) |
where subscript p indicates that the reaction only includes plasma dissociation, from which
kE can be expressed as follows:
| |
 | (15) |
Eqn (15) can be used to evaluate the value of kE when SED and Xp are given. Because Xp depends on the temperature, the above expression can also be described as a formula of function of SED and T:
| |
 | (16) |
where
α,
β, and
γ are the coefficients of multivariate equation. When SED is constant,
eqn (16) can be simplified to the following form:
| |
 | (17) |
Eqn (17) is an equation of a straight line of the graph of −ln(1 − Xp)/SED versus T with intercept α and slope β. Fig. 11 presents the plots of −ln(1 − Xp)/SED versus T for the plasma dissociation of the four reactants over the La0.7Sr0.3MnO3/mullite catalyst, from which α and β were obtained. Furthermore, eqn (17) satisfactorily fitted the experimental data at T ≤ 100 °C (R2 > 0.95). The coefficient β of the four reactants varied as follows: 2-butanol > butanone > ethyl acetate > isopentane, which was identical to the order of their catalytic reactivity and activation energies (Fig. 5 and 10). These results indicated that 2-butanol and isopentane had the highest and lowest thermal effects in plasma dissociation, respectively.
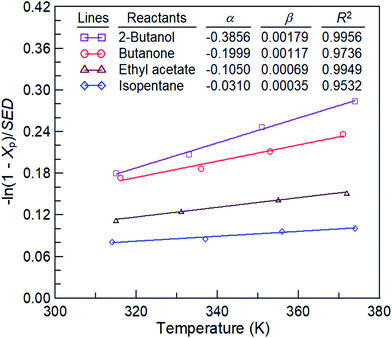 |
| | Fig. 11 Plot of apparent energy constants (kE = −ln(1 − Xp)/SED, L kJ−1) versus at T (K) for the plasma-catalysis reactions of four reactants over La0.7Sr0.3MnO3/mullite catalyst. | |
As noted previously, synergistic catalysis comprises catalysis and energy synergy. Thus, a synergy factor ΨX was used to evaluate the energy synergy effect as follows:
| |
 | (18) |
where
TX,exp and
TX,cal are the experimental temperature in the plasma catalysis and the calculated temperature in plasma-enhanced catalysis at the conversion
X of the reactant, respectively.
ΨX is a constant throughout the plasma-catalytic reaction, but the synergy factor is considered to be the ratio of both the temperatures at a conversion rate of 90% (
T90,exp and
T90,cal) because synergistic catalysis is more dominant than catalysis at a conversion rate of 90%. Thus,
eqn (6) can be rewritten as the following formula of
kSC in synergistic catalysis:
| |
 | (19) |
Table 2 shows the synergy factor values of the four reactants at an applied SED of 3.32 kJ L−1. The results showed that the order of synergy factor values of the four reactants was as follows: ethyl acetate > isopentane > butanone > 2-butanol.
Table 2 Summary of the synergy factor Ψ90,T for the plasma-catalysis reactions of the four reactants over La0.7Sr0.3MnO3/mullite catalyst
| Reactants |
2-Butanol |
Butanone |
Ethyl acetate |
Isopentane |
| Ψ90,T |
1.100 |
1.126 |
1.158 |
1.138 |
By substituting eqn (17) and (19) into eqn (12), the following equation is obtained:
| |
 | (20) |
Eqn (20) is a theoretical equation that involves the obtained kinetic parameters that can be used to predict the conversion rate XPC for the plasma catalysis of organic reactants at different applied SEDs and reaction temperatures (T values).
3.6 Comparison of the theoretical and experimental results
Fig. 12 displays the theoretical and experimental results of the four reactants over the La0.7Sr0.3MnO3/mullite catalyst in the PBP plasma catalysis at an applied SED of 3.32 kJ L−1. The results showed that the relative error between the theoretical and experimental results was extremely low for the three oxygenated compounds. Some slight error was observed for isopentane at temperatures between 140 °C and 220 °C. Because the catalysis of isopentane at temperatures below 220 °C was negligible (Fig. 5), this error may have been due to complex plasma dissociation before the catalysis action. The mean absolute normalized gross errors of 2-butanol, butanone, ethyl acetate, and isopentane were 2.10%, 1.93%, 1.79%, and 7.29%, respectively. A summary of the results indicated that this theoretical equation can be used to explain the behavior of plasma dissociation and synergistic catalysis in plasma catalysis. In addition, the theoretical equation accurately predicted the conversion–temperature curves.
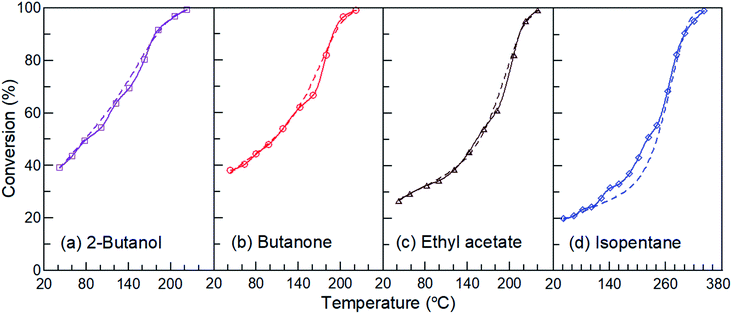 |
| | Fig. 12 Comparison of the conversion–temperature curves between theoretical and experimental results of the four reactants over the La0.7Sr0.3MnO3/mullite catalyst in the plasma-catalytic reactions at applied SED of 2.77 kJ L−1. Dashed and solid lines are the theoretical and experimental results, respectively. | |
4. Conclusions
Oxygenated organic compounds, such as alcohols, esters, and carbonyls, are widely used as solvents, raw materials, or fuel additives, particularly 2-butanol, butanone, and ethyl acetate. This study investigated the synergistic effects of structure and activity on the three oxygenated reactants in a pulsed bipolar plasma-catalytic reaction conducted using prepared La0.7Sr0.3MnO3/mullite as the catalyst and isopentane as the control compound. The waveforms of applied voltage and plasma current revealed that plasma discharge was composed of DBD with an instantaneous sharp discharge and continuous SD. Additionally, a weak third harmonic was observed when the power supply was turned off in each half cycle. The results indicated that the relative polarity of an oxygenated reactant was a more crucial factor in plasma catalysis than its dielectric constant and ionization potential. However, the order of synergy factor values of the reactants was opposite to that of relative polarities. The variation in the quantitative index of synergy demonstrated that plasma dissociation was dominant at low conversion rates and catalysis was dominant at high conversion rates in the plasma-catalytic reaction. The oxygenated organic compounds were clearly more susceptible to catalysis alone and plasma catalysis than the control compound. A theoretical formula with the synergy factor of plasma catalysis was established, and plasma catalysis comprised plasma dissociation and synergistic catalysis. This theoretical formula was proven to be accurate by comparing experimental and theoretical results and was used successfully to predict the conversion–temperature curve of plasma catalysis.
Conflicts of interest
There are no conflicts to declare.
Acknowledgements
The authors would like to thank the Ministry of Science and Technology of the Republic of China, Taiwan, for financially supporting this research under Contract No. MOST 104-2218-E-035-008, MOST 105-2221-E-035-025, MOST 106-2221-E-035-043, and MOST 108-2221-E-035-045-MY3.
References
- P. Pepiot-Desjardins, H. Pitsch, R. Malhotra, S. R. Kirbyc and A. L. Boehman, Structural group analysis for soot reduction tendency of oxygenated fuels, Combust. Flame, 2008, 154, 191–205 CrossRef CAS.
- E. Koivisto, N. Ladommatos and M. Gold, The influence of various oxygenated functional groups in carbonyl and ether compounds on compression ignition and exhaust gas emissions, Fuel, 2015, 159, 697–711 CrossRef CAS.
- Y. Qin, X. Liu, T. Zhu and T. Zhu, Catalytic oxidation of ethyl acetate over silver catalysts supported on CeO2 with different morphologies, Mater. Chem. Phys., 2019, 229, 32–38 CrossRef CAS.
- R. Magnusson and C. Nilsson, The influence of oxygenated fuels on emissions of aldehydes and ketones from a two-stroke spark ignition engine, Fuel, 2011, 90, 1145–1154 CrossRef CAS.
- C. Fan, C. Song, G. Lv, G. Wang, H. Zhou and X. Jing, Evaluation of carbonyl compound emissions from a non-road machinery diesel engine fueled with a methanol-diesel blend, Appl. Therm. Eng., 2018, 129, 1382–1391 CrossRef CAS.
- E. C. Neyts, K. Ostrikov, M. K. Sunkara and A. Bogaerts, Plasma catalysis: Synergistic effects at the nanoscale, Chem. Rev., 2015, 115, 13408–13446 CrossRef CAS PubMed.
- H.-H. Kim, Nonthermal plasma processing for air-pollution control: A historical review, current issues, and future prospects, Plasma Processes Polym., 2004, 1, 91–110 CrossRef CAS.
- D. Yuan, S. Tang, J. Qi, N. Li, J. Gu and H. Huang, Comparison of hydroxyl radicals generation during granular activated carbon regeneration in DBD reactor driven by bipolar pulse power and alternating current power, Vacuum, 2017, 143, 87–94 CrossRef CAS.
- H. T. Q. An, T. P. Huu, T. L. Van, J. M. Cormier and A. Khace, Application of atmospheric non thermal plasma-catalysis hybrid system for air pollution control: Toluene removal, Catal. Today, 2011, 176, 474–477 CrossRef.
- Z. Jia, M. B. Amar, D. Yang, O. Brinza, A. Kanaev, X. Duten and A. Vega-Gonzáleza, Plasma catalysis application of gold nanoparticles for acetaldehyde Decomposition, Chem. Eng. J., 2018, 347, 913–922 CrossRef CAS.
- A. M. Harling, V. Demidyuk, S. J. Fischer and J. C. Whitehead, Plasma-catalysis destruction of aromatics for environmental clean-up: Effect of temperature and configuration, Appl. Catal., B, 2008, 82, 180–189 CrossRef CAS.
- S. Zhang, X. Shen and J. Liang, Atmospheric pressure oxidation of dilute xylene using plasma-assisted MnOx catalysis system with different precursors, Mol. Catal., 2019, 467, 87–94 CrossRef CAS.
- X. Zhu, X. Gao, X. Yu, C. H. Zheng and X. Tu, Catalyst screening for acetone removal in a single-stage plasma-catalysis system, Catal. Today, 2015, 256, 108–114 CrossRef CAS.
- Y. Li, Z. Fan, J. Shi, Z. Liu and W. Shangguan, Post plasma-catalysis for VOCs degradation over different phase structure MnO2 catalysts, Chem. Eng. J., 2014, 241, 251–258 CrossRef CAS.
- C. Qin, X. Dang, J. Huang, J. Teng and X. Huang, Plasma-catalytic oxidation of adsorbed toluene on Ag–Mn/γ-Al2O3: Comparison of gas flow-through and gas circulation treatment, Chem. Eng. J., 2016, 299, 85–92 CrossRef CAS.
- X. Zhu, X. Gao, R. Qin, Y. Zeng, R. Qu and C. Zheng, Xin Tu, Plasma-catalytic removal of formaldehyde over Cu–Ce catalysts in a dielectric barrier discharge reactor, Appl. Catal., B, 2015, 170–171, 293–300 CrossRef CAS.
- X. Zhu, S. Liu, Y. Cai, X. Gao, J. Zhou, C. Zheng and X. Tu, Post-plasma catalytic removal of methanol over Mn–Ce catalysts in an atmospheric dielectric barrier discharge, Appl. Catal., B, 2016, 183, 124–132 CrossRef CAS.
- K. L. Pan, D. L. Chen, G. T. Pan, S. Chong and M. B. Chang, Removal of phenol from gas streams via combined plasma catalysis, J. Ind. Eng. Chem., 2017, 52, 108–120 CrossRef CAS.
- K. Xuan, X. Zhu, Y. Cai and X. Tu, Plasma oxidation of H2S over non-stoichiometric LaxMnO3 perovskite catalysts in a dielectric barrier discharge reactor, Catalysts, 2018, 8(8), 317 CrossRef.
- N. A. Merino, B. P. Barbero, P. Grange and L. E. Cadus, LaCaCoO perovskite-type oxides: preparation, characterisation, stability, and catalytic potentiality for the total oxidation of propane, J. Catal., 2005, 231, 232–244 CrossRef CAS.
- C. Li, K. C. K. Soh and P. Wu, Formability of ABO3 perovskites, J. Alloys Compd., 2004, 372, 40–48 CrossRef CAS.
- A. Ogata, D. Ito, K. Mizuno, S. Kushiyama and T. Yamamoto, Removal of dilute benzene using a zeolite-hybrid plasma reactor, IEEE Trans. Ind. Appl., 2001, 37, 959–964 CrossRef CAS.
- A. Ogata, N. Shintani, K. Mizuno, S. Kushiyama and T. Yamamoto, Decomposition of benzene using a nonthermal plasma reactor packed with ferroelectric pellets, IEEE Trans. Ind. Appl., 1999, 35, 753–759 CrossRef CAS.
- J. J. Liang and C. K. Nien, Preparation and catalytic properties of La–Sr–Mn mixed metal oxides with various lattice oxygen amounts, J. Environ. Manage., 2008, 18, 377–385 CAS.
- C. J. Liang and J. W. Fang, Predicting the kinetics of catalytic oxidation of multicomponent organic waste gases, Chem. Eng. Sci., 2016, 144, 101–107 CrossRef CAS.
- J. C. Whitehead, Plasma–catalysis: the known knowns, the known unknowns and the unknown unknowns, J. Phys. D: Appl. Phys., 2016, 49, 243001 CrossRef.
- J. C. Whitehead, Plasma-catalysis: Is it just a question of scale?, Front. Chem. Sci. Eng., 2019, 13(2), 264–273 CrossRef.
- C. J. Liang and K. W. Li, Kinetic characterization of plasma-enhanced catalysis of high-concentration volatile organic compounds over mullite supported perovskite catalysts, J. Electrost., 2018, 96, 134–143 CrossRef CAS.
|
| This journal is © The Royal Society of Chemistry 2020 |
Click here to see how this site uses Cookies. View our privacy policy here.  Open Access Article
 *a and
Zong-Yi Leeb
![[thin space (1/6-em)]](https://www.rsc.org/images/entities/char_2009.gif) 000),22,23 ferroelectricity, and catalytic ability.24,25 Thus, mullite-supported La0.7Sr0.3MnO3 perovskite oxide was selected as the catalyst in this study.
000),22,23 ferroelectricity, and catalytic ability.24,25 Thus, mullite-supported La0.7Sr0.3MnO3 perovskite oxide was selected as the catalyst in this study.

![[thin space (1/6-em)]](https://www.rsc.org/images/entities/char_2009.gif) 378 mL h−1 g−1 of catalyst). The frequency of 12.5 kHz was selected because it has optimal energy consumption,28 which had a bipolar cycle of 80 μs. The in situ optical emission spectra of the element and species products were determined using an optical emission spectrometer (AvaSpec-USB2, Avantes) by using an optical fiber cable connected to an optical quartz window on the top of the reactor.
378 mL h−1 g−1 of catalyst). The frequency of 12.5 kHz was selected because it has optimal energy consumption,28 which had a bipolar cycle of 80 μs. The in situ optical emission spectra of the element and species products were determined using an optical emission spectrometer (AvaSpec-USB2, Avantes) by using an optical fiber cable connected to an optical quartz window on the top of the reactor.


![[thin space (1/6-em)]](https://www.rsc.org/images/entities/char_2009.gif) a represent the slope and intercept, respectively. The estimated ln
a represent the slope and intercept, respectively. The estimated ln![[thin space (1/6-em)]](https://www.rsc.org/images/entities/char_2009.gif) a, b, Ea, and R-squared (R2) values for the four reactants catalyses are also listed in Fig. 10. The activation energies (Ea = bR) of isopentane, 2-butanol, butanone, and ethyl acetate oxidations over the La0.7Sr0.3MnO3/mullite catalyst are 21.26, 12.91, 16.61, and 19.99 kcal mol−1, respectively. The activation energies of the four reactants varies in the following sequence: 2-butanol > butanone > ethyl acetate > isopentane, which is identical to the order of their catalytic reactivity (Fig. 5).
a, b, Ea, and R-squared (R2) values for the four reactants catalyses are also listed in Fig. 10. The activation energies (Ea = bR) of isopentane, 2-butanol, butanone, and ethyl acetate oxidations over the La0.7Sr0.3MnO3/mullite catalyst are 21.26, 12.91, 16.61, and 19.99 kcal mol−1, respectively. The activation energies of the four reactants varies in the following sequence: 2-butanol > butanone > ethyl acetate > isopentane, which is identical to the order of their catalytic reactivity (Fig. 5).


