 Open Access Article
Exploring the binding mode and thermodynamics of inverse agonists against estrogen-related receptor alpha†
Konda Reddy Karnati a,
Yixuan Wang
 *a and
Yongli Dub
aDepartment of Chemistry and Forensic Science, Albany State University, Albany, GA 31705, USA. E-mail: yixuan.wang@asurams.edu
bSchool of Chemical and Pharmaceutical Engineering, Qilu University of Technology (Shandong Academy of Sciences), Jinan, Shandong 250353, China
First published on 28th April 2020
Abstract
Since estrogen-related receptor alpha (ERRα), one of three estrogen-related receptors, displays constitutively active transcriptional activities and important implications in both physiological and pathological processes of breast cancers, ERRα was recently recognized as a new target to fight breast cancers, and regulating the activity of ERRα with inverse agonists has thus become a promising new therapeutic strategy. A few inverse agonists cyclohexylmethyl-(1-p-tolyl-1H-indol-3-ylmethyl)-amine (compound 1), thiadiazoacrylamide (XCT790), and 1-(2,5-diethoxy-benzyl)-3-phenyl-area analogues (compounds 2 and 3) were reported to be capable of targeting ERRα. However, the detailed mechanism by which the inverse agonists deactivate ERRα remains unclear, especially in the aspects of quantitative binding and hot spot residues. Therefore, to gain insights into the interaction modes between inverse agonists and ERRα ligand binding domain, all-atom molecular dynamics (MD) simulations were firstly carried out for the complexes of inverse agonists and ERRα. The binding free energies were then calculated with MM-PBSA method to quantitatively discuss the binding of the inverse agonists with ERRα. The binding affinities were finally decomposed to per-residue contributions to identify the hot spot residues as well as assess their role in the binding mechanism. MD simulations show that the inverse agonists stretch downwards into the ERRα ligand binding pocket (LBP) formed by H3 and H11 helices, and upon the binding H12 adopts a well-defined position in the coactivator groove, where PGC-1α binds to ERRα. Binding energy analysis indicates that compound 3 and XCT790 bind more tightly to ERRα than compounds 1 and 2, and the energy difference mainly results from the contribution of van der Waals interaction. Both binding mode analysis and affinity decomposition per-residue indicate that compound 1, XCT790, and compound 3 have similar binding spectra to ERRα, primarily interacting with the residues of H3, H5, H6/H7 loop, and H11 helix, while compound 2 lacks a significant interaction with the H5 region. The hot spot residues significantly binding to the three inverse agonists in common include Leu324, Phe328, Phe382, Leu398, Phe495, and Leu500. It is essential for an effective inverse agonist to strongly bind with the aromatic ring cluster consisting of Phe328(H3), Phe495(H11), and Phe382(H5/H6 loop) as well as Leu500.
1. Introduction
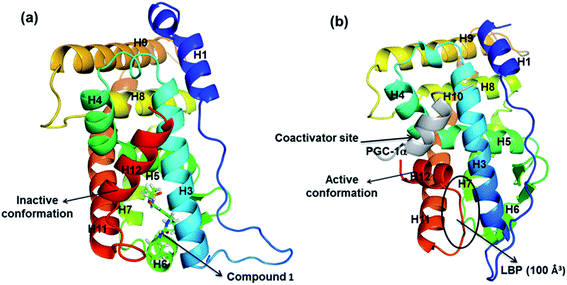
Estrogen-related receptor α (ERRα) is one of three nuclear hormone receptors, ERRα, ERRβ, and ERRγ.1,2 It shares high homology to estrogen receptor α (ERα) at the DNA-binding domain, and recognizes ERRα response elements (5′TNAAGGTCA3′), and modulates the action of ERα.3,4 Unlike ERs, ERRs are not activated by known natural estrogens, and are therefore classified as orphan receptors.5,6 The activity of ERRα is primarily controlled by its level of expression and interaction with coactivators; in particular, its most common interaction is with the peroxisome proliferator-activated receptor γ coactivator 1α (PGC-1α).7,8 The PGC-1α/ERRα axis has thus been implicated in controlling the expression of metabolic gene networks and mitochondrial biogenesis.9–11 ERRα is expressed in a wide variety of tissues and its high expression correlates with poor prognosis in breast, colon, and ovarian cancers.12 Importantly, over-expression of ERRα is linked to poor clinical outcome for breast cancer.6 Therefore, regulating the activity of ERRα with inverse agonists has been considered as a promising new therapeutic strategy for the treatment of breast cancer, particularly triple negative breast cancer (TNBC).Crystal structure of ERRα shows that it exhibits a canonical three layered “α helical sandwich” fold composed of 12 α-helices (H1–H12) and two β-sheets. As shown in Fig. 1, the complex of ERRα with the inverse agonist compound 1 (inactive conformation, Fig. 1a) and ERRα bound with PGC-1α (active apo conformation, Fig. 1b) reveal a conserved structure in the binding site region.13,14 Nevertheless, significant divergences in both H3 and H12 were observed. H12 is quite flexible, and upon activation H12 binds with coactivator normally. However, in the presence of the inverse agonist, a major conformational change takes place in the LBP where H12 is displaced to cap the ligand binding site, so the PGC-1α is not able to combine with ERRα any more since the binding position is occupied by H12.
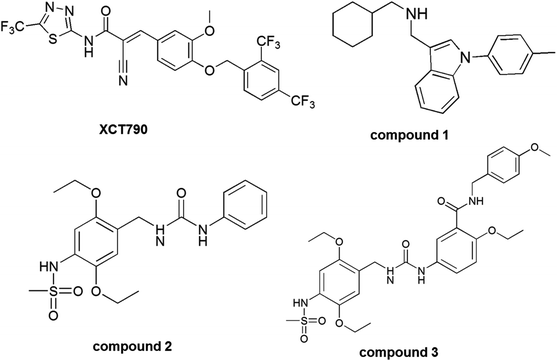
Several classes of ERRα inverse agonists have been reported to inhibit tumor development and progression probably by disrupting the interaction of ERRα with their coactivators.15–19 Among them, thiadiazoleacrylamide (XCT790) is the most potent and selective inhibitor of ERRα, and compound 1, cyclohexylmethyl-(1-p-tolyl-1H-indol-3-ylmethyl)-amine was the most investigated inverse agonist. X-ray crystallographic study demonstrated the interaction of compound 1 with the ligand binding pocket of ERRα.4,17 Recently, a novel class of ERRα inverse agonists, 1-(2,5-diethoxy-benzyl)-3-phenyl-area analogues (compounds 2 and 3) were reported through structural optimization and ERRα in vitro and in vivo assays. Compound 3 shows strong inhibitory effects on the transcriptional activity of ERRα and could be a potent ERRα inverse agonist for the treatment of breast cancer.20 Structures of XCT790 and other inverse agonists, compounds 1, 2, and 3 were shown in Fig. 2.
The crystal structures of XCT790/ERRα, compounds 2 and 3/ERRα complexes have not been reported yet, which lags the understanding the mechanism by which the efficient inverse agonists deactivate ERRα, e.g., the binding modes of the inverse agonists with the residues of ERRα, and hot spot residues that play significant role in the binding, etc. To fill the gap and provide a good understanding about the binding mechanism of the inverse agonists and ERRα, in the present work all atom molecular dynamics (MD) simulation, and free energy calculations with MM-PBSA, which are efficient tools to investigate thermodynamic properties of proteins and protein–inhibitor interactions,21,22 will be performed for the complexes consisting of inverse agonists (XCT790 and compounds 1–3) and ERRα. The stable trajectories from MD simulations will provide detailed binding modes information on the specificity and selectivity of inverse agonists in the LBP of ERRα. The total binding affinity will allow us to compare the binding strength of the inverse agonists with ERRα, and analyze the contribution of different free energy components. Furthermore, per-residue basis decomposition of binding affinity was finally performed using MM-GBSA in order to quantitatively identify hot spot residues that play important roles in the binding. This study was expected to provide significant molecular and dynamic information for the design of inverse agonists that can block the ERRα interaction with coactivator PGC-1α.
2. Materials and methods
2.1 Loop modeling
The ERRα structure from the crystal structure of ERRα complexed with compound 1 (PDB ID: 2PJL) is incomplete with a few missing amino acid residues in the ranges of 309 to 317 (PDPAGPDGH) and 462 to 470 (RAGPGGGAE). A complete structure of protein is essential for accurate MD simulation studies; therefore, the missing loops in protein structure were built using ModLoop in modeling software.23,242.2 Molecular docking
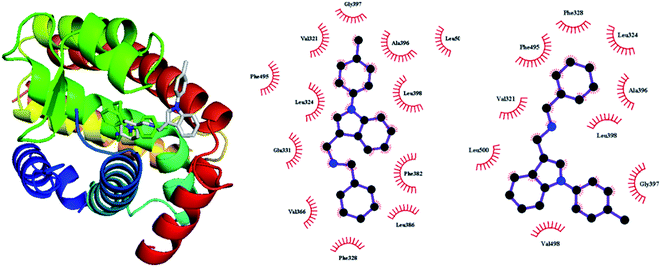
Autodock Vina was reported to have good performance on predicting binding pose and affinity,25 thus it was then used for performing docking on the basis of the above complete ERRα, and AutoDockTools software was employed to prepare and analyze the docking results.26 Molecular structure of XCT790, compounds 2 and 3 were optimized with HF/6-31G* in Gaussian 09 package.27 Kollman charges, solvation parameters and polar hydrogens were added to the protein structure, and Gasteiger charge was assigned to the ligands using standard docking protocol. In docking calculations, the protein–ligand poses were ranked using an energy based scoring function. After all outputs were clustered based on the root mean squared deviation (RMSD) values, the top pose conformation of docked ligand with the lowest energy is saved. For compounds 2 and 3 we have considered two binding conformations, the sulfonamide group projecting in and out of the LBP. In total, we have collected five docking complexes ERRα–XCT790, ERRα–compound 2(a) and ERRα–compound 3(a) where sulfonamide projected in the LBP, and ERRα–compound 2(b) and ERRα–compound 3(b) where sulfonamide projected out of the LBP.To assess the reliability of Autodock Vina for the current systems, compound 1 was docked to the ERR-alpha of 2PJL. As shown in Fig. 3, the binding pose deviates from the crystal structure to some degree, yet the primary binding residues such as Val321, Leu324, Phe328, Phe382, Ala396, Gly397, Phe495, and Leu500 appear in the hydrophobic contact region. The deviation may be also partially resulted from missing solvent molecules. To achieve more reliable binding mode, it is necessary to preform MD in explicit solvent media.
2.3 MD simulations
All MD simulations were carried out using AMBER16 package28 with AMBERff14SB29 and general amber force field (GAFF)30 for protein and ligand molecules, respectively. In total, we have done MD simulations for seven structures: apo ERRα, ERRα–XCT790, ERRα–compound 1, ERRα–compound 2(a), ERRα–compound 2(b), ERRα–compound 3(a) and ERRα–compound 3(b). All systems were hydrated in octahedral box extending 12 Å outside the protein on all sides with explicit water molecules. Three-site TIP3P model was chosen to describe water molecules.31 For charge neutralization, the proper number of Na+ ions were placed randomly in the simulation box.All prepared systems were minimized in two steps: water molecules were firstly minimized keeping force constants over protein–ligand complexes, followed by minimization of the entire system in the second step. The first 1000 steps of energy minimization were run with steepest descent method and remaining 2000 steps with conjugate gradient method. Particle Mesh Ewald (PME) summation was used to handle the long-range coulombic interactions with a cutoff of 10 Å. Minimized systems were then slowly heated to bring system's temperature from 0 K to 310 K in NVT ensemble with time step of 0.002 fs. Systems were then equilibrated until pressure and density of systems were stabilized in NPT ensemble. For equilibration and subsequent steps, Berendsen thermostat was used in the isothermal isobaric (NPT) ensemble with target pressure of 1 bar and pressure coupling constant of 2 ps. Final production MD simulations were performed for 500 ns under NPT conditions using the GPU-supported pmemd MD module.32–34 All of the bonds involving hydrogen atoms were constrained using the SHAKE algorithm. For temperature scaling, langevin dynamics was used with a collision frequency of 2 ps.
2.4 Binding free energy calculation
The binding free energy of protein–ligand complexes were evaluated using MM/PBSA (Molecular Mechanics/Poisson-Boltzmann Surface Area) program in AMBER16. For each complex, a total of 50 snapshots were extracted along MD trajectory from the last 100 ns MD simulations with an interval of 200 ps. The binding energy (ΔG) in condensed phase can be simply defined by the following equations.35,36| ΔG = ΔH − TΔS | (1) |
| ΔH = ΔEMM + ΔGsol | (2) |
| ΔEMM = ΔEvdw + ΔEele | (3) |
| ΔGsol = ΔGpol + ΔGnonpol | (4) |
| ΔGnonpol = γ(SAS) + β | (5) |
2.5 Per-residue free energy decomposition analysis
To identify the key residues responsible for the binding process, free-energy decomposition into the contribution of each residue was performed. On account of the huge demand of computational resources for PB calculations, the interaction between inverse agonists and ERRα residues was computed using the MM-GBSA decomposition process applied in the mm_pbsa module in AMBER16.2.6 Clustering analysis
The clustering of trajectories was performed using cpptraj module in AMBER16. The clustering was done with minimum number of points and an epsilon value of 4.0 and taking first frame as a reference. The cluster-to-cluster distance was defined as the average of all distances between individual points of two clusters according to the so-called average-linkage algorithm, which is one of the best clustering methods.37 In total, we have generated 10 clusters and considered the closest cluster conformation with reference structure.3. Results and discussion
3.1 MD trajectory and binding mode
For ERRα it was difficult to predict the exact details of how the inverse agonist would bind in the LBP because of the multiple conformational changes required to create the necessary space and interactions. Similarly, it was not clear what exact consequences ligand binding would have on H12, except that it would probably be displaced from the inverse agonist position.4 To elucidate the underlying molecular mechanism and conformational changes in ERRα in the presence of the inverse agonists in more detail, all atom MD simulations were performed. MD simulations have been shown to be useful for assessing the binding modes observed in molecular docking calculations. The overall structural stability of ERRα was evaluated by RMSD of the backbone atoms. The result of RMSD obtained by MD simulations proves the stability of all complexes during the simulation and validity of docking results. Fig. 4 shows the RMSDs for the backbone atoms of the protein during MD simulation relative to the initial minimized structure. An analysis of the RMSD indicates that all complexes tend to converge after 35–40 ns, suggesting that the systems became sufficiently stable through 500 ns MD simulations. The root-mean-square fluctuations (RMSF) of residues of ERRα–inverse agonist complexes were shown in Fig. S1.† Analyzing RMSF plots, similarly to the loop regions of regular proteins the modeled H2–H3 and H10–H11 loops in ERRα also show larger fluctuations than other regions. Apart from these two modeled loops, very minor fluctuations were observed in apo and complexed proteins. H11–H12 loop is more stable in complexes 3(b) and XCT790 compared with apo and other complexed proteins. Interestingly, helix H12 is unstable in ERRα when complexed with compound 3(b), implicating that compound 3 strongly binds to H11–H12 loop and shifts the H12 loop to the region where PGC-1α bound to ERRα.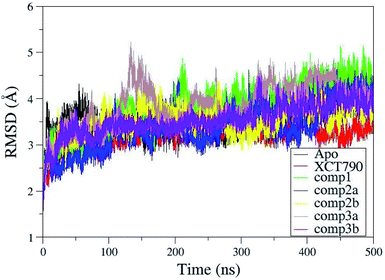 | ||
| Fig. 4 Root-mean-square deviation (RMSD) plot for backbone atoms of ERRα and inhibitor complexes relative to their initial minimized structure as a function of time. | ||
The detailed binding of inverse agonists to ERRα was analyzed for the most populated cluster of each complex in 2-dimensional as well as 3-dimensional modes. 2-dimensional modes from Ligplot in ESI (Fig. S2 and S4†) show available hydrophobic contacts and hydrogen bonds of the inverse agonists with ERRα.The following 3-dimensional modes were generated with Pymol by displaying the residues 4.0 Å around the inverse agonists. Significant disruptions were revealed in protein–ligand contacts from their initial docking poses. Analyzing the top cluster of each ERRα–inverse agonist complex, it shows that ligand binding pocket is primarily delineated (cutoff 4.0 Å) by the residues from H3, H11, H5/H6 loop and H6/H7 loop.
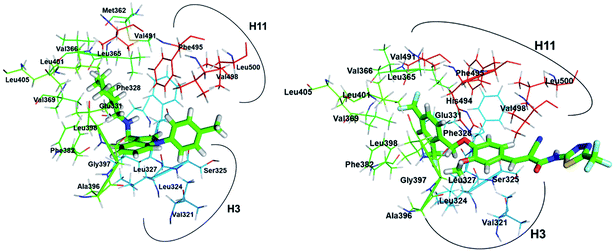
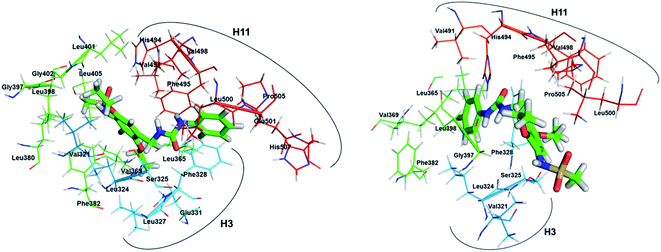
The binding modes of inverse agonist compound 1 in the LBP of ERRα are shown in Fig. 5a. The LBP of ERRα consists of 20 residues, most of which have hydrophobic side chains and come from H3 (Val321, Leu324, Ser325, Leu327, Phe328, Glu331), H5 (Met362, Leu365, Val366, Val369), the β-sheet (Phe382), H6 (Ala396), the H6/H7 loop (Gly397, Leu398), H7 (Leu401, Leu405), H11 (Val491, Phe495, Val498), and H11/H12 loop (Leu500). Apart from Ser325 and Gly397, the rest of the residues were also predicted by the X-ray crystal structure for the ERRα complex with inverse agonist compound 1.4 The good agreement indicates that the current all-atom MD simulation is able to provide reasonable prediction for the binding of ERRα with relevant ligands. 2-D plot in Fig. S2(b)† shows strong hydrophobic interaction with six residues, Val321, Leu324, Phe328, Val369, Ala396, and Phe495.
It is reported that inhibition of ERRα by its inverse agonist XCT-790 can suppress the proliferation, decrease G2/M phases, and induce mitochondrial-related apoptosis of TNBC cells,38 and was considered as the most potent one so far. Fig. 5b shows that in the LBP of ERRα XCT790 also primarily interacts with 20 amino acids from H3, H5, H6 and H11 regions, of which 19 are in common with those in the presence of compound 1 as discussed above.
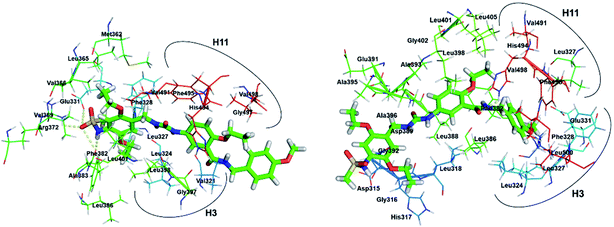
The experimental study performed by Du et al., showed that compound 3 demonstrates strong inhibitory effects on the transcriptional activity of ERRα in human MDA-MB-231 cells in a dose dependent manner and the growth of ER-negative MDA-MB-231 human breast cancer xenografts in vivo.20 For the sake of comparison the binding of compound 2 with ERRα was also illustrated. Three more residues exist in conformation 2a (Fig. 6) than above discussed compound 1 and XCT790, and phenyl group in the end of compound 2 interacts with more residues from H11 and H12. However, for conformation 2b only 15 residues were located in the LBP of EERα. Comparing the binding modes of 2a and 2b, it shows common hydrophobic contacts with residues Leu324, Ser325, Phe328, Val491, and Leu500 (Fig. S3†). For conformations 3a and 3b (Fig. 7) up to twenty-seven residues were observed in the LBP. The complementarity of fit in the hydrophobic regions is good in both conformations, and its interaction is likely to contribute substantially to the binding affinity. The sulfonamide group in 3a forms a hydrogen bond interaction with carboxyl group of Glu331 of ERRα that corresponds to Glu353 of ERα, and NH group forms hydrogen bond with Phe382 (β sheet).
3.2 Binding free energy between ERRα and the inverse agonists
Binding free energy calculation on the basis of stable MD simulation trajectory is the most accurate strategy to substantiate binding of compounds with favorable thermodynamics. The final 100 ns (400–500 ns) of each MD trajectory was used to perform MM/PBSA binding free energy calculations, and results were reported in Table 1 and shown in Fig. 8. In general, van der Waals term (ΔEvdw) is more favorable to the ligand binding than the electrostatic interactions (ΔEele), and nonpolar solvation energy (ΔGnonpol) contributes to binding affinity by −4 to −6 kcal mol−1. For the investigated inverse agonists, compound 3 (in conformations 3a and 3b) has the strongest van der Waals binding (−64.0 and −60.5 kcal mol−1) followed by XCT790 (−56.3 kcal mol−1); and van der Waals interaction for compound 1 (ΔEvdw: −45.8 kcal mol−1) is further weaker, yet compound 2 is the least one (∼−41.0 kcal mol−1 in 2a and 2b conformations). The sequence of van der Waals strength for the binding of ERRα with the inverse agonists is roughly in line with the number of residues in the LBP analyzed above for the complexes. The binding enthalpy (ΔH = ΔEvdw + ΔGele + ΔGpol + ΔGnonpol), a summation of ΔEvdw, ΔEele, and ΔGnonpol with counter contribution polar solvation energy (ΔGpol), has a similar trend to van der Waals term (−40.0 kcal mol−1 for compound 3, −36.4 kcal mol−1 for XCT790, −30.0 kcal mol−1 for compound 2, and only −22.3 kcal mol−1 for compound 1).| Componenta | XCT790 | Comp. 1 | Comp. 2a | Comp. 2b | Comp. 3a | Comp. 3b |
|---|---|---|---|---|---|---|
a Component: ΔEvdw is the van der Waals free energy; ΔEele is the electrostatic free energy; ΔGpol is the polar solvation energy; ΔGnonpol is the nonpolar solvation energy; ΔH = ΔEvdw + ΔEele + ΔGpol + ΔGnonpol; −TΔS is the entropic contribution.; ΔHPB(ΔGPB) and ΔHGB(ΔGGB) were obtained from MM-GPBSA and MM-GBSA, respectively.b  . . |
||||||
| MM-PBSA | ||||||
| ΔEvdw | −56.3 (3.1) | −45.8 (3.2) | −40.6 (4.1) | −41.0 (5.7) | −64.0 (5.1) | −60.5 (4.3) |
| ΔEele | −15.7 (6.2) | −18.3 (9.4) | −14.6 (8.6) | −11.1 (7.7) | −27.9 (8.9) | −12.2 (7.2) |
| ΔGpol | 40.7 (4.8) | 46.5 (8.4) | 28.9 (7.4) | 30.1 (8.0) | 59.0 (8.0) | 38.8 (6.6) |
| ΔGnonpol | −5.2 (0.3) | −4.7 (0.1) | −3.9 (0.2) | −4.3 (0.5) | −6.3 (0.3) | −6.0 (0.4) |
| ΔHPB | −36.4 (3.6) | −22.3 (4.1) | −30.2 (4.5) | −26.3 (5.0) | −39.2 (5.7) | −39.9 (4.9) |
| −TΔS | 25.5 (4.1) | 25.7 (4.9) | 23.3 (4.2) | 21.6 (4.4) | 31.6 (5.8) | 27.1 (5.6) |
| ΔGPB | −10.9 (5.5) | 3.4 (6.4) | −6.9 (6.2) | −4.7 (6.7) | −7.6 (8.1) | −12.8 (7.4) |
![[thin space (1/6-em)]](https://www.rsc.org/images/entities/char_2009.gif) |
||||||
| MM-GBSA | ||||||
| ΔGpol | 36.4 (5.5) | 43.1 (8.5) | 25.7 (7.1) | 27.0 (7.2) | 48.0 (7.1) | 32.3 (5.8) |
| ΔGnonpol | −8.1 (0.3) | −6.0 (0.3) | −5.2 (0.4) | −5.7 (0.7) | −9.0 (0.5) | −7.8 (0.5) |
| ΔHGB | −43.6 (3.1) | −26.9 (4.6) | −34.8 (5.0) | −30.8 (5.5) | −52.9 (6.1) | −48.2(4.8) |
| −TΔS | 25.5 (4.1) | 25.7 (4.9) | 23.3 (4.2) | 21.6 (4.4) | 31.6 (5.8) | 27.1 (5.6) |
| ΔGGB | −18.1 (5.1) | −1.2 (6.7) | −11.5 (6.5) | −9.2 (7.0) | −21.3 (6.3) | −21.1 (7.4) |
| ΔGb | −9.1, −9.0 | −9.5 | −6.4 | −7.9 | ||
| IC50/μM | 0.37,17 0.45 (ref. 20) | 0.19 (ref. 4) | 21.1 (ref. 20) | 1.90 (ref. 20) | ||
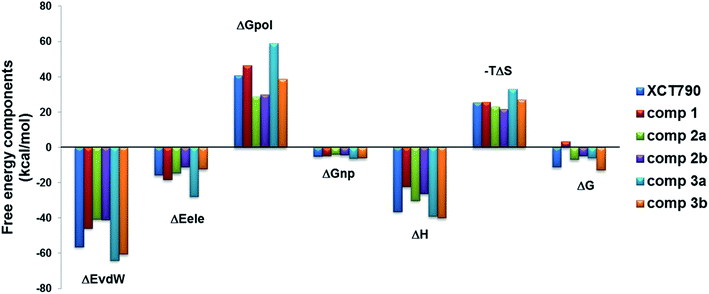 | ||
| Fig. 8 Contributions of the binding free energy components of the inverse agonists to ERRα with MM-PBSA. | ||
A ligand that binds a protein becomes less mobile, and the resulting loss in configurational entropy (−TΔS) opposes the attractive forces (ΔH) driving the binding.39 In spite of strong binding enthalpies, the penalties in binding affinity due to entropy loss (−TΔS: ∼20–30 kcal mol−1) considerably weaken binding affinities (ΔG) for the inverse agonists, even bringing about a small positive one for compound 1. The predicted trend for ΔG in Table 1 for XCT790, compound 2 and compound 3 follows the experimental IC50.
On the basis of careful comparison, Hou et al. reported that MM-GBSA has better performance than MM-PBSA to most protein–ligand systems.40–42 The binding thermodynamics from MM-GBSA was therefore included in Table 1. The general binding affinity (ΔGGB) trend is the same as that from MM-PBSA (ΔGPB). The predicted low solvation energy loss (ΔGpol + ΔGnonpol) from GBSA method considerably enhances the binding affinity, especially for the two conformations of compound 3 up to 9–10 kcal mol−1. After taking into account the standard deviation, ΔGGB agrees with the experimental data better than ΔGPB.
3.3 Binding affinity decomposition and hot spot residues
In order to gain further insight into ERRα–inverse agonist interaction, the contributions of binding free energy was decomposed into individual residues using MM-GBSA approach. The decomposition of free energy on per-residue consists of molecular mechanics and solvation energy but does not include entropy loss. The major residues of ERRα that strongly interact with the inverse agonists were shown in Fig. 9 and Table 2. In general, consistent with the above binding mode analysis these residues primarily come from three regions H3, H5–H7, and H11–H12.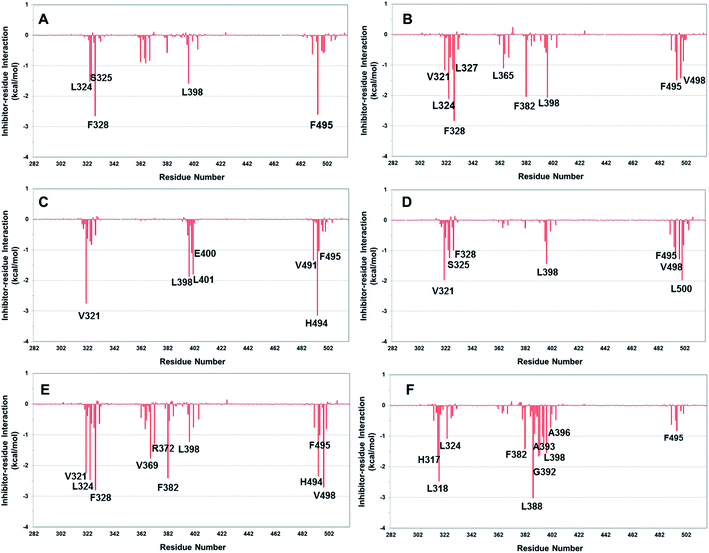 | ||
| Fig. 9 Decomposition of ΔG on a per-residue basis for the protein–inhibitor complex: (A) compound 1; (B) XCT790; (C) conformation 2a; (D) conformation 2b; (E) conformation 3a (F) conformation 3b. | ||
| Residuesa | XCT790 | 1 | 2a | 2b | 3a | 3b |
|---|---|---|---|---|---|---|
| a Important amino acid residues that bind with inverse agonists. ΔG values calculated on per-residue basis. | ||||||
| H317 | −1.67 | |||||
| L318 | −2.47 | |||||
| Val321 | −1.17 | −2.75 | −1.96 | −2.24 | −0.14 | |
| Leu324 | −2.11 | −1.52 | −0.72 | −0.98 | −2.46 | −1.07 |
| Ser325 | −0.75 | −1.41 | −0.82 | −1.24 | −0.62 | |
| Phe328 | −2.83 | −2.64 | −0.51 | −0.99 | −2.80 | −0.34 |
| Leu365 | −1.10 | −0.76 | −0.81 | |||
| Val366 | −0.63 | −0.92 | −0.53 | |||
| Val369 | −0.74 | −0.83 | −1.76 | |||
| Phe382 | −2.04 | −0.57 | −0.25 | −2.40 | −1.41 | |
| Leu398 | −2.07 | −1.58 | −1.88 | −1.43 | −1.23 | −1.55 |
| Val491 | −0.51 | −0.62 | −1.35 | −0.47 | −0.76 | −0.62 |
| His494 | −0.57 | −3.15 | −0.88 | −2.34 | −0.49 | |
| Phe495 | −1.49 | −2.60 | −1.03 | −1.15 | −1.0 | −0.83 |
| Val498 | −1.42 | −0.50 | −0.39 | −1.29 | −2.71 | −0.17 |
| Leu500 | −0.87 | −0.55 | −0.40 | −1.97 | −0.80 | |
For compound 1 five residues from H3 helix (L324, S325, and F328), H6/H7 loop (Leu398), and H11 helix (F495) contribute to the binding by ≥1.0 kcal mol−1, with a few others from H5 (Met362, Leu365, Val366, Val369, and F382) being in a range of 0.5–1.0 kcal mol−1. ERRα–XCT790 complex has a rather similar binding spectrum to compound 1-ERRα. Besides the residues (L324, S325, F328, L365, V366, V369, F382, L398, and F495) that strongly bind with compound 1 a few others such as V321 and L327 from H3, and V498 and Leu500 from H11 also show a significant binding by approximately 1.0 kcal mol−1. Met362 shows a weaker binding with XCT790 than with compound 1 (−0.32 vs. −0.87 kcal mol−1); whereas Val321 (−1.17 kcal mol−1) tends to be much stronger.
For both conformations of compound 2, in spite of strong binding with a few residues of H3 and H11 its interaction with Phe328 is much weaker than compound 1 and XCT790 (−0.51 vs. −2.64 and −2.83 kcal mol−1), and it does not interact with H5–H6 either. Conformation 3a (ERRα–compound 3) has a similar binding spectrum to those of XCT790 and compound 1; however, in conformation 3b of compound 3 does not interact with Phe328 and H5, which is similar to that of compound 2. It is essential for an efficient inverse agonist to strongly interact with Phe328 of H3 and H5 so that H3 can displace H5 and H5 then further moves H12. Other hot spot residues with strong interaction with the EERα include Leu324, Phe382, Leu398, and Phe495 which considerably interact with compound 1, XCT790, as well as in conformation 3a by 1.0 kcal mol−1 or higher.
As shown in Fig. 10, compound 1, XCT790 and compound 3 in conformation a have a similar binding pattern in the LBP. It is speculated that LBP of ERRα may be bound by compound 1 to displace Phe328(H3) and Phe510(H12) that further move away H12.4 The empty cavity of the LBP in apo ERRα has a volume of only ∼100 Å3,4 and multiple structural adaptations are required to enable ligand binding. In apo ERRα, the aromatic ring cluster of Phe328(H3), Phe495(H11), Phe382(H5/H6 loop) and Phe510(H12) (shown in Fig. S5†), and in particular the presence of Phe328(H3) leads to almost complete closing of the LBP with the side chain. As discussed above, XCT790, compounds 1 and 3 (in 3a conformation) considerably bind with the hot residue Phe328 with a binding enthalpy −2.6 to −2.8 kcal mol−1 via π–π stacking, which may trigger the displacement of other residues. Fig. S5† also shows that Phe495 and Phe328 form a hydrophobic lid on top of the ligand also through π–π stacking. Such a hydrophobic lid was affected to some degree upon the binding with the inverse agonists, also reflected by the high binding enthalpy of Phe495 with the inverse agonists (−1.0 to −2.6 kcal mol−1). The structure also provides the basis for rational drug design to obtain inverse agonists of ERRα. The structure provides the basis for identification of novel inverse agonists and has broad implications for other orphan NRs including NGFI-B family, for which the LBP is completely filled with four aromatic residues conserved within the subfamily.
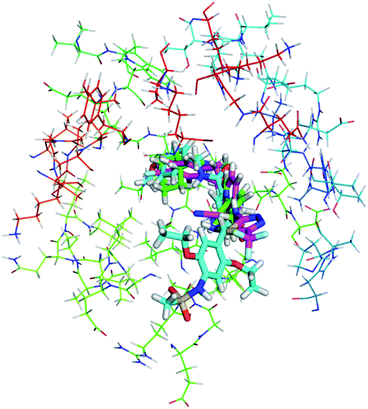 | ||
| Fig. 10 Superimposition of the binding with ERRα in the LBP for compound 1, XCT790 compound 3 (conformation 3a). | ||
In order to visualize the conformational change of hot residues induced by the binding of the inverse agonists, we have superimposed apo and ligand bound ERRα structures for compounds 1 and 3, and XCT790 in Fig. 9. It can be seen that the hot residues superimposed in apo and ligand bound ERRα binding site are Val321, Leu324, Phe328, Leu365, Val369, Phe382, Leu398, Phe495, Val498, and Leu500. By superimposing apo ERRα with compound 1, XCT790 and compound 3a bound ERRα structures, it was identified that upon binding with the inverse agonists the hot residues are shifted away from the apo structure to different degree. Interestingly, Fig. 9 illustrates the considerable displacement of the hot residues, including Phe328, Phe495, and Leu500, which would move away H12 and in turn block the PGC-1α interaction with ERRα (Fig. 11).
4. Conclusion
The binding of inverse agonists such as cyclohexylmethyl-(1-p-tolyl-1H-indol-3-ylmethyl)-amine (compound 1), thiadiazoacrylamide (XCT790), and 1-(2,5-diethoxy-benzyl)-3-phenyl-area analogues (compounds 2 and 3) with ERRα was comprehensively investigated using molecular docking, all atom molecular dynamics simulation, and binding free energy calculations. MD simulations show that the inverse agonists stretch downwards into the ERRα ligand binding pocket (LBP) primarily formed by H3 and H11 helices. Binding energy analysis indicates that compound 3 and XCT790 bind more tightly to ERRα than compounds 1 and 2, and the energy difference mainly results from the contributions of van der Waals interaction and entropy penalty. Both binding mode analysis and affinity decomposition per-residue indicate that compound 1, XCT790, and compound 3 have similar binding spectrum to ERRα, primarily interacting with the residues of H3, H5, H6/H7 loop, and H11 helix, while compound 2 lack of remarkable interaction with H5 region. The hot spot residues significantly binding to three inverse agonists include Leu324, Phe328, Phe382, Leu398, Phe495, and Leu500. It is essential for an effective inverse to strongly bind with aromatic ring cluster consisting of Phe328(H3), Phe495(H11), and Phe382(H5/H6 loop) as well as Leu500. Such understanding the binding mode of inverse agonists may provide valuable guidance for rational drug design of ERRα inhibitors.Conflicts of interest
There are no conflicts to declare.Acknowledgements
This work was supported by the National Institute of General Medical Science of the National Institute of Health (SC3GM105576 for Y. Wang), and the National Natural Science Foundation of China (81872744 for Y. Du).References
- V. Giguere, N. Yang, P. Segui and R. M. Evans, Nature, 1988, 331, 91–94 CrossRef CAS PubMed.
- A. M. Tremblay and V. Giguere, Nucl. Recept. Signaling, 2007, 5, e009 Search PubMed.
- J. M. Vanacker, K. Pettersson, J. A. Gustafsson and V. Laudet, EMBO J., 1999, 18, 4270–4279 CrossRef CAS PubMed.
- J. Kallen, R. Lattmann, R. Beerli, A. Blechschmidt, M. J. Blommers, M. Geiser, J. Ottl, J. M. Schlaeppi, A. Strauss and B. Fournier, J. Biol. Chem., 2007, 282, 23231–23239 CrossRef CAS PubMed.
- B. Horard and J. M. Vanacker, J. Mol. Endocrinol., 2003, 31, 349–357 CAS.
- T. Suzuki, Y. Miki, T. Moriya, N. Shimada, T. Ishida, H. Hirakawa, N. Ohuchi and H. Sasano, Cancer Res., 2004, 64, 4670–4676 CrossRef CAS PubMed.
- S. N. Schreiber, D. Knutti, K. Brogli, T. Uhlmann and A. Kralli, J. Biol. Chem., 2003, 278, 9013–9018 CrossRef CAS PubMed.
- V. K. Mootha, C. Handschin and D. Arlow, et al., Proc. Natl. Acad. Sci. U. S. A., 2004, 101, 6570–6575 CrossRef CAS PubMed.
- C. Y. Chang and D. P. McDonnell, Clin. Cancer Res., 2012, 18, 6089–6095 CrossRef CAS PubMed.
- J. A. Villena and A. Kralli, Trends Endocrinol. Metab., 2008, 19, 269–276 CrossRef CAS PubMed.
- C. Lynch, J. Zhao, R. Huang, N. Kanaya, L. Bernal, J. H. Hsieh, S. S. Auerbach, K. L. Witt, B. A. Merrick, S. Chen, C. T. Teng and M. Xia, Endocrinology, 2018, 159, 744–753 CrossRef CAS PubMed.
- M. Roshan-Moniri, M. Hsing, M. S. Butler, A. Cherkasov and P. S. Rennie, Cancer Treat. Rev., 2014, 40, 1137–1152 CrossRef CAS PubMed.
- J. Kallen, J. M. Schlaeppi, F. Bitsch, I. Filipuzzi, A. Schilb, V. Riou, A. Graham, A. Strauss, M. Geiser and B. Fournier, J. Biol. Chem., 2004, 279, 49330–49337 CrossRef CAS PubMed.
- F. Li, X. Sun, Y. Cai, D. Fan, W. Li, Y. Tang and G. Liu, RSC Adv., 2016, 6, 94119–94127 RSC.
- O. Lanvin, S. Bianco, N. Kersual, D. Chalbos and J. M. Vanacker, J. Biol. Chem., 2007, 282, 28328–28334 CrossRef CAS PubMed.
- H. Greschik, J. M. Wurtz, S. Sanglier, W. Bourguet, A. van Dorsselaer, D. Moras and J. P. Renaud, Mol. Cell, 2002, 9, 303–313 CrossRef CAS PubMed.
- B. B. Busch, W. C. Stevens Jr, R. Martin, P. Ordentlich, S. Zhou, D. W. Sapp, R. A. Horlick and R. Mohan, J. Med. Chem., 2004, 47, 5593–5596 CrossRef CAS PubMed.
- J. Wang, F. Fang, Z. Huang, Y. Wang and C. Wong, FEBS Lett., 2009, 583, 643–647 CrossRef CAS PubMed.
- S. Xu, X. Zhuang, X. Pan, Z. Zhang, L. Duan, Y. Liu, L. Zhang, X. Ren and K. Ding, J. Med. Chem., 2013, 56, 4631–4640 CrossRef CAS PubMed.
- Y. Du, L. Song, L. Zhang, H. Ling, Y. Zhang, H. Chen, H. Qi, X. Shi and Q. Li, Eur. J. Med. Chem., 2017, 136, 457–467 CrossRef CAS PubMed.
- K. Hart, B. Nystrom, M. Ohman and L. Nilsson, RNA, 2005, 11, 609–618 CrossRef CAS PubMed.
- Y. Miao, Y. M. Huang, R. C. Walker, J. A. McCammon and C. A. Chang, Biochemistry, 2018, 57, 1533–1541 CrossRef CAS PubMed.
- A. Fiser and A. Sali, Methods Enzymol., 2003, 374, 461–491 CAS.
- N. Eswar, B. Webb, M. A. Marti-Renom, M. S. Madhusudhan, D. Eramian, M. Y. Shen, U. Pieper and A. Sali, Current protocols in bioinformatics, 2006 Search PubMed , ch. 5, unit-5.6.
- Z. Wang, H. Sun, X. Yao, D. Li, L. Xu, Y. Li, S. Tian and T. Hou, Phys. Chem. Chem. Phys., 2016, 18, 12964 RSC.
- O. Trott and A. J. Olson, J. Comput. Chem., 2010, 31, 455–461 CAS.
- M. J. Frisch, G. W. Trucks, H. B. Schlegel, et al., Gaussian09 D01 edn, Gaussian Inc., Pittsburgh, PA, 2009 Search PubMed.
- D. A. Case, R. M. Betz and D. S. Cerutti, et al., AMBER 2016, University of California, San Francisco, 2016 Search PubMed.
- J. A. Maier, C. Martinez, K. Kasavajhala, L. Wickstrom, K. E. Hauser and C. Simmerling, J. Chem. Theory Comput., 2015, 11, 3696–3713 CrossRef CAS PubMed.
- J. Wang, R. M. Wolf, J. W. Caldwell, P. A. Kollman and D. A. Case, J. Comput. Chem., 2004, 25, 1157–1174 CrossRef CAS PubMed.
- W. L. Jorgensen, J. Chandrasekhar, J. D. Madura, R. W. Impey and M. L. Klein, J. Chem. Phys., 1983, 79, 926–935 CrossRef CAS.
- S. Le Grand, A. W. Götz and R. C. Walker, Comput. Phys. Commun., 2013, 184, 374–380 CrossRef CAS.
- A. W. Gotz, M. J. Williamson, D. Xu, D. Poole, S. Le Grand and R. C. Walker, J. Chem. Theory Comput., 2012, 8, 1542–1555 CrossRef CAS PubMed.
- R. Salomon-Ferrer, A. W. Gotz, D. Poole, S. Le Grand and R. C. Walker, J. Chem. Theory Comput., 2013, 9, 3878–3888 CrossRef CAS PubMed.
- B. R. Miller 3rd, T. D. McGee Jr, J. M. Swails, N. Homeyer, H. Gohlke and A. E. Roitberg, J. Chem. Theory Comput., 2012, 8, 3314–3321 CrossRef PubMed.
- S. Genheden and U. Ryde, Expert Opin. Drug Discovery, 2015, 10, 449–461 CrossRef CAS PubMed.
- J. Shao, S. W. Tanner, N. Thompson and T. E. Cheatham, J. Chem. Theory Comput., 2007, 3, 2312–2334 CrossRef CAS PubMed.
- Y. M. Wu, Z. J. Chen, G. M. Jiang, K. S. Zhang, Q. Liu, S. W. Liang, Y. Zhou, H. B. Huang, J. Du and H. S. Wang, Oncotarget, 2016, 7, 12568–12581 Search PubMed.
- C. E. Chang, W. Chen and M. K. Gilson, Proc. Natl. Acad. Sci. U. S. A., 2007, 104, 1534–1539 CrossRef CAS PubMed.
- L. Xu, H. Sun, Y. Li, J. Wang and T. Hou, J. Phys. Chem. B, 2013, 117, 8408–8421 CrossRef CAS PubMed.
- E. Wang, H. Sun, J. Wang, Z. Wang, H. Liu, J. Z. H. Zhang and T. Hou, Chem. Rev., 2019, 119, 9478–9508 CrossRef CAS PubMed.
- H. Sun, L. Duan, F. Chen, H. Liu, Z. Wang, P. Pan, F. Zhu, J. Z. H. Zhang and T. Hou, Phys. Chem. Chem. Phys., 2018, 20, 14450–14460 RSC.
Footnote |
| † Electronic supplementary information (ESI) available. See DOI: 10.1039/c9ra10697a |
| This journal is © The Royal Society of Chemistry 2020 |

