
 Open Access Article
 This Open Access Article is licensed under a Creative Commons Attribution-Non Commercial 3.0 Unported Licence
Three-dimensional TiNb2O7 anchored on carbon nanofiber core–shell arrays as an anode for high-rate lithium ion storage†
Meili Qi a,
Dongliang Chaob,
Weifeng Suna,
Jinghua Yina and
Minghua Chen*a
a,
Dongliang Chaob,
Weifeng Suna,
Jinghua Yina and
Minghua Chen*a
aKey Laboratory of Engineering Dielectric and Applications (Ministry of Education), School of Materials Science and Engineering, Harbin University of Science and Technology, Harbin 150080, P. R. China. E-mail: mhchen@hrbust.edu.cn
bSchool of Materials Science and Engineering, Nanyang Technological University, 637553, Singapore
First published on 11th February 2020
Abstract
The control of structure and morphology in an electrode design for the development of large-power lithium ion batteries is crucial to create efficient transport pathways for ions and electrons. Herein, we report a powerful combinational strategy to build omnibearing conductive networks composed of titanium niobium oxide nanorods and carbon nanofibers (TNO/CNFs) via an electrostatic spinning method and a hydrothermal method into free-standing arrays with a three-dimensional heterostructure core/shell structure. TNO/CNF electrode exhibits significantly superior electrochemical performance and high-rate capability (241 mA h g−1 at 10C, and 208 mA h g−1 at 20C). The capacity of the TNO/CNF electrode is 257 mA h g−1 after 2000 cycles at 20C, which is much higher than that of the TNO electrode. In particular, the TNO/CNF electrode delivers a reversible capacity of 153.6 mA h g−1 with a capacity retention of 95% after 5000 cycles at ultrahigh current density. Superior electrochemical performances of the TNO/CNF electrode are attributed to the unique composite structure.
1. Introduction
Lithium-ion batteries (LIBs) are widely used power sources for a variety of electronic devices, such as electric vehicles and large-scale energy storage. Graphite was used as an anode material, capturing major market shares for the present LIBs with its low cost, acceptable storage capacity (387 mA h g−1) and stable cycling performance.1–3 However, there are safety issues of the graphite electrode with a low Li storage voltage: the solid electrolyte interphase (SEI) formed on the graphite electrode due to the decomposition of an organic liquid electrolyte consumes a large amount of lithium irreversibly during the initial charging process.4,5 To overcome this problem, different anode materials, such as titanium niobium oxide (TNO) and lithium titanate (LTO), have attracted extensive attention due to their excellent properties: long cycling life and high-rate capability. However, the theoretical capacity of an LTO electrode is about 175 mA h g−1, which has limited its application as an anode in LIBs of high power systems.6,7 Niobium-based oxides whose redox potentials range between 1.0 and 2 V have been considered as potential anode materials due to the achievement of two-electron transfer per niobium that rendered a high storage capacity.8–10 However, TNO suffers from low electronic and ionic conductivity, similar to other transition metal oxides.The design of advanced electrode materials is vital for the development of high-performance LIBs with high energy density.11,12 The nanoparticles are clustered together to minimize their surface area, thus reducing their advantages as nanostructures with high surface to volume ratios, and making them unsuitable as a major component for rechargeable LIBs that require high capacity and long-term stability.13–16 One-dimensional (1D) nanomaterials,17 such as nanowires (NWs),18 nanorods (NRs),19,20 nanofibers (NFs)21 and nanotubes (NTs),22,23 with high surface areas, due to their unique physical and chemical properties have attracted extensive attention, and the advantages of these nanostructures have been widely utilized in recent years. On the other hand, when nanoparticles are composited with 1D nanomaterials, the three-dimensional heterostructure nanomaterials could get high surface to volume ratios. In particular, three-dimensional core/shell nanowires grown directly on conductive substrates have been very suitable for high-performance LIB designs due to their large surface areas and direct electron/ion transport pathways.
In this study, we synthesized three-dimensional heterostructures TiNb2O7 nanorod/carbon nanofiber (TNO/CNF) core/shell arrays as the anode material for LIBs. For the electrodes of the TNO/CNF core/shell arrays, CNF worked as the conductive network of TiNb2O7 nanoparticles to offer fast electron/ion transfer paths and enhanced structural stability. As an N-doped CNF layer on TNO/CNFs, the N-doped carbon core provided more accessible channels for the transport of lithium ions and a lower energy barrier. Due to the positive synergistic effects on ion/electron transfer, the TNO/CNF electrode exhibited good electrochemical properties with high-rate capacity and ultra-long cycles (5000 cycles).
2. Experimental section
2.1 Material synthesis
The fabrication process of the TNO/CNF core/shell arrays involves two steps: (1) the CNF arrays were formed via an electrostatic spinning method and annealing process; (2) the TNO/CNF and TNO mesoporous microspheres were prepared via a hydrothermal method.The CNF arrays were formed via an electrostatic spinning method and annealing process by the following procedure: 3 g of DMAc (N,N′-dimethylacetamide) and 40 ml of ODA (diaminodiphenyl ether) were added into a three-opening round-bottomed flask, and placed in an ultrasonic bath. 3.28 g of PMDA (pyromellitic dianhydride) was added portion wise, then the PMDA was completely dissolved after an intense stirring reaction for 3 h. Electrospinning parameters were set as follows: an applied voltage of 15–18 kV and flow rate of 0.7 ml h−1. Spinning fibers in a horizontal tubular furnace were imidized, the temperature of the furnace was first increased from room temperature to 320 °C at a rate of 1 °C min−1 and was maintained for 30 min for the imidization. Then, the temperature was increased to 500 °C at a rate of 10 °C min−1 and was maintained for 30 min under Ar atmosphere for the carbonization.
The TNO/CNF core/shell arrays and TiNb2O7 mesoporous microspheres were prepared via a hydrothermal method. 0.27 g of titanium isopropoxide (C12H28O4Ti, 97%, Aladdin) and 0.14 g of niobium chloride (NbCl5, 99.9%, Aladdin) were dissolved into 60 ml ethanol and stirred for 15 min. The resultant solution was transferred to a 100 ml Teflon-lined stainless steel autoclave with the as-prepared CNF arrays immersed into it, and then kept at 200 °C for 24 h, and the obtained white precipitate was washed by ethanol, and annealed at 700 °C in Ar for 2 h. Then, the TNO/CNF arrays and TNO mesoporous microspheres were prepared (Fig. 1).
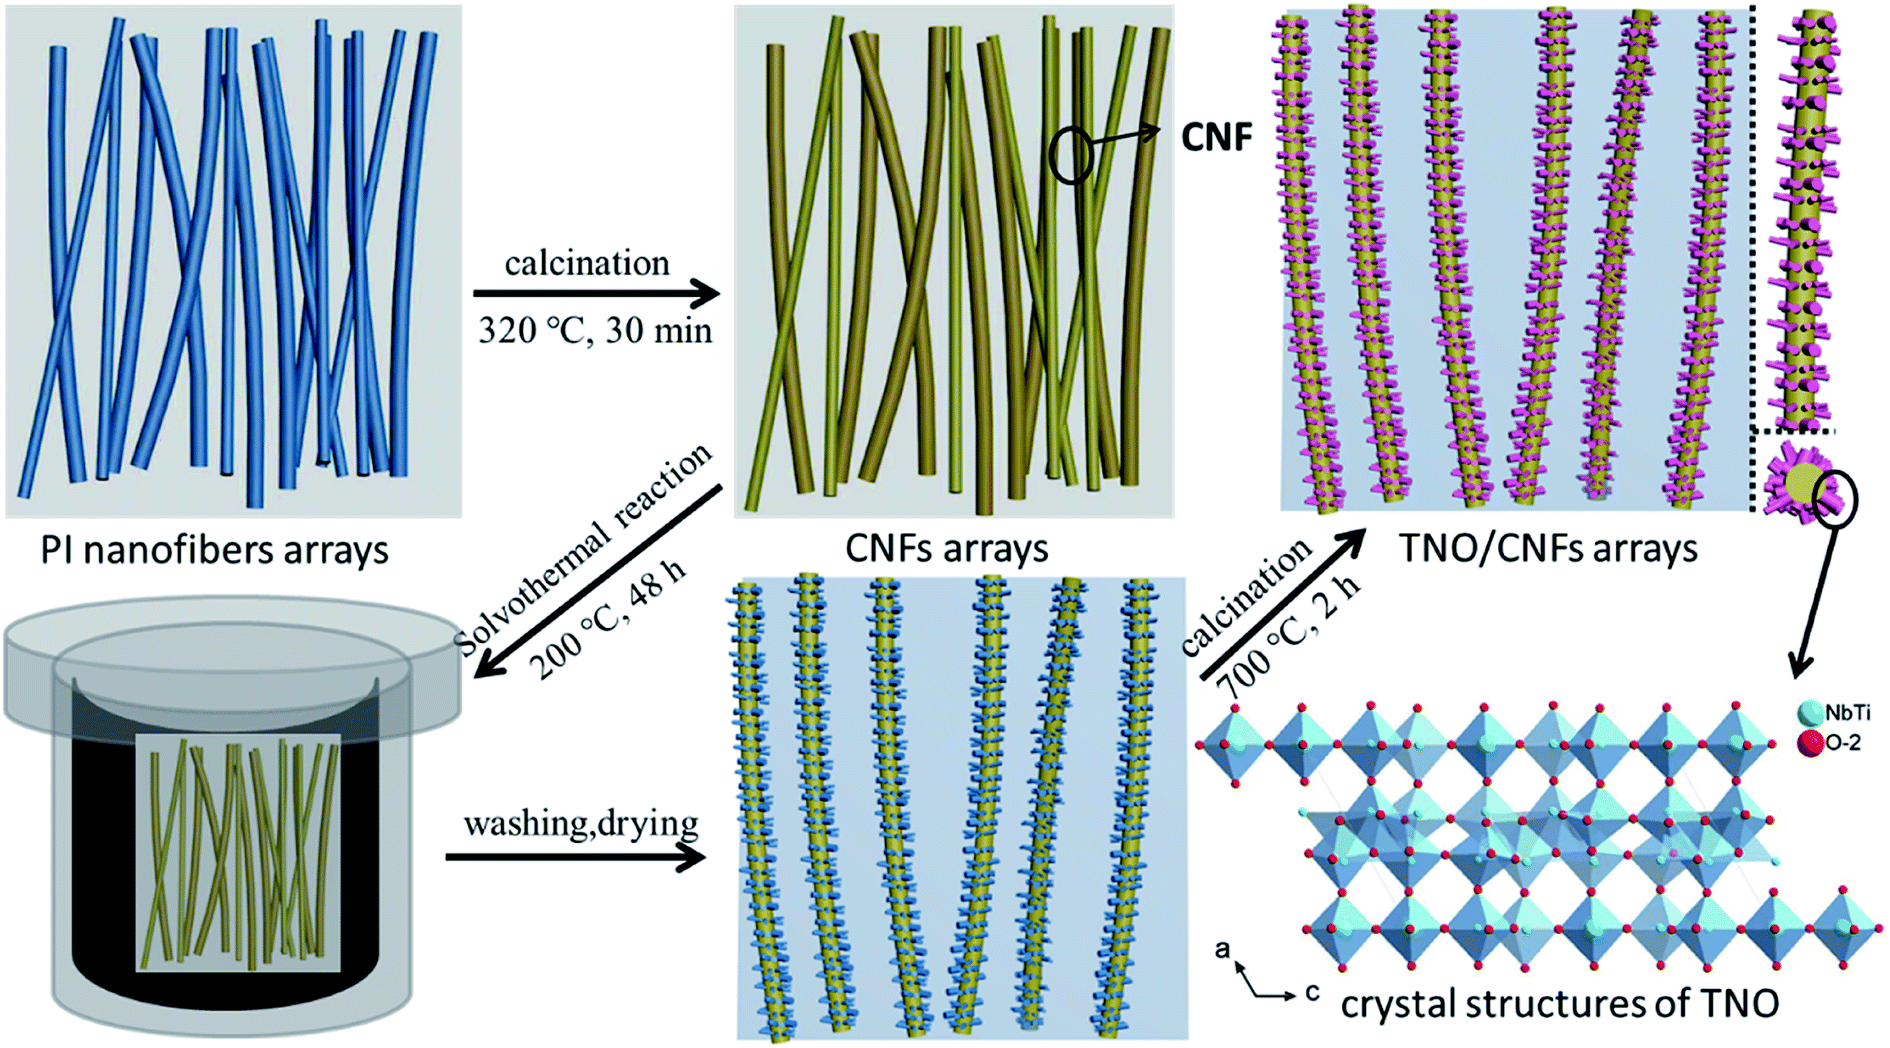 | ||
| Fig. 1 Schematic fabrication processes of the TNO/CNF core/shell arrays and crystal structures of the TNO mesoporous microspheres. | ||
2.2 Material characterization
The crystal structures of the TNO microspheres and TNO/CNF core/shell arrays were characterized using an X-ray diffractometer (Bruker D8 Advance, Cu-Kα radiation source λ 1.5406 Å). Raman spectra of the TNO microspheres and TNO/CNF core/shell arrays were recorded using a Raman spectrometer (Renishaw inVia Reflex, laser source ). The microstructures were investigated using scanning electron microscopy (SEM, Hitachi S-4800), energy dispersive X-ray elemental analysis (EDX, JEM-ARM-200F) and high-resolution transmission electron microscopy (HRTEM, FEI Tecnai G2 F20 S-TWIN).
2.3 Electrochemical test
The samples of the TNO/CNF core/shell arrays were cut into a circular pellet and directly used as the working electrode. The electrochemical measurements were performed in two-electrode coin cells (CR2025). Standard CR2032-type coin cells were assembled in an argon-filled glove box using a lithium foil as the counter electrode, using 1 M LiPF6 in ethylene carbonate (EC)–dimethyl carbonate (DME) as the electrolyte (1![[thin space (1/6-em)]](https://www.rsc.org/images/entities/char_2009.gif) :1 in volume), and a polypropylene (PP) microporous film as the separator (Celgard 2300). Galvanostatic charge/discharge tests were performed at various current rates using a multi-channel battery testing system (Neware CT-3008) within a potential range of 1–2.5 V. The current rate of 10C is about 3880 mA g−1, corresponding to the theoretical capacity of TiNb2O7 (388 mA h g−1). Electrochemical impedance spectroscopy (EIS) and cyclic voltammetry (CV) measurements were performed on an CHI 600C electrochemistry workstation. The sweep rate of CV was 0.1 mV s−1, and impedance spectra were recorded in a frequency range of 0.01–105 Hz.
:1 in volume), and a polypropylene (PP) microporous film as the separator (Celgard 2300). Galvanostatic charge/discharge tests were performed at various current rates using a multi-channel battery testing system (Neware CT-3008) within a potential range of 1–2.5 V. The current rate of 10C is about 3880 mA g−1, corresponding to the theoretical capacity of TiNb2O7 (388 mA h g−1). Electrochemical impedance spectroscopy (EIS) and cyclic voltammetry (CV) measurements were performed on an CHI 600C electrochemistry workstation. The sweep rate of CV was 0.1 mV s−1, and impedance spectra were recorded in a frequency range of 0.01–105 Hz.
3. Results and discussion
Fig. 2a shows the morphology of the TNO/CNF core/shell arrays in this study. The structure of the CNF arrays is intact for the TNO/CNF core/shell arrays, and there are lots of TNO nanorods on the surface of the CNF arrays, as shown in Fig. 2a. A uniform diameter distribution of ∼200 nm with a smooth surface can be clearly observed for the CNF arrays (Fig. S1†). SEM images in Fig. S2† show that the TNO microsphere is assembled by TNO nanorods with a diameter of about 50–100 nm interconnected in a porous scaffold. Those nanorods can be assembled on the surface of the CNF arrays during the preparation of TNO/CNFs (Fig. 2a). The surfaces of the CNF arrays are covered by interconnected TNO nanorods with an overall width of about 350 nm. The morphology of TNO for the TNO/CNF core/shell arrays shows a complete structure with nanorods, and a diameter range of 20–50 nm and length range of 50–200 nm. The TNO nanorods are connected with each other and adhere strongly to the core of the CNF arrays, and those nanorods form high-quality TiNb2O7 nanorods on CNFs (Fig. 2a).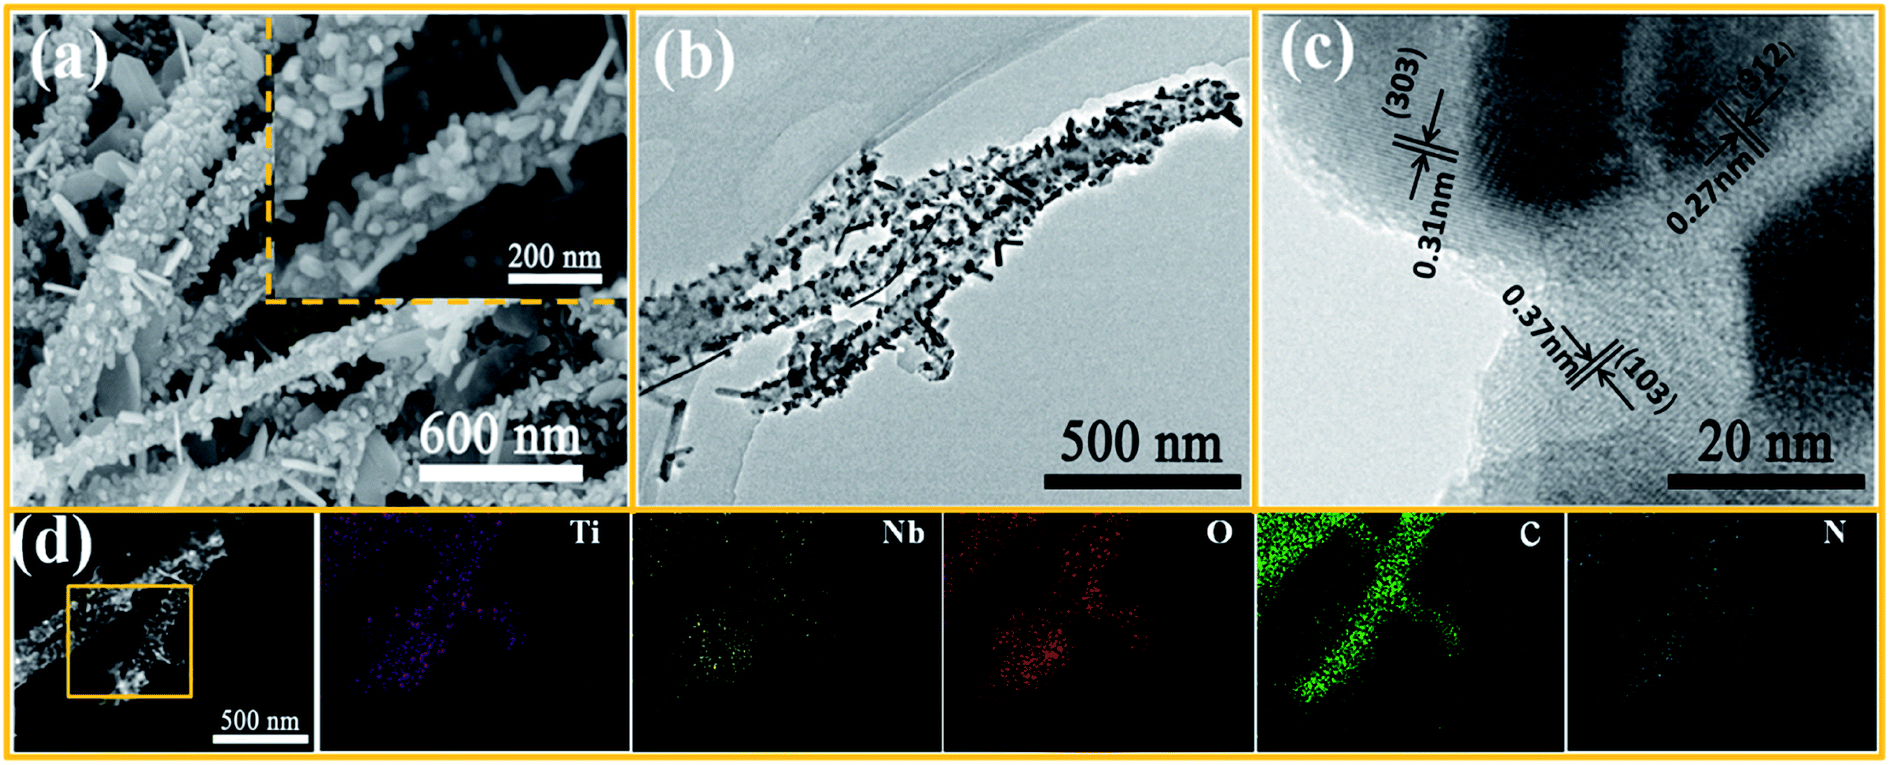 | ||
| Fig. 2 SEM images of the TNO/CNF core/shell arrays (a) TEM images of the TNO/CNF core/shell arrays: TEM and HRTEM images (b and c), EDS elemental mapping images (d). | ||
In addition, to further assess the microstructure of the TNO/CNF core/shell arrays, transmission electron microscopy (TEM) images are presented in Fig. 2b. The structure of CNFs is well maintained, and few uncovered CNFs are evidently seen. Also, most TNO nanorods evenly cover the surface of the CNF arrays. As can be clearly seen in Fig. 2c, TNO/CNFs have high crystallinity and show lattice fringes of 0.27 nm, 0.31 nm and 0.37 nm, corresponding to the (312), (303) and (103) planes of the TiNb2O7-type structure (JCPDS no. 39-1407).24 EDS mapping validates the existence of N, C, Ti, Nb and O elements in the TNO/CNFs, corresponding to TEM images of the TNO/CNFs (Fig. 2d). The carbon and nitrogen elemental signals are uniformly distributed on the inner structure of TNO/CNFs. These results clearly verify the presence of well-distributed nitrogen element on the TNO/CNF core/shell arrays. The niobium and titanium elemental signals distribute in position of the TNO particles for the structure of the TNO/CNF core/shell arrays, and the whole structure of the TNO/CNF core/shell arrays is uniformly detected.
The high crystallinity and phase purity of the as-prepared TNO and TNO/CNF core/shell arrays are confirmed by X-ray diffraction (XRD) (Fig. 3a). All of the identified peaks could be indexed to the monoclinic TiNb2O7 (space group: C2/m, JCPDS#: 39-1407), which indicates the purity of the TiNb2O7, as shown in Fig. 3a.25 The broad peak at about 26° attributed to the (402) plane corresponds to the reflection of amorphous carbon, which overlaps with the plane of TNO. Raman scattering spectra of the TNO/CNF core/shell arrays are shown in Fig. 3b. Two characteristic peaks the D and G bands of CNF are found at 1383 and 1598 cm−1 for the TNO/CNF core/shell arrays. The peaks observed at 886 cm−1 and 996 cm−1 are attributed to the edge-shared and corner-shared NbO6 octahedra for TiNb2O7 microspheres. The strong peak at 648 cm−1 is attributed to the preferentially occupied edge-shared TiO6 octahedra, and the peak at 535 cm−1 is coincident with TiO6 octahedra based on previous studies (Fig. 3b).26 The amount of carbon in the TNO/CNF core/shell arrays is calculated to be 64.1% from the thermogravimetric (TG) curves of the TNO/CNF core/shell arrays (Fig. 3c). To further understand the chemical compositions and bonds between TNO and CNFs, the arrays were characterized via X-ray photoelectron spectroscopy (XPS). The measured spectrum in Fig. 3d demonstrates the presence of the N, C, Ti, Nb and O elements in the TNO/CNF core/shell arrays. High-resolution N 1s spectra are recorded to further study the core of N-doped CNFs. The broad peak of N 1s could be decomposed into three peaks at 400.6 eV (graphitic N), 398.5 eV (pyrrolic N) and 397.9 eV (pyridinic N) in the core of CNFs.27–29 The C–N bond located at ∼285.1 eV and the C–C bond at 284.5 eV could also be detected in the C 1s spectrum (Fig. 3f). In addition, the characteristic peaks of Ti 2p1/2 (464.1 eV) and Ti 2p3/2 (458.1 eV) are noticed in the Ti 2p spectra, those indexed with the Ti4+ in TNO (Fig. 3g). The high-resolution spectrum of Nd 3d showed two peaks at 209.7 eV and 207 eV, suggesting the existence of Nb5+ in TNO (Fig. 3h). The O 1s spectrum is displayed in Fig. 3i, wherein the main peak of the metal–O (529.5 eV) and C–O (531.2 eV) could be obtained.10 As a result, all the above results demonstrate that TNO nanorods were successfully attached to the N–C core.
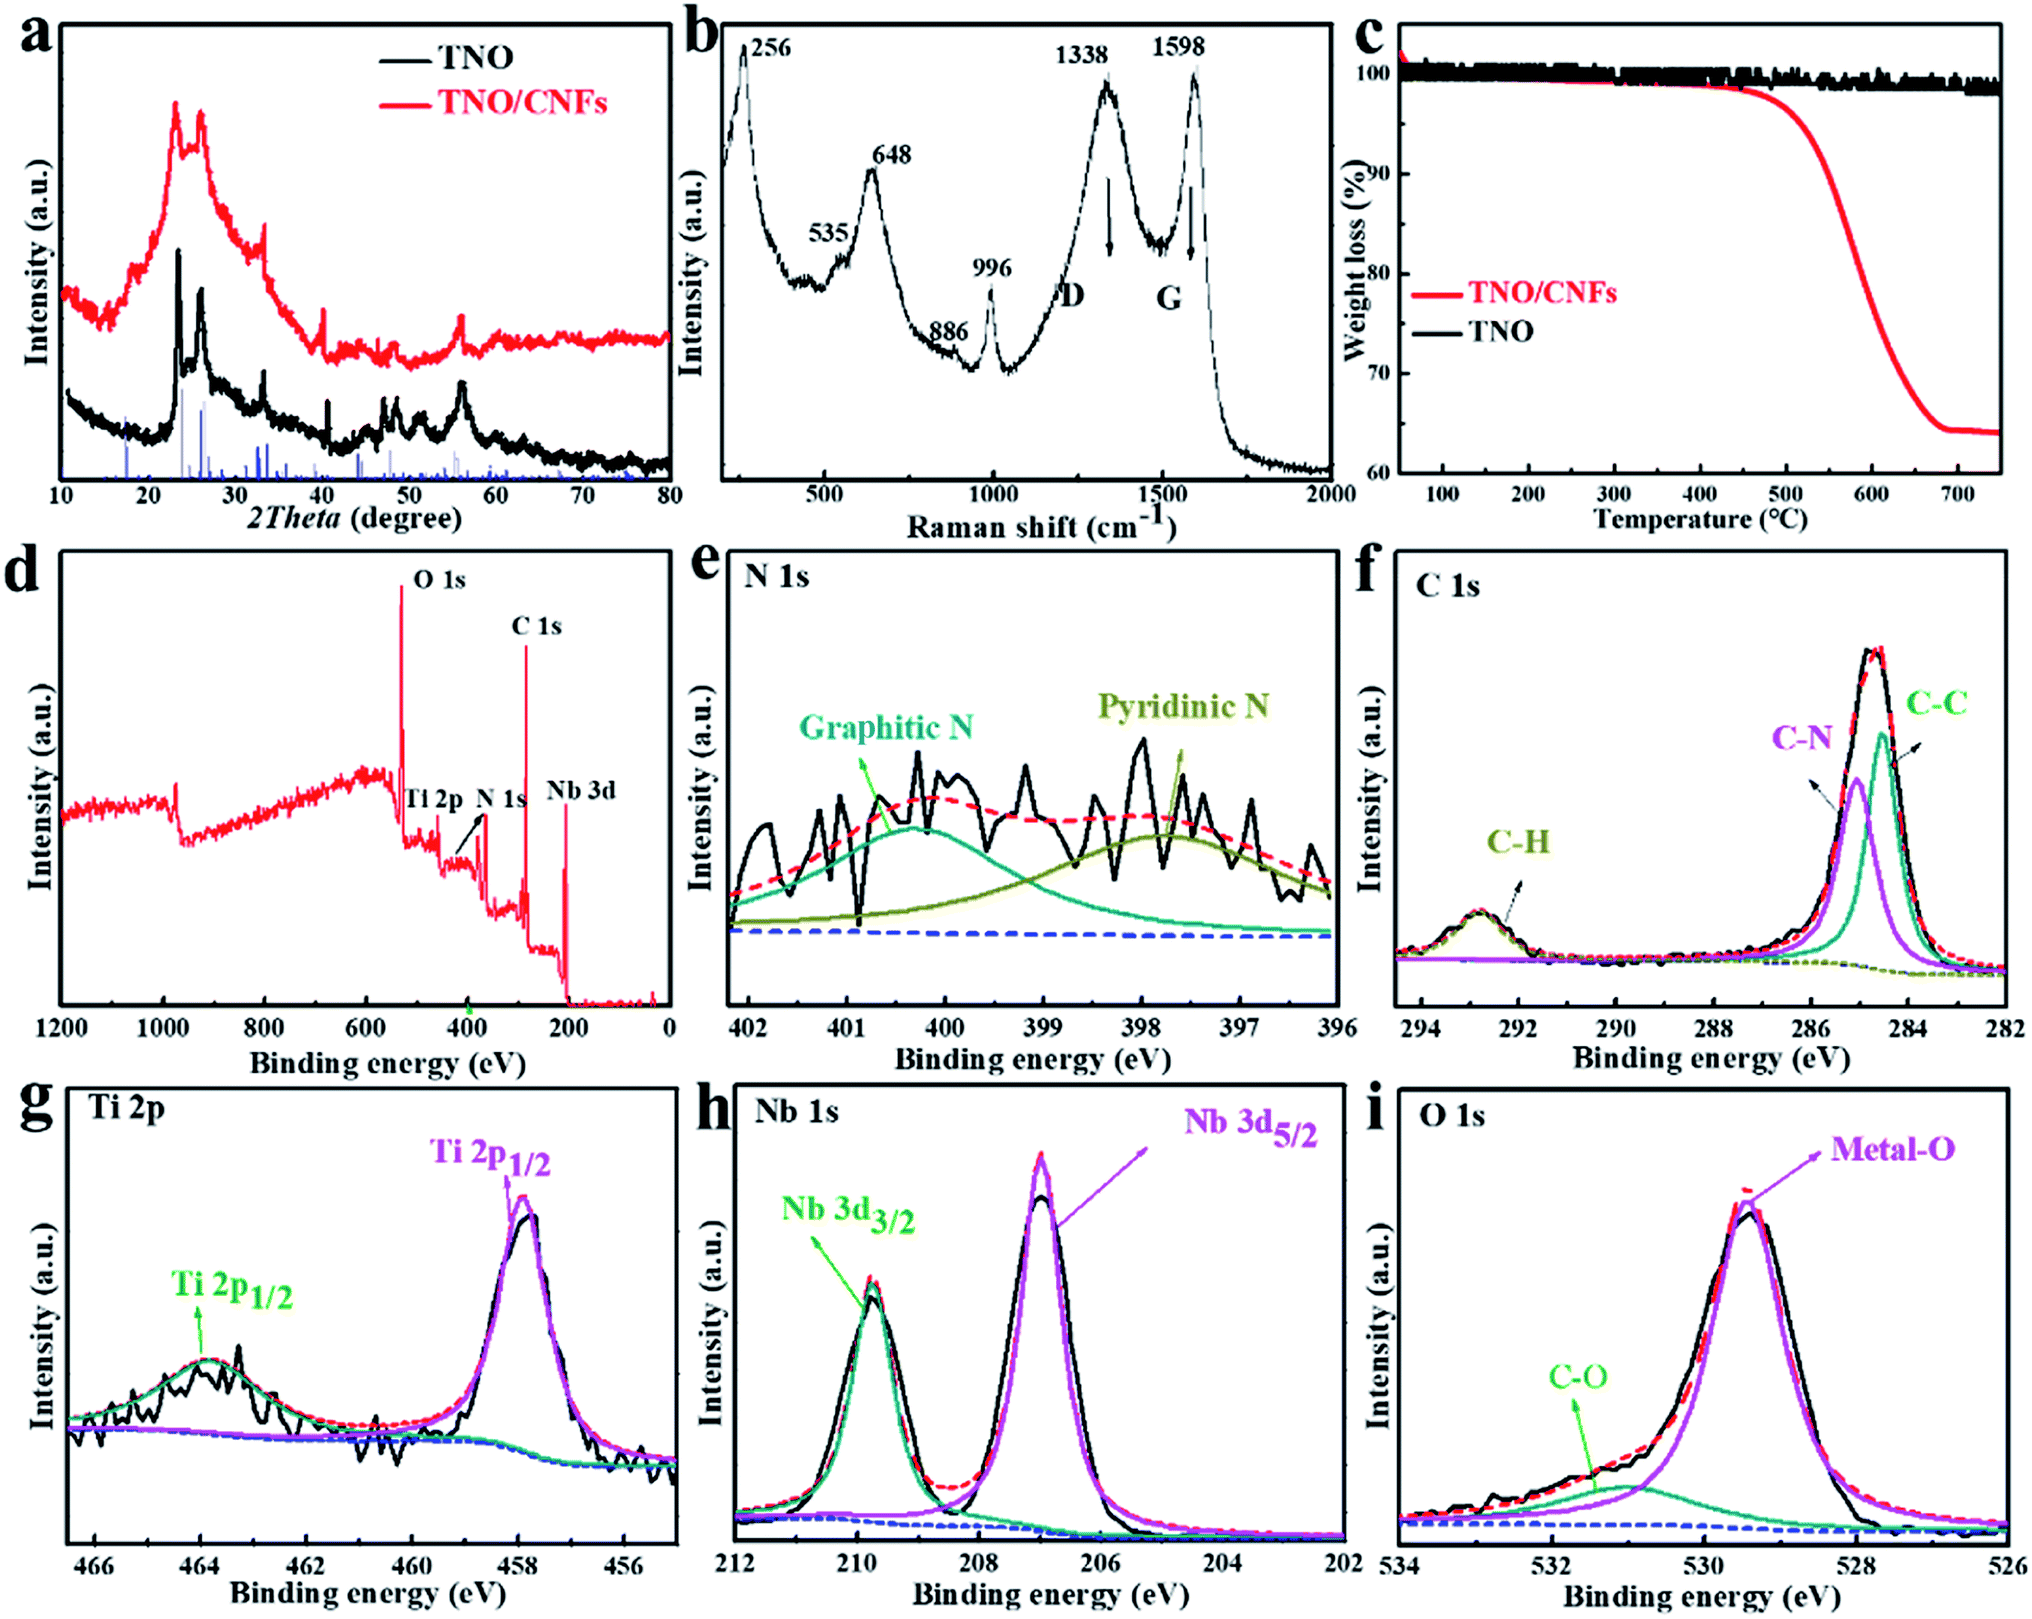 | ||
| Fig. 3 XRD patterns (a) thermogravimetric analysis of the TNO and TNO/CNF core/shell arrays (c); Raman scattering spectra (b) and XPS spectra of the TNO/CNF core/shell arrays: (d) survey spectrum, (e) N 1s, (f) C 1s, (g) Ti 2p, (h) Nb 3d and (i) O 1s. | ||
Electrochemical performances of the TNO/CNF electrodes were tested via cyclic voltammetry (CV) at a scanning rate of 0.1 mV s−1 (Fig. 4a). For the electrode of TNO/CNFs, two sharp peaks of oxidation/reduction located at 1.78 V (anodic) and 1.63 V (cathodic) are attributed to the change in valency between Nb5+ and Nb4+. Another wider but less obvious pair of peaks (anodic 2.02 V, cathodic 1.92 V) are due to the partial variation in the Ti4+/Ti3+ redox couple in the TNO/CNF electrode. Significantly, the peak location in the initial cycle is different from that of subsequent cycles. This can be explained by the electronic structural change in TNO/CNFs upon the insertion of Li ions.
 | ||
| Fig. 4 CV curves of the TNO/CNF core/shell arrays at a scan rate of 0.1 mV s−1 in the voltage range of 1–2.5 V (a); cycling stability at 10C and 20C (b); charge and discharge curves of TNO (c) and TNO/CNFs (d) at different fixed current densities of 1, 4, 8 and 16C; high-rate cycling stability of TNO/CNFs at 30C (e). | ||
Fig. 4b shows the electrodes of TNO and TNO/CNFs tested over 2000 cycles at 10C and 20C rates, and a high-rate cycling stability is achieved for the TNO/CNF electrode. The TNO electrode shows a lower capacity than TNO/CNFs. After 1000 cycles at 10C, the TNO/CNF electrode shows a discharge capacity of ∼251 mA h g−1, compared to the first cycle (289 mA h g−1) with a capacity retention rate of 86%. In the end of 2000 cycles, the capacities of TNO and TNO/CNFs are 76 mA h g−1 and 227 mA h g−1, respectively (Fig. 5b). Among them, the TNO/CNF electrode in terms of the specific high current density shows the best electrochemical performance after the 2000 cycle test, which is higher than the TNO electrode. Moreover, the capacity retention of the TNO/CNF electrode at high current density (20C, 7760 mA g−1) is even better, and the TNO/CNF electrode also shows a high coulombic efficiency of 96.6% (217 mA h g−1). Nevertheless, the specific capacity and coulombic efficiency of the TNO/CNF electrodes are still considered quite high compared to those of previous reports. In a word, the TNO/CNF electrode has not only remarkable high rate capability but also long cycle stability.
 | ||
| Fig. 5 In situ Raman spectra evolution of the TNO/CNF core/shell arrays electrode at different charge (a)/discharge (b) curves of the TNO/CNF electrode. | ||
In order to evaluate the rate performance of TNO/CNFs, the TNO/CNF electrode was evaluated by multi-current galvanostatical testing. The charge–discharge curves of the TNO/CNF and TNO electrodes at various fixed current densities are shown in Fig. 4b and c, respectively. The TNO/CNF electrode was tested at the C-rates of 1, 4, 8 and 16C, calculated from the theoretic capacity of TNO. The discharge capacity of the TNO/CNF electrode can be as high as 356.2 mA h g−1 at 1C, and the capacity is still maintained at ∼240 mA h g−1 even at a very high rate of 16C, indicating excellent rate capability. In comparison, the TNO electrode was tested using the same method, as shown in Fig. 4c. Clearly, the discharge capacity of the TNO electrode dramatically faded with values of 308.1 mA h g−1 at 1C, and only 146.6 mA h g−1 at 16C. The TNO/CNF electrode showed better rate capability compared with TNO electrode at various current densities. In order to further explore the ultra-long cyclability of the TNO/CNF electrode, 5000 cycles were tested at the ultrahigh speed of 30C. After 5000 cycles, the TNO/CNF electrode could keep a reversible capacity of 153.6 mA h g−1 with a coulombic efficiency of 95%, and the capacity retention rate was up to 85%. The TNO/CNF electrode shows a better specific capacity with an increase in current density. Owing to the structure of the core/shell, the TNO/CNF electrode demonstrates excellent high-rate cycling stability and capacity retention ability. The core structure of the CNF arrays not only provides a larger effective area for better contact with the electrolyte but also reduces the rate-limiting Li+ diffusion path, both of which lead to a faster charge transfer.
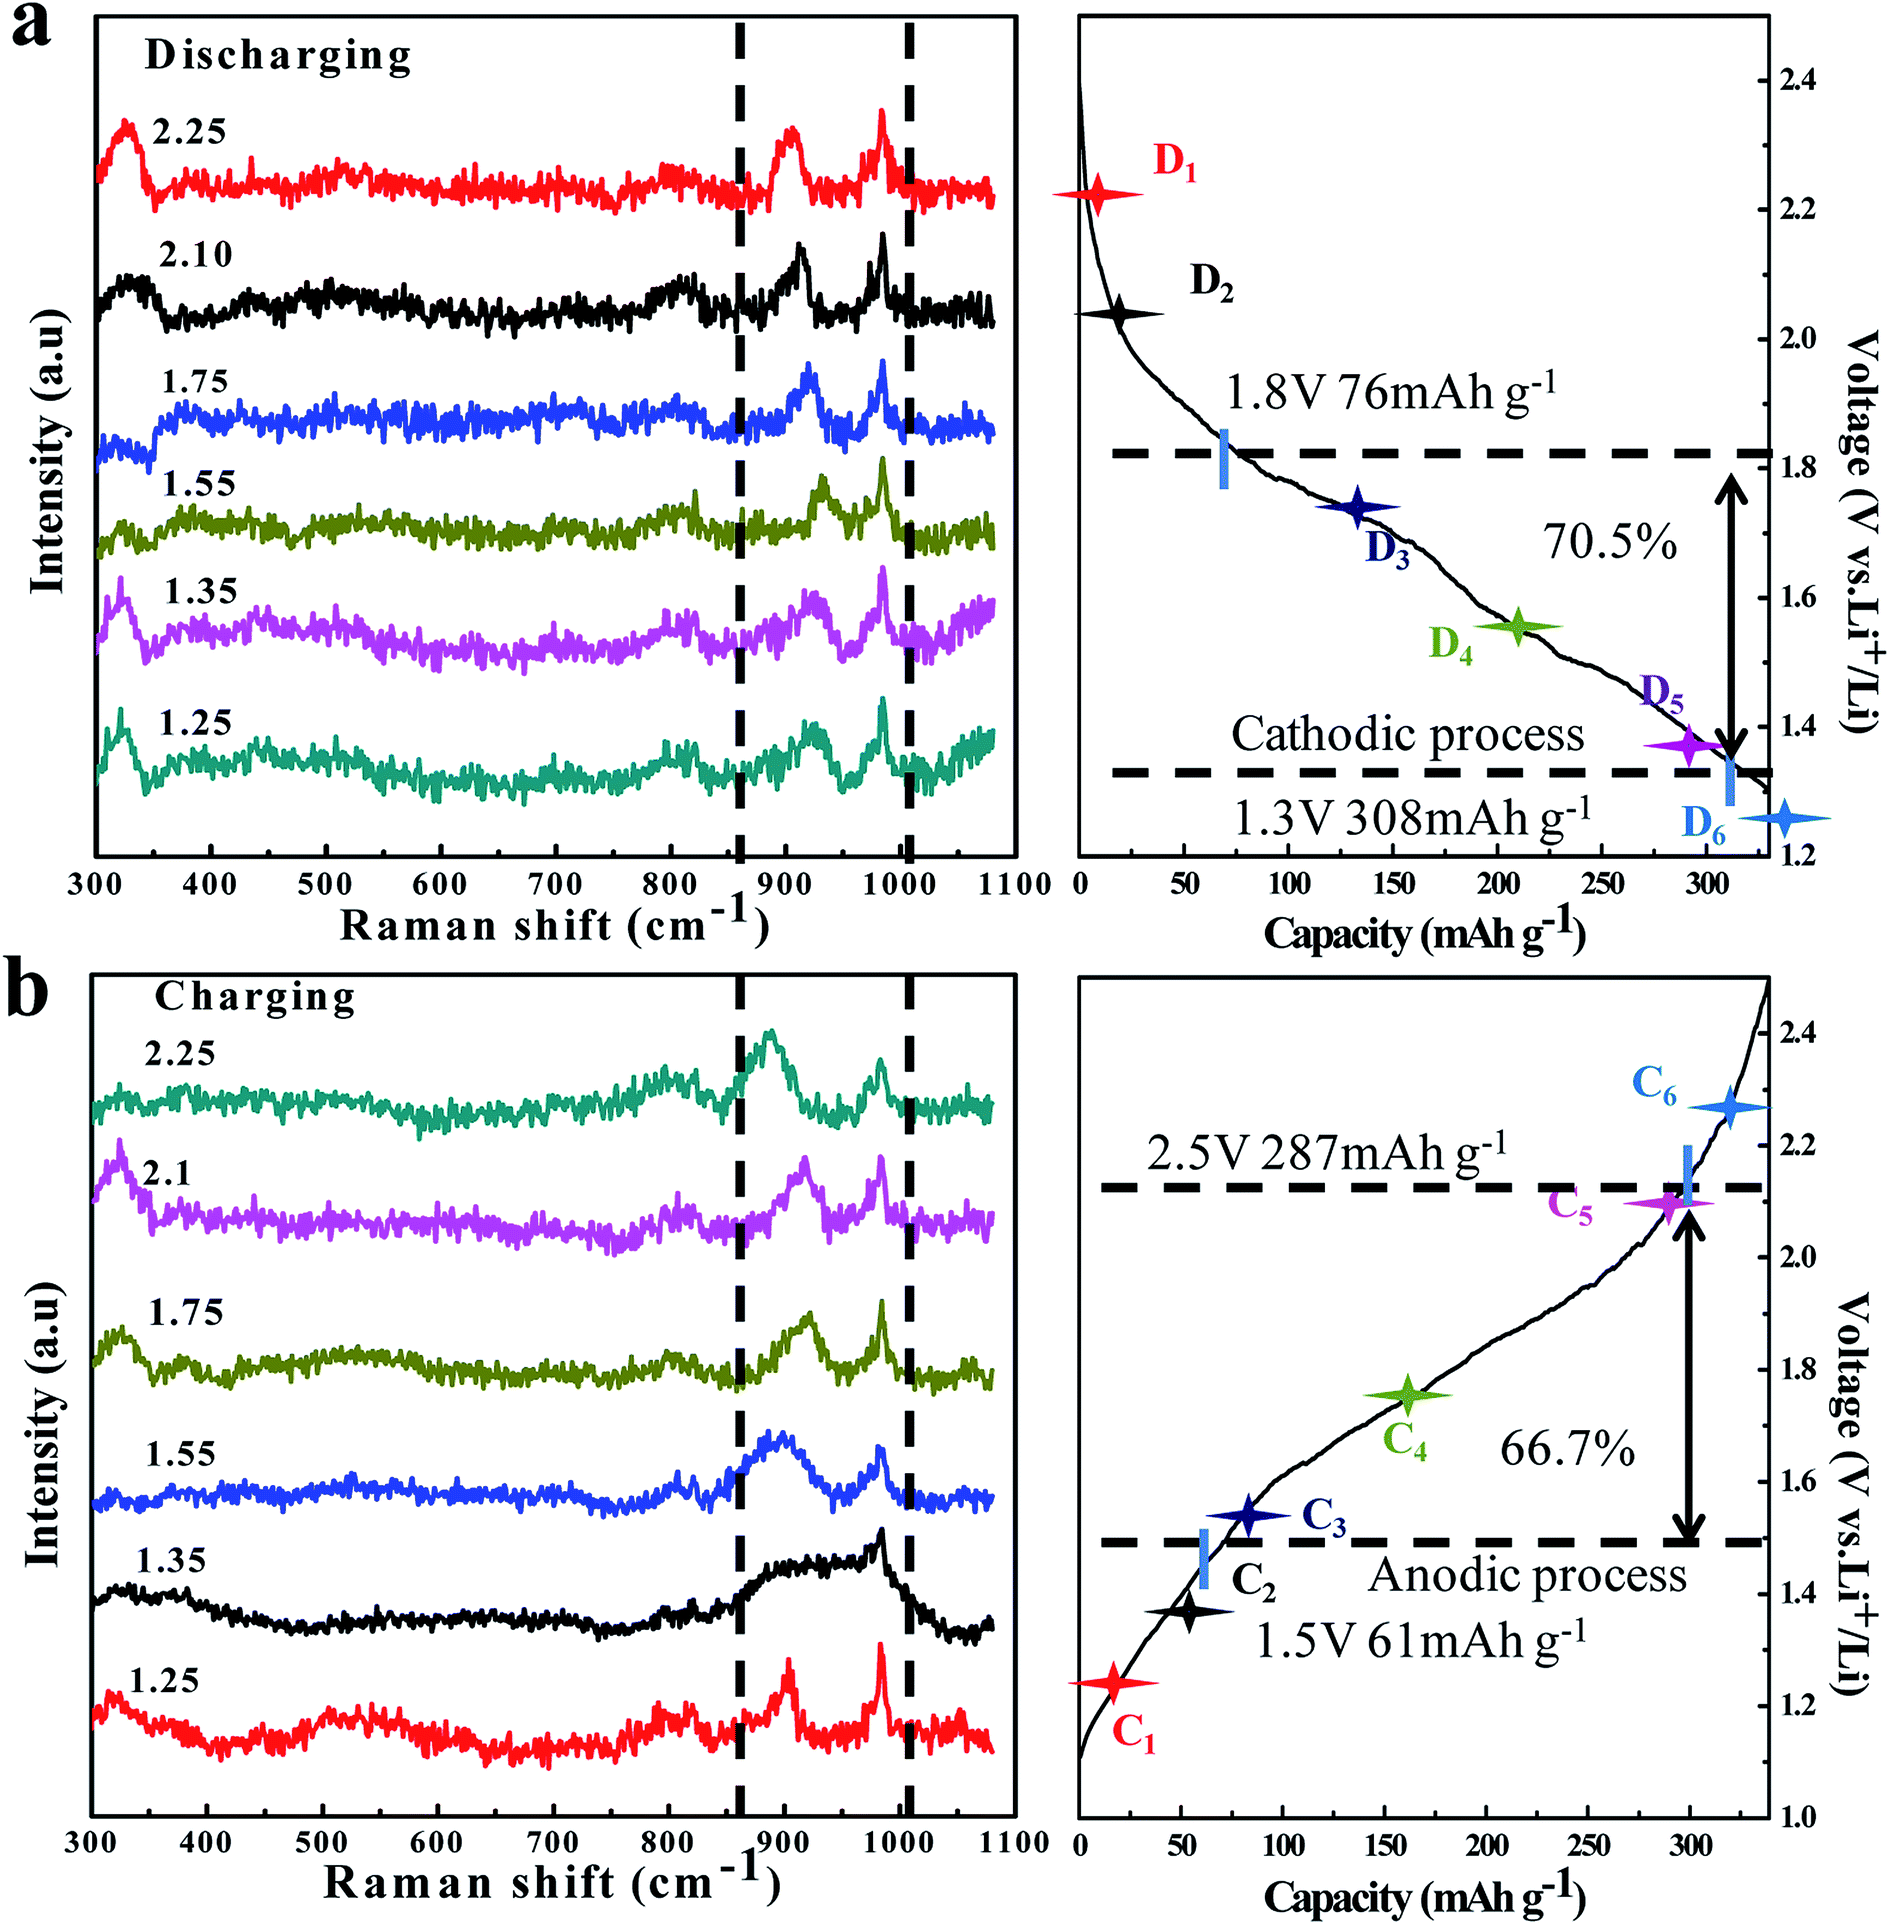
In order to check the reaction reversibility of the TNO/CNF electrode, in situ Raman spectra were recorded upon reaction cells during the charge/discharge process (Fig. 5a and b). The 725 cm−1 and 822 cm−1 peaks are caused by the electrolyte containing EC and DEC anions, according to the previous study.30,31 The characteristic peak of TNO at ∼902 cm−1 was focused; during the charge process, this peak is found to move to a higher wavenumber region for the lithium insertion process in TNO. After the following charge process peak (932 cm−1) at 1.65 V, the peak returns to ∼889 cm−1 finally after the charge at 2.5 V.
In the process of lithium extraction from TNO, the peak shifts to the right in reverse, and the in situ Raman test fully verifies that the TNO/CNF electrode presents excellent reaction reversibility.
In order to understand the reason for the superiority of the N-doped CNF core, we further studied the electronic structure and diffusion energy via first-principles calculations for perfect carbon and N-doped carbon core as the analytical model (Fig. 6). The effects of the N-doped carbon core strongly relate to their electronic structure. As shown in Fig. 6a–c, the lithium ion adsorption performance of the N-doped carbon core is enhanced with higher adsorption energies of 3.16 eV (b) and 3.47 eV (c) compared to the adsorption energy of the carbon core (2.31 eV).
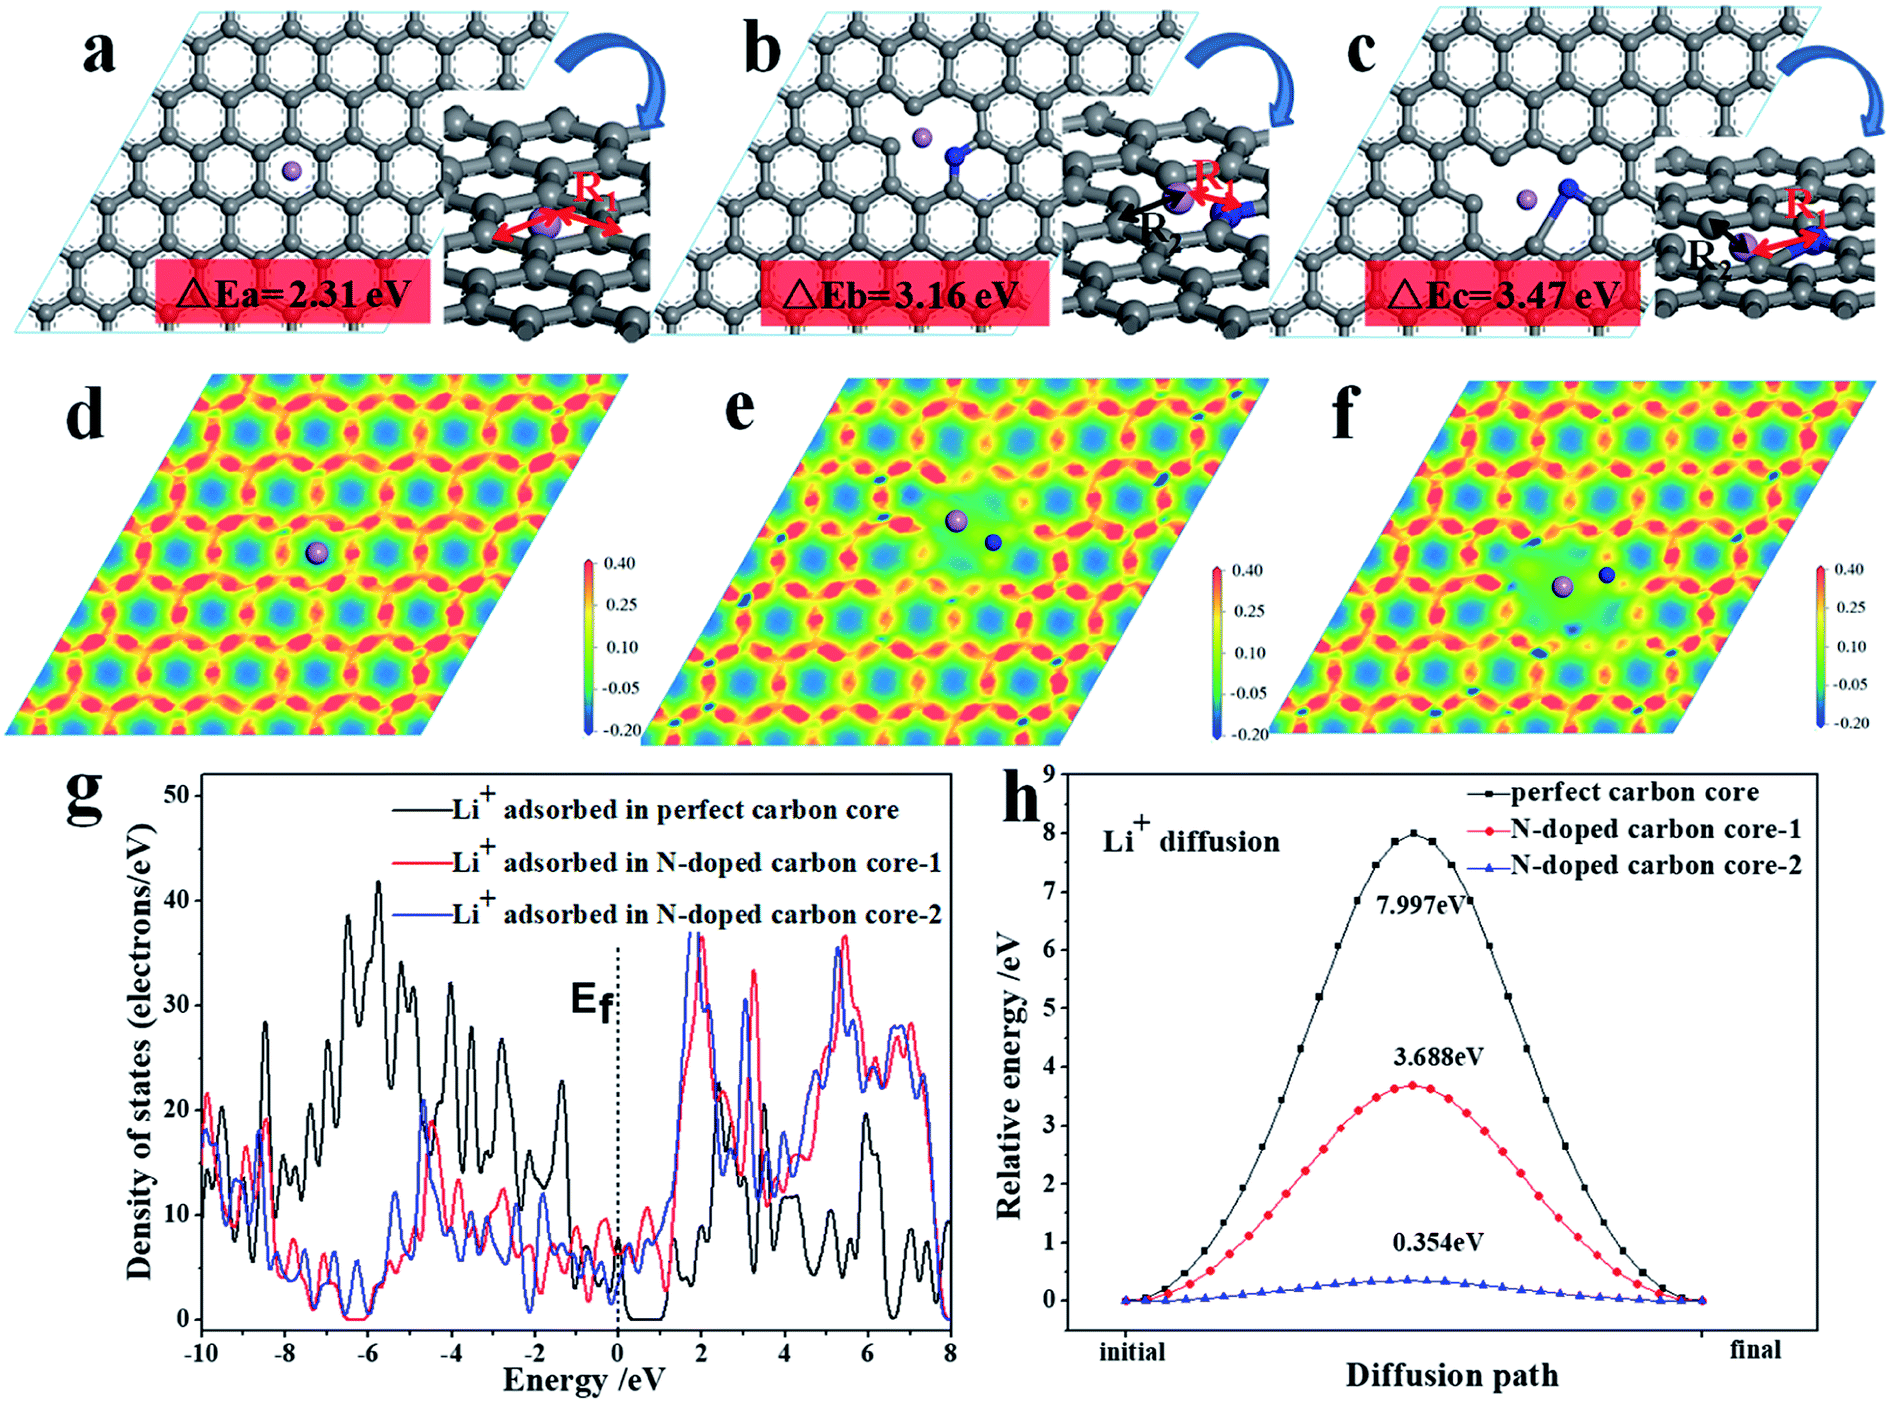 | ||
| Fig. 6 Different optimized configurations for perfect carbon core (a) and N-doped carbon core with Li+ adsorption (b and c). Deformation charge density of perfect carbon core (d) and N-doped carbon core (e and f); (g) density of states (DOS) of carbon core and N-doped carbon core (the vertical line marks the Fermi level); (h) reaction energy of the migration of lithium ion on carbon core and N-doped carbon core. The purple, gray and blue balls denote the Li, C and N atoms, respectively. | ||
The density of state (DOS) from the first-principles calculations indicate that the electronic density close to the Fermi level has been appreciably increased for the N-doped carbon core, as shown in Fig. 6g, which evidently suggests that the N-doped carbon core benefits from the lithium ion adsorption performance on the surface. The following electron density differences distributed on the atomic-layer plane, as exhibited in Fig. 6d–f, illustrate that N-doped carbon core can break the electronic conjugated surface and thus cause weak electrostatic interactions around the defect center, which engenders a facilitated channel for Li ion diffusion. The nudged elastic band (NEB) method in the first-principles energy calculations is employed to calculate the minimum energy path (MEP), which represents the favorable diffusion path of Li cation migration through the carbon core and N-doped carbon core, as shown in Fig. 6h. It is evidently noted that the vacancy introduced by the N-defect presents a more efficient diffusion path with a remarkably lower diffusion potential surface and energy barrier than the perfect carbon core. Therefore, the N-doped carbon core exhibits better reaction kinetics for lithium ion diffusion adsorption reaction than the perfect carbon, consequently improving the electrochemical properties of the TNO/CNF electrode.
The electrolyte wettability of the TNO/CNF electrode was characterized by the contact angles between electrodes and the liquid electrolyte measuring (Fig. S3†). As shown in Fig. S4,† the contact angle between CNFs and the electrolyte is ∼104.9°. The contact angle between the TNO/CNF core/shell arrays and the electrolyte is close to zero; therefore, the TNO/CNF core/shell arrays have better electrolyte wettability than CNFs (Fig. S5†). The good electrolyte wettability would ease the electrolyte permeation into the surface area of the TNO/CNF core/shell array electrode, and make full contract with TNO nanoparticles, leading to a dramatic improvement in the electrochemical properties.
The superior electrochemical performance of the TNO/CNF electrode is attributed to the unique composite structure. First, powerful conducive networks have been built between the CNF arrays and TNO that provide comprehensive conductive pathways for fast ion/electron transportation, which resulted in the higher utilization and better reaction kinetics of TNO. Second, the N-doped carbon core provided more number of accessible channels for the transport of lithium ions and lower energy barrier. Finally, the fabrication of the TNO/CNF arrays is capable of preventing particle agglomeration, improving the electronic conduction and enabling interspaces for the volumetric changes. Therefore, all of those excellent structural characteristics for the TNO/CNF electrode lead to its high-rate cycling stability and capacity retention ability.
4. Conclusions
In conclusion, we have proposed a new strategy for integrating TiNb2O7 into CNFs to form three-dimensional heterostructures of the TNO/CNF core/shell arrays as the anode material for lithium-ion batteries. The powerful conducive network has been built between the CNF arrays and TNO that provide comprehensive conductive pathways, the N-doped CNF layers on the TNO/CNF core/shell arrays provide more number of accessible channels for the transport of lithium ions and lower energy barrier. Also, the porosity of the TNO/CNF arrays after the TNO coating on the TNO/CNF arrays could not only serve as an electrolyte reservoir, but also ensure sufficient contact between electrolytes and TNO. Due to those excellent structural characteristics, the TNO/CNF electrode exhibits significantly superior electrochemical performance and high-rate capability (241 mA h g−1 at 10C, and 208 mA h g−1 at 20C). In addition, the TNO/CNF electrode maintains a reversible capacity of 153.6 mA h g−1 (with the capacity retention of 95%) after ultra-long life (5000 cycles). Our results show an effective way for producing high rate electrodes using high-power energy storage.Conflicts of interest
There are no conflicts to declare.Acknowledgements
The authors acknowledge the financial support from Natural Science Foundation of China (51502063), Project for guiding local Science and Technology development by the Central Government of China (ZY18C04), Fundamental Research Foundation for the Universities of Heilongjiang Province (LGYC2018JQ006), Harbin Funds for Distinguished Young Scientists (2017RAYXJ023) and Science Funds for Young Innovative Talents of HUST (201505).References
- J. Liu, A. Wei, M. Chen and X. Xia, J. Mater. Chem. A, 2018, 6, 3857–3863 RSC.
- M. Chen, W. Zhou, M. Qi, J. Yin, J. Yin, X. Xia and Q. Chen, J. Power Sources, 2017, 342, 964–969 CrossRef CAS.
- Y. Zhong, X. Xia, J. Zhan, X. Wang and J. Tu, J. Mater. Chem. A, 2016, 4, 11207–11213 RSC.
- M. Chen, K. Kou, M. Tu, J. Hu and B. Yang, Solid State Ionics, 2015, 274, 24–28 CrossRef CAS.
- K. Xu, Natl. Sci. Rev., 2017, 1, 23–24 Search PubMed.
- D. P. Abraham, E. M. Reynolds, E. Sammann, A. N. Jansen and D. W. Dees, Electrochim. Acta, 2005, 51, 502–510 CrossRef CAS.
- H. Li, L. Shen, P. Gang, F. Shan, H. Luo, Y. Kai and X. Zhang, Nanoscale, 2014, 7, 619–624 RSC.
- A. G. Ashish, P. Arunkumar, B. Babu, P. Manikandan, S. Sarang and M. M. Shaijumon, Electrochim. Acta, 2015, 176, 285–292 CrossRef CAS.
- X. H. Xia, S. Deng, S. Feng, J. B. Wu, J. Tu, X. H. Xia, S. Deng, S. Feng, J. B. Wu and J. Tu, J. Mater. Chem. A, 2017, 5, 21134–21139 RSC.
- H. Park, B. W. Hao, T. Song, W. D. L. Xiong and U. Paik, Adv. Energy Mater., 2015, 5, 1401945 CrossRef.
- M. Chen, D. Chao, J. Liu, J. Yan, B. Zhang, Y. Huang, J. Lin and Z. X. Shen, Adv. Funct. Mater., 2017, 27, 1606232 CrossRef.
- K. Amine, I. Belharouak, Z. Chen, T. Tran, H. Yumoto, N. Ota, S. T. Myung and Y. K. Sun, Adv. Mater., 2010, 22, 3052–3057 CrossRef CAS PubMed.
- N. Recham, J. N. Chotard, L. Dupont, C. Delacourt, W. Walker, M. Armand and J. M. Tarascon, Nat. Mater., 2010, 9, 68–74 CrossRef CAS PubMed.
- M. Chen, J. Zhang, Q. Chen, M. Qi and X. Xia, Mater. Res. Bull., 2016, 73, 459–464 CrossRef CAS.
- J. Zhang and A. Yu, Sci. Bull., 2015, 60, 823–838 CrossRef CAS.
- M. Chen, J. Zhang, X. Xia, M. Qi, J. Yin and Q. Chen, Mater. Res. Bull., 2016, 76, 113–117 CrossRef CAS.
- S. Jana, N. Singh, A. S. Bhattacharyya and G. P. Singh, J. Mater. Eng. Perform., 2018, 27, 1–6 CrossRef.
- Y. Qi, N. Du, H. Zhang, X. Fan, Y. Yang and D. Yang, Nanoscale, 2012, 4, 991–996 RSC.
- S. L. Candelaria, Y. Shao, Z. Wei, X. Li, X. Jie, J. G. Zhang, W. Yong, J. Liu, J. Li and G. Cao, Nano Energy, 2012, 1, 195–220 CrossRef CAS.
- M. Chen, X. Liang, F. Wang, D. Xie, G. Pan and X. Xia, J. Mater. Chem. A, 2019, 7, 6644–6650 RSC.
- V. Venkatachalam, A. Alsalme, A. Alswieleh and R. Jayavel, J. Mater. Sci.: Mater. Electron., 2018, 29, 6059–6067 CrossRef CAS.
- B. Guo, X. Wang, P. F. Fulvio, M. Chi, S. M. Mahurin, X. G. Sun and S. Dai, Adv. Mater., 2011, 23(40), 4661–4666 CrossRef CAS PubMed.
- C. Xiang, X. Zhao, L. Tan, J. Ye, S. Wu, S. Zhang and L. Sun, Nano Energy, 2019, 55, 269–276 CrossRef CAS.
- K. Tang, X. Mu, P. A. V. Aken, Y. Yan and J. Maier, Adv. Energy Mater., 2013, 3, 49–53 CrossRef CAS.
- F. Ling, X. Yun, W. Xiaofei, L. Yuling, X. Pu, D. Shuguang, S. Sergei and L. Hongmei, Nanoscale, 2013, 5, 11102–11107 RSC.
- H. Lei, C. Lin, C. Wang, Y. Chao, J. Li, Y. Chen and S. Lin, Funct. Mater. Lett., 2016, 09, 1642004 CrossRef.
- A. Vinu, K. Ariga, T. Mori, T. Nakanishi, S. Hishita, D. Golberg and Y. Bando, Adv. Mater., 2005, 17, 1648–1652 CrossRef CAS.
- M. Chen, J. Liu, W. Zhou, J. Lin and Z. Shen, Sci. Rep., 2015, 5, 10389 CrossRef PubMed.
- C. Hu, C. Yuan, A. Hong, M. Guo and X. Luo, Appl. Phys. Lett., 2018, 113, 041602 CrossRef.
- H. Y. Song, T. Fukutsuka, K. Miyazaki and T. Abe, Phys. Chem. Chem. Phys., 2016, 18, 27486 RSC.
- C. X. Wen, L. Yun, Y. Z. Zhang, P. He, K. L. Guo and T. Jing, Electrochim. Acta, 2018, 281, 323–328 CrossRef CAS.
Footnote |
| † Electronic supplementary information (ESI) available. See DOI: 10.1039/c9ra10485b |
| This journal is © The Royal Society of Chemistry 2020 |