
 Open Access Article
 This Open Access Article is licensed under a Creative Commons Attribution-Non Commercial 3.0 Unported Licence
Constructing a TiO2/PDA core/shell nanorod array electrode as a highly sensitive and stable photoelectrochemical glucose biosensor†
Wei Xua,
Wenke Yanga,
Hongkai Guoa,
Lianyuan Gea,
Jinchun Tu *a and
Chao Zhen*b
*a and
Chao Zhen*b
aState Key Laboratory of Marine Resource Utilization in South China Sea, College of Materials and Chemical Engineering, Hainan University, Haikou 570228, China. E-mail: tujinchun@hainu.edu.cn
bShenyang National Laboratory for Materials Science, Institute of Metal Research, Chinese Academy of Sciences, 72# Wenhua RD, Shenyang 110016, China. E-mail: czhen@imr.ac.cn
First published on 10th March 2020
Abstract
Developing stable PEC glucose biosensors with high sensitivity and low detection limit is highly desirable in the biosensor field. Herein, a highly stable and sensitive enzymatic glucose photoelectrochemical biosensor is rationally designed and fabricated by constructing TiO2/PDA core/shell nanorod arrays. The TiO2 nanorod as the core has the advantages of increasing charge transportation towards interfaces and enhancing the absorption of incident sunlight due to its single-crystal nature and one dimensional array structure. The PDA shell not only induces a rapid charge transfer across the interfaces but also stabilizes the biosensor performance by avoiding the decomposition of enzymes induced by the strong oxidizing holes from the TiO2 core. A remarkable performance with an ultrahigh sensitivity of 57.72 μA mM−1 cm−2, a linear range of 0.2–1.0 mM, a glucose detection limit of 0.0285 mM (S/N = 3) and a high sensitivity of 8.75 μA mM−1 cm−2 in a dynamic range of 1.0–6.0 mM were obtained for the glucose detection. This study might provide a strategy for constructing inorganic/organic core/shell structures with a satisfactory PEC performance.
1. Introduction
Glucose is a simple sugar that widely exists in the blood of living organisms. The efficient detection of glucose is important in terms of health applications.1–3 Photoelectrochemical (PEC) bioanalysis has emerged as a promising analytical technique for applications in numerous fields with special emphasis on immunoassays, enzymatic biosensing and cell-related detections due to its low cost, lower background interference and high sensitivity.4–7 Since the photoelectrode for PEC detection performs the tasks of capturing light, generating charge carriers and inducing surface chemical reactions, choosing suitable photoactive materials is critical for the construction of high-efficiency PEC biosensors. TiO2 with the merits of being non-toxic, with favorable band alignments, good stability, cost-effectiveness and biocompatibility, has been regarded as a promising candidate material for the construction of PEC biosensors.8–10 Its drawbacks include having a poor charge carrier transport ability and high oxidative activity of photogenerated holes as a result of the deep valence band edge position, which may lead to the decomposition of the target.11One-dimensional (1D) single crystal arrays, which favor electron transport along the axial direction and shorten the hole diffusion length towards the surface along the radial direction, have been considered as advantageous structures for PEC applications. A series of methods have been used to enhance the performance of PEC glucose biosensors based on 1D TiO2 single crystal arrays by constructing heterostructures to promote the charge separation (e.g., CdS/TiO2 heterostructure,12 Au@TiO2,13 and MoS2 nanosheet-TiO2 nanorod heterostructure14). The area and quality of the interface are two important factors affecting the performance of PEC glucose biosensors. 1D core–shell heterostructures have the advantage of achieving a full interface contact between two components along with unique optoelectronic properties15 to construct efficient PEC biosensors.16 Moreover, the shell can act as dispersant and intermediate layer,17 suppressing the aggregation of active materials. Considering the advantages of the 1D core/shell structure in improving charge transfer across interfaces, it is highly desirable to construct 1D core/shell structure-based PEC biosensors.
Poly-dopamine (PDA) as a p-type semiconductor18 contains the proper band edges to construct type II heterostructures using TiO2. The surface hydroxyl groups of TiO2 can react with the catechol groups of PDA to form a bridged bidentate bond as direct electron transfer channels between PDA and TiO2.19 Moreover, PDA as a p-type semiconductor provides a strong adsorption ability between the electrode materials and enzymes.20 Moreover, using PDA as a shell component not only promotes the separation of photogenerated charge carriers but also avoids the decomposition of enzymes induced by the high oxidative holes generated by the TiO2 core under light irradiation. Here, a photoelectrode based on TiO2/PDA core/shell nanorod arrays with rapid interface transfer has been constructed as a stable highly sensitive PEC glucose biosensor (Scheme 1). The resulting PEC biosensor can deliver an ultrahigh sensitivity of 57.72 μA mM−1 cm−2, a linear range of 0.2–1 mM with a glucose detection limit of 0.0285 mM (S/N = 3) and a high sensitivity of 8.75 μA mM−1 cm−2 for a dynamic range of 1–6 mM for glucose detection.
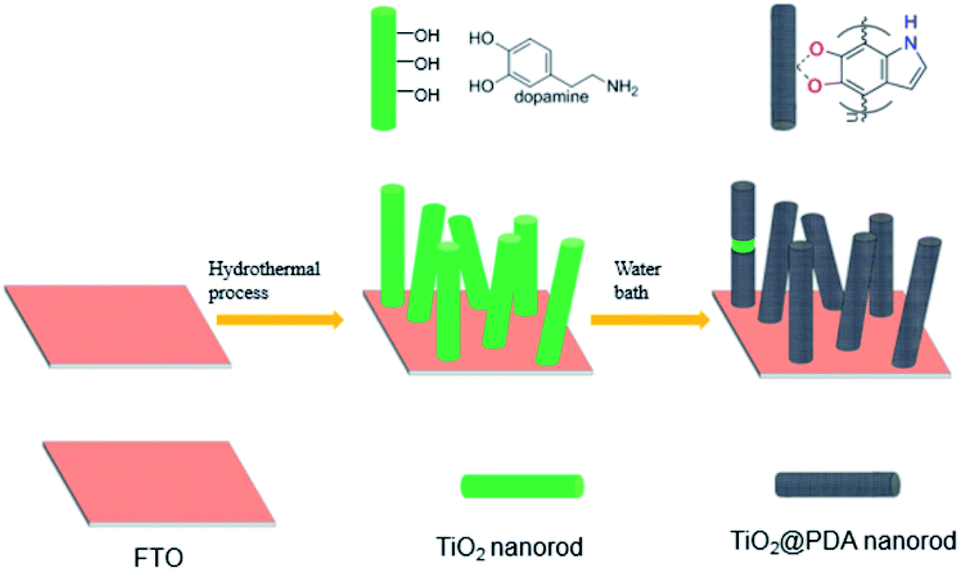 | ||
| Scheme 1 Diagram of the synthesis of TiO2/PDA core shell nanorod arrays on fluorine transparent oxide (FTO) glass substrates. | ||
2. Experimental
2.1 Fabrication of TiO2 nanorod arrays
Prior to the growth of TiO2 nanorod arrays, FTO glass substrates were ultrasonically cleaned in isopropanol, acetone and distilled water, each for 20 min. Nanorod arrays were grown referring to the previous report.21 In a typical process, the transparent precursor solution containing 13 mL of hydrochloric acid (38 wt%), 15 mL of deionized water and 440 μL of tetrabutyl titanate was transferred into a Teflon-lined autoclave with a volume of 50 mL and the FTO substrate was introduced in the solution. The autoclave was kept in an oven at 150 °C for 10 h. After cooling to room temperature, the FTO glass was rinsed with deionized water and ethanol several times. Finally, it was air-dried and annealed at 400 °C for 2 h with a heating rate of 2 °C min−1.2.2 Synthesis of TiO2/PDA core/shell nanorod arrays
The PDA shell was coated on TiO2 nanorods via an aqueous chemical growth method. 10 mg of hexamethylene tetraammine (HMTA) and 1 mg of dopamine hydrochloride were dissolved in 40 mL deionized water. 1 mL of this solution was dropwise added to 48 mL of deionized water under stirring, and the solution obtained was then transferred to a 50 mL conical flask. The FTO substrate-supported TiO2 nanorod arrays were put into the above conical flask, which was kept in a water bath at 90 °C for 3 h. After cooling to room temperature, the TiO2 nanorod arrays were rinsed with deionized water and dried in air. The PDA powder reference sample was synthesized using similar procedures without introducing the FTO substrate-supported TiO2 nanorod arrays.2.3 Fabrication of the PEC electrode
The glucose oxidase-modified TiO2/PDA biosensor was obtained as follows. 10 μL of a 10 mg mL−1 aqueous solution of glucose oxidase solution (glucose oxidase was dispersed in phosphate-buffered saline, pH = 7.4) was first stirred in a thermostatized oscillator at 4 °C for 4 h. Then, 10 μL of this solution was dropped on the FTO substrate-supported TiO2/PDA electrode and dried at 4 °C for 8 h.2.4 Characterization
X-ray diffraction (XRD) patterns were recorded on a diffractometer (BrukerD8) using Cu Kα as the irradiation source. The morphology of the PEC electrode was characterized via scanning electron microscopy using a microscope (Hitachi SU8010). The structure was determined via transmission electron microscopy (TEM) using a microscope (JEOL JEM 2100). UV-vis absorption spectra were recorded on a UV-vis absorption spectrophotometer (Persee, TU-1901). Fourier transform infrared (FTIR) spectra were recorded on a Bomem MB 100 FT-IR spectrometer (ABB Bomem, QC, Canada).2.5 PEC sensing measurements
PEC tests were performed in a three-electrode electrochemical system, where a Pt foil, glucose oxidase modified TiO2/PDA photoelectrode and Ag/AgCl electrode were used as the counter electrode, working electrode and reference electrode, respectively. Phosphate-buffered saline (PBS, pH = 7.4) was used as the electrolyte. PEC tests were performed on a CHI 660C workstation (CHI Instruments, Chenhua, Shanghai, China). The active area of the sensor exposed to the electrolyte is approximately 1 cm2. During the PEC tests, different volumes of glucose were injected into the electrolyte solution. The photoelectrode was illuminated under a Xe-lamp (AM 1.5 G, 100 mW cm−2). To optimize the photocurrent as well as to minimize possible side electrochemical reactions, a bias of 0.4 V (vs. Ag/AgCl) was applied.3. Results and discussion
Fig. 1a and b show typical top-view SEM images of the hydrothermally grown TiO2 nanorod arrays with different magnifications. The FTO substrate surface is uniformly covered with ordered nanorods. The nanorods have four smooth lateral surfaces and rough quasi-square top. The average width of the nanorods was around 100 nm. The image showing the cross-section view demonstrates that the nanorods intimately stand on the FTO substrate (Fig. 1c), facilitating the charge transport along the rod axis.22 Coating the nanorods with the PDA structure does not change the basic morphology of the nanorods but leads to smoother nanorod tops (Fig. 1d and e). The cross-section view of the resultant TiO2/PDA core/shell sample further demonstrates the preservation of the nanorods (Fig. 1f), suggesting that the PDA shell is uniformly coated on the TiO2 nanorods. The film thickness of both TiO2 and TiO2/PDA nanorods was measured to be ∼2.5 μm from their cross-section SEM images (Fig. 1c and f). The thin PDA shell is beneficial for immobilizing the enzyme.23 The crystal structure of the samples was studied by recording their XRD patterns (Fig. S1†). Diffraction peaks at 26.5, 33.8, 37.9, 51.7, 61.7 and 65.8 degrees are assigned to the rutile phase of SnO2 from the FTO substrates (JCPDS no. 77-0451). The diffraction peaks at 36.1, 54.3, 62.7, 69.0, 69.8 and 76.5 correspond to the rutile phase of TiO2 (JCPDS no. 02-0494). After modifying the PDA shell, no additional peak was detected due to its low loading amount and polymeric nature.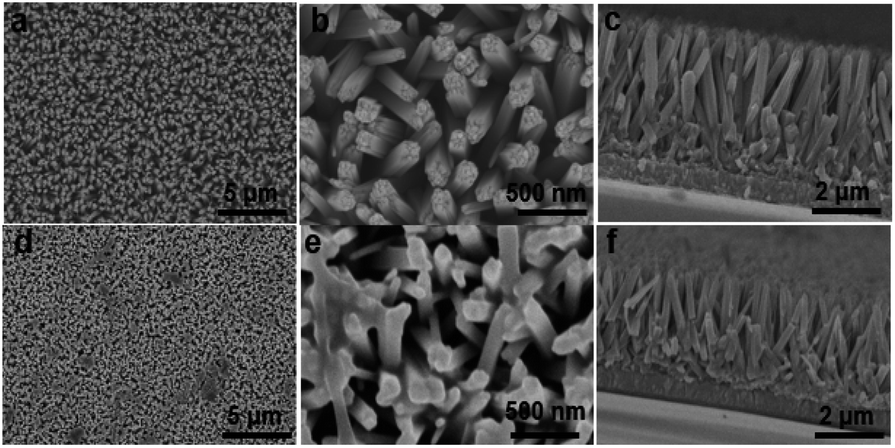 | ||
| Fig. 1 SEM images: (a and b) top-view of TiO2 nanorod arrays; (c) cross-section view of TiO2 nanorod arrays; (d and e) top-view of TiO2/PDA core/shell nanorod arrays; (f) cross-section view of TiO2/PDA core/shell nanorod arrays. | ||
In order to confirm the formation of the PDA shell, the microstructures of a single nanorod scrapped from the TiO2 and TiO2/PDA core/shell nanorod arrays were characterized via TEM. The TiO2 nanorod has a width of ∼100 nm (Fig. 2a), which is in accordance with the SEM results (Fig. 1b). The selected-area electron diffraction (SAED) pattern recorded from the TiO2 nanorod (the inset in Fig. 2a) shows periodic spots, indicating the single-crystalline feature of the as-prepared rutile TiO2 nanorods. This can be further demonstrated from the high-resolution TEM (HR-TEM) image (Fig. 2b). The width of the nanorod from the TiO2/PDA core–shell arrays becomes larger (Fig. 2c). Compared to the pristine one (Fig. 2b), the TiO2 nanorod is homogeneously coated with an amorphous PDA shell (Fig. 2d). The HR-TEM image reveals the high quality interface structure between the TiO2 core and the PDA shell. This is largely caused by strong interactions between the hydroxyl groups on the TiO2 surface and the catechol group of the DA unit, leading to the formation of a bridged bidentate bond between the TiO2 core and the PDA shell.24
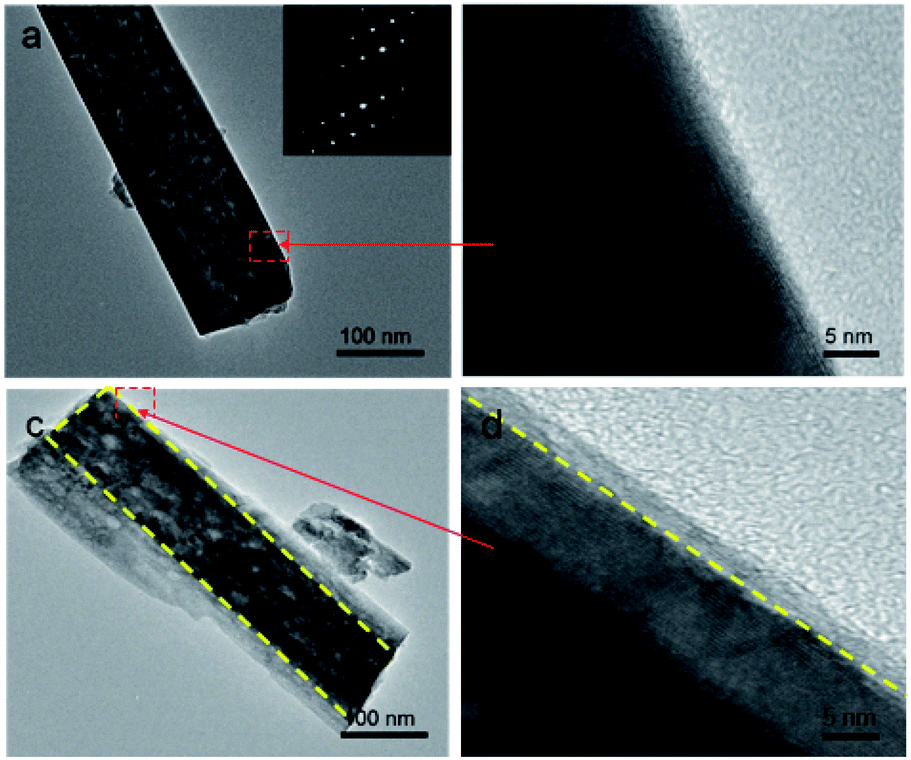 | ||
| Fig. 2 Low-magnification TEM images of a nanorod scraped from (a) pristine rutile TiO2 nanorod arrays (SAED in the inset) and (c) TiO2/PDA core/shell nanorod arrays; (b and d), enlarged images from the areas marked by the red rectangles in (a and c). | ||
To further confirm the nature of the amorphous PDA layer, Fourier transform infrared (FTIR) spectra of the PDA, TiO2 and TiO2/PDA core/shell nanorod arrays (Fig. 3a) were recorded. TiO2 nanorod arrays have an obvious band at 1633 cm−1, which is originated from the deformational vibration of the H–O–H bonds from absorbed water molecules.25 The peaks at 1508 cm−1 and 1607 cm−1 for the PDA sample correspond to the vibration models of indole or indoline structures in PDA.26 Moreover, the peak at 3410 cm−1 derived from the catechol OH group is also an evidence for the existence of PDA (Fig. S2†). Compared to TiO2, an additional sharp peak at 1384 cm−1, derived from the vibrations of CH or substituents of the benzene ring, is formed in the spectrum of the TiO2/PDA sample. In addition, the enhanced absorption peaks at around 1630 cm−1 and 3440 cm−1 suggest the increased absorption ability of water molecules from the TiO2/PDA sample. UV-vis absorption spectra of different samples are compared in Fig. 3b. A bandgap of ∼3.0 eV for the TiO2 sample was determined by plotting the Kubelka–Munk function versus the energy. The PDA sample has a strong absorption band in the range from 300 to 800 nm. This can be understood as the result of the p-conjugated polymer chains of PDA that facilitates the separation of the photogenerated carrier due to its high molar absorption coefficient in the wide spectral region of sunlight.27,28 The TiO2/PDA sample shows a slight absorption enhancement in the whole visible range. The intrinsic absorption edge of TiO2 shows no change with the introduction of PDA.
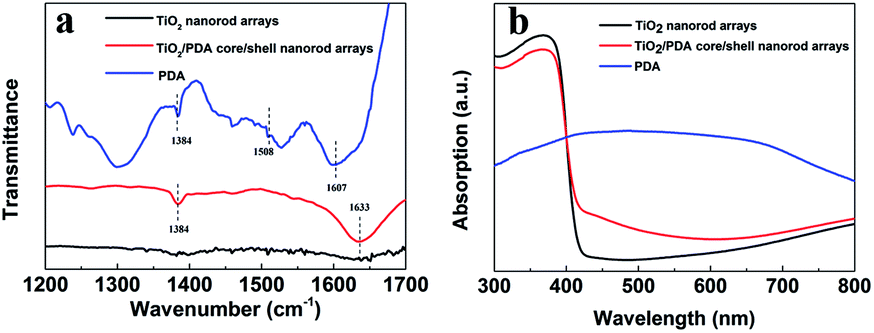 | ||
| Fig. 3 (a) FTIR spectra and (b) UV-vis absorption spectra of TiO2 nanorod arrays, PDA and TiO2/PDA core/shell nanorod arrays. | ||
In order to show the optimum potential better, first, we performed the J–V curve test within the potential range from −0.4 to 0.4 V (Fig. S3†). Subsequently, the photocurrent measurements of the TiO2 and TiO2/PDA electrodes were used to evaluate their potential as the PEC biosensors. As shown in Fig. 4a, both TiO2 and TiO2/PDA samples showed a negligible amount of current in dark, which means low-noise. The photocurrent density of TiO2 and TiO2/PDA electrodes experiences a substantial increase under illumination. The photocurrent density of the TiO2/PDA electrode is about twice as high as that of the TiO2 electrode. The great improvement of the photocurrent density stems from the introduction of the PDA shell that has formed the high-quality interface with the TiO2 core. The photoelectrons generated in the PDA shell can effectively be transferred from its conduction band to that of the TiO2 nanorod core due to the type II band edge alignment and strong chemical bonding dominating the interface structure. The photo-holes generated in the TiO2 nanorod core can effectively be transferred from its valence band (VB) to that of the PDA shell. These transfers promote an efficient separation of the photogenerated electrons and holes between the TiO2 core and the PDA shell. The results demonstrate the higher photosensitivity of the core–shell structure.
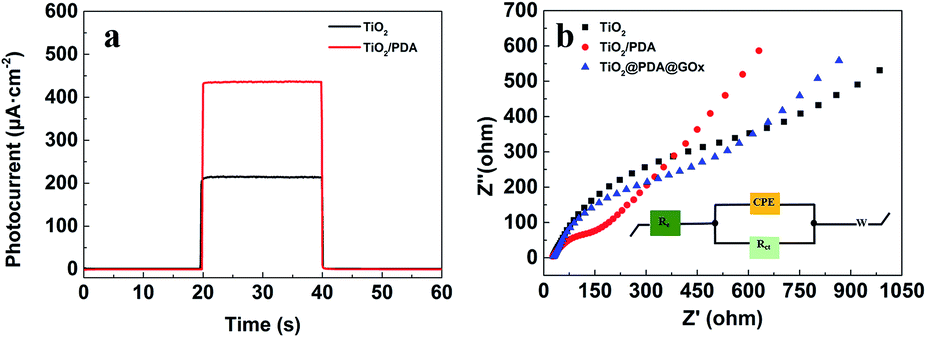 | ||
| Fig. 4 (a) Photocurrent response and (b) EIS Nyquist plots of TiO2 (black line) and TiO2/PDA (red line) samples in 0.1 M PBS (pH = 7.4) (the blue-dashed line is the EIS Nyquist plot of the photoelectrode). | ||
To get further insight into the dynamics of the charge transfer, electrochemical impedance spectroscopy (EIS) was performed on the different samples. The EIS measurements were conducted in a PBS buffer within a frequency range from 100 kHz to 0.1 Hz, and an AC perturbation of 36 mV (Fig. 4b). Nyquist EIS spectra are commonly composed of two parts. One is a semicircle at a high frequency region that reflects the charge transfer process. Its radius is defined as the transfer resistance (Rct) across interfaces. The other is a line plot at a lower frequency range that corresponds to the diffusion process.29 The equivalent circuit (the inset in Fig. 4b) is used to fit the Nyquist plots recorded from different samples, where Re is the system resistance, CPE represents the capacitive phase at the interface between the electrolyte and photoelectrode, the Rct stands for the charge carrier transfer resistance across the interface, and W is the diffusion resistance. The fitted Rct (403.8 Ω) of the TiO2 sample is much larger than that of the TiO2/PDA sample (65.9 Ω). The Rct (234.4 Ω) of the glucose oxidase modified TiO2/PDA sample is much smaller than that of the TiO2 sample, indicating that the introduction of the PDA shell facilitates the charge carrier transfer process and enhances the reaction kinetics due to the intimate interface between the PDA shell and the TiO2 core by forming a bridged bidentate bond to effectively reduce the interface resistance.
Fig. 5a displays the chronoamperometric Δi–t response of the glucose oxidase modified TiO2/PDA electrode at 0.4 V (vs. Ag/AgCl) in a buffered solution of different glucose concentrations under continuous stirring (the unabridged chronoamperometric i–t response of the electrode is given in Fig. S4†). Fig. 5c shows that the glucose oxidase modified TiO2/PDA electrode exhibits a good photocurrent response to the detection of glucose in the concentration range of 0.2–1 mM with an ultra-sensitivity of 57.72 μA mM−1 and a low detection limit of 0.0285 mM. The limit of detection (LOD) was calculated through the formula, LOD = 3Sb/S (where Sb is the standard deviation of 10 blank measurements and S is the sensitivity). The limit of quantification (standard deviation of 10 blank measurements/sensitivity) was estimated to be 0.095 mM.30,41 However, pure TiO2 nanorod array electrodes (Fig. S5†) have a much lower detection sensitivity of 20.85 μA mM−1 in the same detection range and the higher detection limit of 0.081 mM (S/N = 3) for glucose. Interestingly, there are two linear ranges of the glucose oxidase modified TiO2/PDA electrode for quantifying glucose in the concentration range from 0.2–1.0 mM and 1.0–6.0 mM (Fig. 5b). The linear dependence of the oxidation currents on the glucose concentration from 0.2 to 1.0 mM and from 1.0 to 6.0 mM in Fig. 5c and d, display a correlation coefficient (R2) of 0.9971 and 0.9901, respectively. The sensitivity for this electrode was determined to be 57.72 μA mM−1 and 8.75 μA mM−1, respectively. The limit of detection (LOD) for glucose detection was calculated to be 0.0285 mM (S/N = 3), suggesting an excellent PEC performance of the sensors. The presence of two linear regions may be ascribed to the adsorption of intermediates. Under the condition of low glucose concentrations, the linear relationship shows a steep slope because the glucose molecules can freely diffuse towards the electrode. In contrast, under the condition of a high glucose concentration, the interactions between glucose molecules become stronger, decreasing the curve slope.31
 | ||
| Fig. 5 (a) Chronoamperometric Δi–t response of the glucose oxidase modified TiO2/PDA electrode to the glucose at different concentrations in phosphate buffer at 0.4 V; (b) calibration curves of glucose concentration and photocurrent density; (c) and (d) are two linear curves within different glucose concentration ranges shown in (b). | ||
The stability of the glucose oxidase-modified TiO2/PDA-based PEC biosensor was evaluated by recording the time-dependent photocurrent for 10 light irradiation on/off cycles in the presence of 1 mM glucose, as shown in Fig. 6a. The enediol ligands of PDA have a high stability toward oxidation after forming the bidentate bonds with TiO2 nanorods, thus the degradation of PDA can be avoided.32 These results show the high stability of the photocurrent of the glucose oxidase-modified TiO2/PDA (TiO2/PDA/GOx)-based PEC biosensor. In contrast, a significant photocurrent attenuation for glucose oxidase-modified TiO2 nanorod arrays is observed in the time-dependent photocurrent because of the photogenerated holes that have a strong oxidation ability in TiO2 and cause the deactivation of the enzyme (Fig. S6†). To explore the specificity of the PEC biosensor, several interfering compounds, such as ascorbic acid (AA), dopamine (DA), NaCl and uric acid (UA) were introduced along with glucose (Glu), as displayed in Fig. 6b. The PEC biosensor shows an excellent anti-interference performance. Comparison of the analytical performance of the PEC glucose biosensors listed in Table 1 shows acceptable results in terms of the linear relationship range and detection sensitivity.
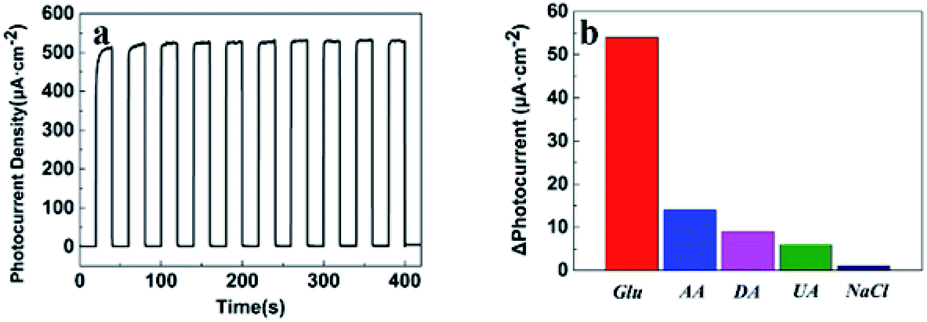 | ||
| Fig. 6 (a) Stability test of the glucose oxidase modified TiO2/PDA electrode at the concentration of 1 mM glucose; (b) amperometric response of the glucose oxidase modified TiO2/PDA electrode to the addition of glucose (Glu, 1 mM); ascorbic acid (AA, 0.1 mM); dopamine (DA, 0.1 mM); uric acid (UA, 0.1 mM) and NaCl (0.1 mM). All tests were performed at an applied voltage of 0.4 V in 0.1 M of PBS (pH = 7.4). | ||
| GOx PEC biosensors | Dynamic range (mM) | Detection limit (mM) | Sensitivity (μA mM−1 cm−2) | Reference |
|---|---|---|---|---|
| TiO2/PDA/GOx | 0.2–1, 1.00–6.00 | 0.0285 | 57.72, 8.75 | This work |
| GOx/SnS2/Nafion/GCE | 0.025–1.10 | 0.01 | 7.6 | 37 |
| ITO/MoS2-TiO2/GOx | 0.100–10.0 | 0.015 | 0.81 | 14 |
| ITO/SnO2/Ag2S/GOx | 0.100–12.2 | 0.032 | 0.029 | 38 |
| Nafion/GOx/Ag-Pdop@CNT/GCE | 0.050–1.10 | 0.017 | 3.1 | 39 |
| GOx/TCS-TiO2/chitosan/GCE | 0.005–1.32 | 0.002 | 23.2 | 40 |
| ITO/TiO2-Co3O4-CNT-GOx | 0.000–4.00 | 0.00016 | 0.3 | 41 |
The excellent behavior of the glucose oxidase-modified TiO2/PDA-based biosensor is attributed to the following plausible mechanism shown in Scheme 2. The PDA absorbs photons with enough energy to induce a π–π* transition under the irradiation of light. The electrons in the excited-state jump from the highest occupied molecular orbital (HOMO) of PDA to its lowest unoccupied molecular orbital (LUMO). The conduction band potential (ECB) of the rutile TiO2 is about −0.3 eV (vs. NHE), whereas the LUMO potential of PDA is −1.468 eV (vs. NHE).33,34 Therefore, the photogenerated electrons in the HOMO of PDA flow thermodynamically quicker to the conduction band of the rutile TiO2. The single crystalline nature of rutile TiO2 nanorods and their good contact with the FTO substrate is favorable for electron transport.35 The electrons of the TiO2 nanorods are transferred to the FTO substrate. Moreover, in contrast to the slow kinetic process between TiO2 and glucose oxidase, PDA is a p-type semiconductor18 that induces a fast kinetic transfer at the interface between the glucose oxidase and PDA.36 Hence, the photogenerated holes left in PDA can quickly transfer to glucose oxidase. Subsequently, glucose is oxidized to gluconic acid by glucose oxidase. The PDA shell in high HOMO level can avoid the oxidation and deactivation of enzymes. The mechanism proposed above is the basis for developing a stable inorganic/organic core/shell heterostructure-based PEC glucose biosensor with high sensitivity.
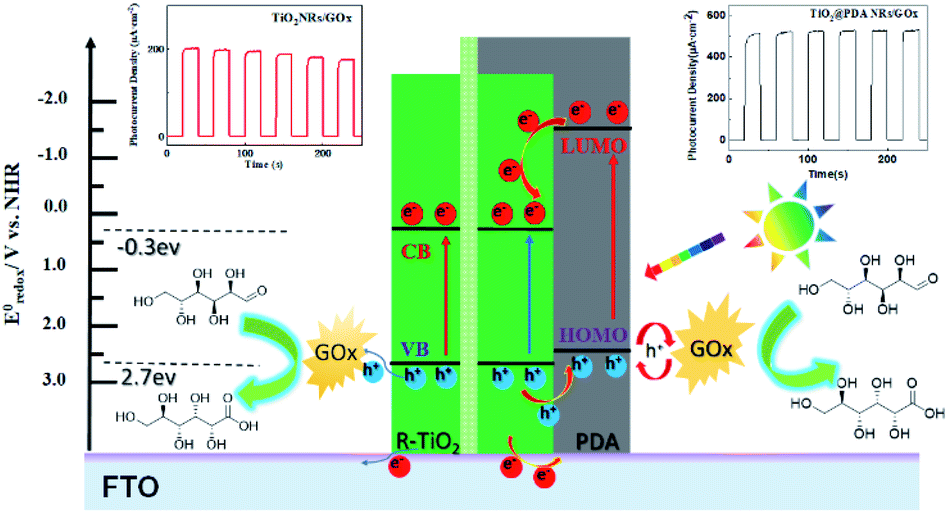 | ||
| Scheme 2 Mechanism of the PEC detection of glucose at glucose oxidase-modified TiO2 (left panel) and TiO2/PDA (right panel) electrodes. | ||
4. Conclusions
An excellent enzymatic glucose photoelectrochemical biosensor was constructed through the formation of TiO2/PDA core/shell nanorod arrays, where PDA acts as a “bridge” to induce bidirectional quick transfers at the interfaces. Compared to the biosensor of TiO2 nanorod arrays, the PEC biosensor of the TiO2/PDA core/shell displays a significantly enhanced photocurrent intensity and better performance in the detection of glucose. A remarkable performance with a sensitivity of 57.72 μA mM−1 cm−2, a linear relationship range of 0.2–1 mM with a detection limit of 0.0285 mM (S/N = 3) in the wide dynamic range of 1–6 mM, with a sensitivity of 8.75 μA mM−1 cm−2 were obtained for glucose detection. PDA plays an important role in inducing the rapid transfer of photogenerated charge carriers at the interfaces of the TiO2 and enzyme. Moreover, the PDA as shell do not only enhance the biosensor performance but also stabilizes it by avoiding the deactivation of enzymes resulting from the strong oxidative holes generated in TiO2. The core/shell structure with an excellent biocompatibility and effective separation efficiency of photogenerated carriers might be applied to other important biological interactions such as cell analysis.Conflicts of interest
There are no conflicts to declare.Acknowledgements
The authors thank Prof. Gang Liu (Institute of Metal Research, Chinese Academy of Sciences) for providing constructive and valuable suggestions on this work. This research was financially supported by the Key Research and Development Project of the Hainan Province (No. ZDYF2018106) and the National Natural Science Foundation of China (No. 51762012).Notes and references
- J. Wang, Chem. Rev., 2008, 108, 814–825 CrossRef CAS PubMed.
- R. A. Doong and H. M. Shih, Biosens. Bioelectron., 2010, 25, 1439–1446 CrossRef CAS PubMed.
- P. Si, S. Ding, J. Yuan, X. W. Lou and D.-H. Kim, ACS Nano, 2011, 5, 7617–7626 CrossRef CAS PubMed.
- W. W. Zhao, J. J. Xu and H. Y. Chen, Chem. Soc. Rev., 2015, 44, 729–741 RSC.
- L. Wang, M. Wei, X. Gu, Y. Zhao and Y. Qiang, J. Electron. Mater., 2018, 47, 6540–6550 CrossRef CAS.
- K. Zhao, X. Yan, Y. Gu, Z. Kang, Z. Bai, S. Cao, Y. Liu, X. Zhang and Y. Zhang, Small, 2016, 12, 245–251 CrossRef CAS PubMed.
- Z. Kang, X. Yan, Y. Wang, Y. Zhao, Z. Bai, Y. Liu, K. Zhao, S. Cao and Y. Zhang, Nano Res., 2016, 9, 344–352 CrossRef CAS.
- A. Fujishima and K. Honda, Nature, 1972, 238, 37–38 CrossRef CAS PubMed.
- M. Dahl, Y. Liu and Y. Yin, Chem. Rev., 2014, 114, 9853–9889 CrossRef CAS PubMed.
- J. Bai and B. Zhou, Chem. Rev., 2014, 114, 10131–10176 CrossRef CAS PubMed.
- N. Smirnoff, New Phytol., 1993, 125, 27–58 CrossRef CAS.
- H. Huo, Z. Xu, T. Zhang and C. Xu, J. Mater. Chem. A, 2015, 3, 5882–5888 RSC.
- L. Guo, Z. Li, K. Marcus, S. Navarro, K. Liang, L. Zhou, P. D. Mani, S. J. Florczyk, K. R. Coffey, N. Orlovskaya, Y.-H. Sohn and Y. Yang, ACS Sens., 2017, 2, 621–625 CrossRef CAS PubMed.
- X. Liu, X. Huo, P. Liu, Y. Tang, J. Xu, X. Liu and Y. Zhou, Electrochim. Acta, 2017, 242, 327–336 CrossRef CAS.
- W. Smith, A. Wolcott, R. C. Fitzmorris, J. Z. Zhang and Y. Zhao, J. Mater. Chem., 2011, 21, 10792–10800 RSC.
- W. Li, A. Elzatahry, D. Aldhayan and D. Zhao, Chem. Soc. Rev., 2018, 47, 8203–8237 RSC.
- C. Guo, H. Huo, X. Han, C. Xu and H. Li, Anal. Chem., 2014, 86, 876–883 CrossRef CAS PubMed.
- H. J. Nam, J. Cha, S. H. Lee, W. J. Yoo and D.-Y. Jung, Chem. Commun., 2014, 50, 1458–1461 RSC.
- M. Zhao, Y. Gao, J. Sun and F. Gao, Anal. Chem., 2015, 87, 2615–2622 CrossRef CAS PubMed.
- H. Lee, S. M. Dellatore, W. M. Miller and P. B. Messersmith, Science, 2007, 318, 426–430 CrossRef CAS.
- B. Yan, Y. Zhuang, Y. Jiang, W. Xu, Y. Chen, J. Tu, X. Wang and Q. Wu, Appl. Surf. Sci., 2018, 458, 382–388 CrossRef CAS.
- J. H. Bang and P. V. Kamat, Adv. Funct. Mater., 2010, 20, 1970–1976 CrossRef CAS.
- J. Li, X. Li, Q. Zhao, Z. Jiang, M. Tadé, S. Wang and S. Liu, Sens. Actuators, B, 2018, 255, 133–139 CrossRef CAS.
- S.-C. Li, L.-N. Chu, X.-Q. Gong and U. Diebold, Science, 2010, 328, 882–884 CrossRef CAS PubMed.
- S.-J. Bao, C. M. Li, J.-F. Zang, X.-Q. Cui, Y. Qiao and J. Guo, Adv. Funct. Mater., 2008, 18, 591–599 CrossRef CAS.
- D. R. Dreyer, D. J. Miller, B. D. Freeman, D. R. Paul and C. W. Bielawski, Langmuir, 2012, 28, 6428–6435 CrossRef CAS PubMed.
- Y. Yang and W. Hu, Talanta, 2017, 166, 141–147 CrossRef CAS PubMed.
- H. J. Nam, B. Kim, M. J. Ko, M. Jin, J. M. Kim and D.-Y. Jung, Chem.–Eur. J., 2012, 18, 14000–14007 CrossRef CAS PubMed.
- X. Kang, J. Wang, H. Wu, I. A. Aksay, J. Liu and Y. Lin, Biosens. Bioelectron., 2009, 25, 901–905 CrossRef CAS PubMed.
- B. Çakıroğlu and M. Özacar, Biosens. Bioelectron., 2019, 141, 111385 CrossRef PubMed.
- J. C. Ndamanisha and L. Guo, Bioelectrochemistry, 2009, 77, 60–63 CrossRef CAS PubMed.
- T. Rajh, L. X. Chen, K. Lukas, T. Liu, M. C. Thurnauer and D. M. Tiede, J. Phys. Chem. B, 2002, 106, 10543–10552 CrossRef CAS.
- X. Zhou, B. Jin, J. Luo, X. Xu, L. Zhang, J. Li and H. Guan, RSC Adv., 2016, 6, 64446–64449 RSC.
- F. Yu, S. Chen, Y. Chen, H. Li, L. Yang, Y. Chen and Y. Yin, J. Mol. Struct., 2010, 982, 152–161 CrossRef CAS.
- Q. Zhang, S. Yodyingyong, J. Xi, D. Myers and G. Cao, Nanoscale, 2012, 4, 1436–1445 RSC.
- G. Bagdžiūnas, Š. Žukauskas and A. Ramanavičius, Biosens. Bioelectron., 2018, 102, 449–455 CrossRef PubMed.
- Z. Yang, Y. Ren, Y. Zhang, J. Li, H. Li, X. H. X. Hu and Q. Xu, Biosens. Bioelectron., 2011, 26, 4337–4341 CrossRef CAS PubMed.
- X. Zhang, M. Liu, H. Liu and S. Zhang, Biosens. Bioelectron., 2014, 56, 307–312 CrossRef CAS PubMed.
- Y. Wang, L. Liu, M. Li, S. Xu and F. Gao, Biosens. Bioelectron., 2011, 30, 107–111 CrossRef CAS PubMed.
- Z. Yang, Y. Tang, J. Li, Y. Zhang and X. Hu, Biosens. Bioelectron., 2014, 54, 528–533 CrossRef CAS PubMed.
- B. Çakıroğlu and M. Özacar, Biosens. Bioelectron., 2018, 119, 34–41 CrossRef PubMed.
Footnote |
| † Electronic supplementary information (ESI) available: XRD patterns and FTIR spectra of the TiO2 nanorod arrays and TiO2/PDA core/shell nanorod arrays; chronoamperometric i–t response of glucose oxidase modified TiO2/PDA electrode to glucose; chronoamperometric i–t response of the glucose oxidase modified TiO2 electrode and its calibration curve; stability test of the glucose oxidase modified TiO2/PDA electrode. See DOI: 10.1039/c9ra10445c |
| This journal is © The Royal Society of Chemistry 2020 |