 Open Access Article
Silk/polyols/GOD microneedle based electrochemical biosensor for continuous glucose monitoring†
Liang Zhao,
Zhuangzhuang Wen,
Fujian Jiang,
Zhaozhu Zheng * and
Shenzhou Lu
 *
*
National Engineering Laboratory for Modern Silk, College of Textile and Clothing Engineering, Renai Road, Suzhou Industrial Park, Suzhou, Jiangsu, P. R. China 215123. E-mail: zzzheng@suda.edu.cn; lushenzhou@suda.edu.cn
First published on 10th February 2020
Abstract
This work illustrates the feasibility of a microneedle based electrochemical biosensor for continuous glucose monitoring. The device consists of three silk/D-sorbitol pyramidal microneedles integrated with platinum (Pt) and silver (Ag) wires and immobilized glucose selective enzyme (glucose oxidase, GOD) during fabrication. The silk/D-sorbitol composite can provide a biocompatible environment for the enzyme molecules. The break strength can be controlled by the ratio of silk to D-sorbitol, which guarantees microneedle penetrate into skin. The enzymatic-amperometric responses and glucose concentration were linearly correlated, and cover physiological conditions. The microneedle displays high stability both in long-term monitoring and storage, even at 37 °C. Our results reveal that this new microneedle biosensor is a promising tool for wearable minimally invasive continuous glucose monitoring in practical applications.
Introduction
Diabetes mellitus (DM) represents a major health issue related to insulin deficiency or resistance.1–3 Diabetes affects approximately 382 million people in the world,4,5 including over 150 million people in China. The number of affected individuals is on the rise and patient age is decreasing. Hence, extensive demands exist for convenient and precise glucose measuring devices that can provide trustworthy data for insulin injection or medicine administration. To this effect, several methods have been developed based on optical or electrochemical transdermal biosensing systems. Fingerstick blood samples are typically used to monitor blood glucose concentration. Colorimetric microfluidic paper-based analytical devices (μPADs) play a crucial role in glucose monitoring because they are economical, simple, portable, disposable, and potentially applicable in easy and instrument-free glucose concentration quantification.6 Nevertheless, colorimetric glucose detection has the following shortcomings: they are insensitive; they are unsuitable for operations in coloured samples; they require a low background surface; and they produce variable results in environmental lighting. Under this context, to improve the performance regarding sensitivity, selectivity, and capability in complicated matrices, electrochemical analytical devices are utilized to provide quantitative detection. These devices satisfy the needs for glucose control, but fail to avoid pain associated with the finger prick.Minimally invasive microneedle biosensors are cost-effective, can perform self-testing analyses while avoiding sweat collection.7 In a crucial example of continuous glucose monitoring (CGM) systems,7–9 Sharma et al.10 describe a subcutaneously inserted electrochemical biosensor. The surface of a solid microneedle was modified to include glucose oxidase (GOD) as a glucose biosensor. Microneedle electrodes were inserted into the skin to monitor glucose levels in real-time. Due to the instability of electrochemical reactions, these devices are influenced by signal drifts that cause time lags and require sensor replacement at intervals of 3–7 days. Hence, there is an unsatisfied need to develop minimally invasive CGM systems for diabetes care that are capable of precisely measuring glucose concentrations for long periods of time,11 while requiring less calibration and replacement.
To overcome the instability of electrochemical biosensors, in this paper, we demonstrate a microneedle-based biosensor based on silk/D-sorbitol. As a micron-sized economical device,12,13 microneedles can physically disrupt the skin's outer layer to access the interstitial fluid (ISF) with inappreciable damage or pain.14 Additionally, silk fibroin (silk) is a type of non-toxic, non-irritating, biocompatible, degradable, and non-immunogenic biomedical material.15–17 It has been used as a surgical suture for over 100 years. Silk can be induced to be water insoluble without any cross-linking agents. Primary efforts have been spared on utilizing such materials for drug- or vaccine-related transdermal delivery, and for activating detection-labels in blood and enzymes.18,19 The unique aggregation structure of the silk matrix allows it to maintain molecular activity for long periods of time, even at extreme conditions, such as high temperatures. Recent studies have promoted the advancement of microneedle technology.13 These attempts to develop microneedles have concentrated mainly on minimally invasive drug delivery.
This work illustrates one instance of a microneedle-based minimally invasive biosensor for CGM in the ISF, in which the microneedle current changes in response to variations in glucose concentration. This study addresses the need for developing minimally invasive CGM systems for diabetes care that are capable of precisely measuring glucose concentration for long periods of time, while requiring less calibration and fewer replacements.
Results and discussion
Principle and design of the microneedle biosensor
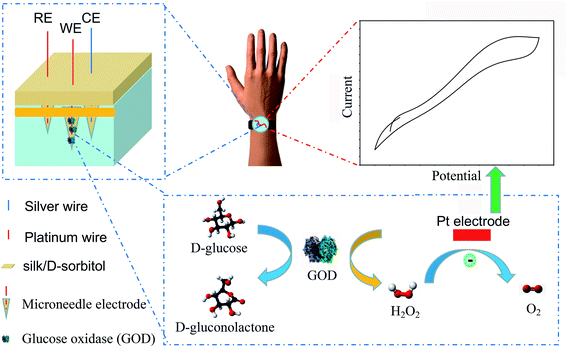
The new microneedle-based glucose biosensor system was constructed by using a hollow microneedle array template, which were in a pyramidal shape. Pt and Ag wires (40 μm diameter) were immobilized in silk/D-sorbitol composite during fabrication to create the working electrode (WE), counter electrode (CE) and reference electrode (RE), respectively (Scheme 1). The WE transducer was functionalized by immobilizing GOD in microneedle integrated Pt wire. Silk/D-sorbitol provided a stable and biocompatible environment for the enzyme molecules.18,19 The hydrogen peroxide (H2O2), generated by the GOD catalysed oxidation of glucose in WE, was transported to Pt electrode. The H2O2 concentration is then anodically detected at the surface of a pt WE, thus providing a current proportional to the initial glucose concentration, as showed in Scheme 1.Characterization of the microneedle biosensor
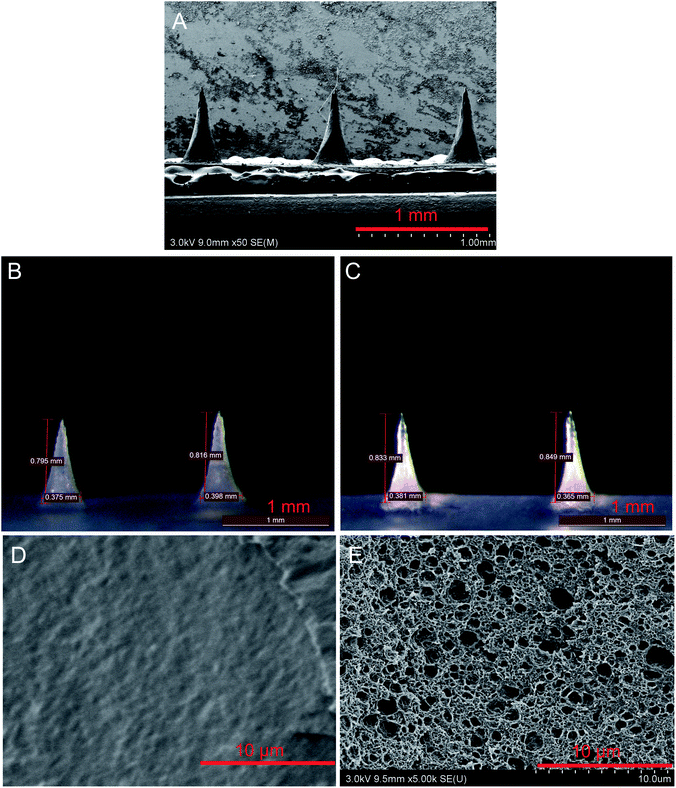
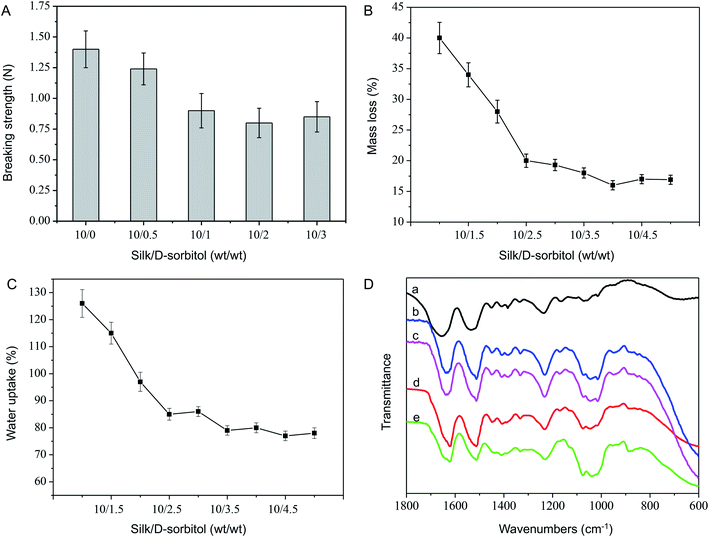
In order to get bio-signal, the microneedle should be sharp and sufficiently strong to penetrate the skin without breaking. Fig. 1 displayed the optical and SEM images of the resulting electrode microneedles. The microneedles averaged 800 μm in length. Only about 1/3 of the total microneedles could prick into the skin.20 Therefore, an electrode with a 800 μm microneedle was appropriate for bio-signal recording. Fig. 1A and B illustrates the SEM and optical images of microneedles. The tips of the microneedles were extremely sharp, which is beneficial for reducing the force required to pierce the skin and, thus, the pain perceived by individuals during the piercing process. The mechanical performance of as prepared microneedles was evaluated by assessing the relationship between the ratio of silk/D-sorbitol (Fig. 2A). The initial breaking strength of microneedle were around 1.4 ± 0.15 N to 0.8 ± 0.12 N, which were strong to penetrate the skin without breaking.21It is compulsory for the microneedle to be adequately stable in fluid. In order to estimate the in-fluid stability of microneedle, the microneedles with different silk/D-sorbitol ratio were incubated in ISF (pH 7.4), at 37 °C for 24 hours, and the morphology, mass loss, water uptake and increase in volume of microneedles were tested. Microneedle showed high shape fidelity (Fig. 1C), with increase of volume less than 9% (7.86%), which was important for continues working. Fig. 2B and C showed a statistical decrease in mass loss and water uptake, from 10/0 to 10/2.5. Further increase D-sorbitol the mass loss and water uptake became less. This is thought to be due to the secondary structure changing after D-sorbitol treaded. Further FTIR analysis of microneedles showed the amide I band (1600–1500 cm−1) provided an estimate of the β-sheet (crystalline) structure in the silk materials, and shifted from 1654 cm−1 in the newly prepared electrostatic spinning nanofibers to 1620 cm−1 (Fig. 2D), indicating a β-sheet conformation after adding D-sorbitol. This result was somewhat unexpected as mass loss may case GOD lose from microneedle, water uptake, and increase in volume may case mechanical property decreasing of microneedle. But it is interesting, there showed a lot of pores from 500 nm to 2 μm in diameter (Fig. 1E), while it is solid before incubation. That was important to mass diffusion during glucose detection. Considering the change tend of these three properties, m(silk)![[thin space (1/6-em)]](https://www.rsc.org/images/entities/char_2009.gif) :
:![[thin space (1/6-em)]](https://www.rsc.org/images/entities/char_2009.gif) m(D-sorbitol) = 10
m(D-sorbitol) = 10![[thin space (1/6-em)]](https://www.rsc.org/images/entities/char_2009.gif) :
:![[thin space (1/6-em)]](https://www.rsc.org/images/entities/char_2009.gif) 3 was selected for further reaching.
3 was selected for further reaching.
Electrochemical performance of the microneedle biosensor
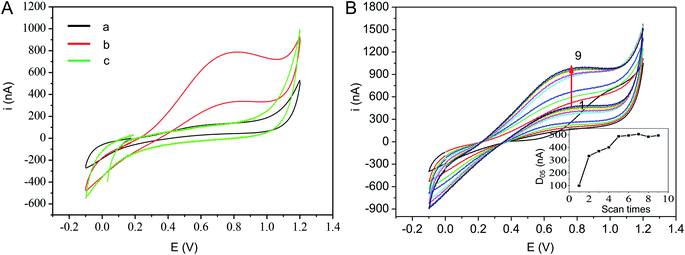
Primary electrochemical investigations were performed to characterize the response of the un-immobilized GOD microneedle electrode integrated with Pt wires towards glucose. The cyclic voltammograms (CV) profile on microneedle with or without 11.1 mM glucose in ISF was scanned, ranging from −0.1 V to 1.2 V, at a scan rate of 100 mV s−1 (Fig. 3A). There was no current that occurred on the un-immobilized GOD microneedle with glucose (cycle b) and immobilized GOD microneedle without glucose. In contrast, for GOD-immobilized microneedle, the current rapidly increased when the potential changed between 0 V and +0.70 V. This indicated that the response of the enzyme electrode was caused by the electrochemical oxidation of the detectable byproduct of the GOD reaction and the Pt wire transducer's catalytic activity. Fig. 3B showed first nine CV curves of a freshly prepared microneedle electrode. Peak value of current (at working potential of 0.7 V) increased rapidly upon cycles from 1st to 5th, then increased slowly from 5th to 9th. Thus, the 5th cycle was chosen for subsequent experimental data calculation. Although, scan times of achieving balance current for different microneedles electrodes were almost same, peak value of current were varying a lot. Difference current value (D05) between forward scan current (Cf) and backward scan current (Cb) at 0.7 V were almost same (Fig. S1†). So, D05 can calculated for the first 5th after the of enzyme reaction using the following equation:| D05 = Cf − Cb | (1) |
To calculate the diffusion coefficient, the microneedle electrode's redox reaction was measured in an 11.1 mM glucose solution in PBS by CV scans at different rates (20, 40, 60, 80, 100, 150, and 200 mV s−1). Moreover, Fig. S2† showed CV and the scan rates and D05. Apparently, the anodic peak's electric current increased with the increase of scan rates, and the D05 were linearly positively correlated with scan rates. Considering current stability, 100 mV s−1 was selected for glucose detection.
The maximum reaction rate due to glucose diffusion, enzymatic reaction, and product diffusion. Therefore, the sensitivity and the linear range of the sensing was attempted to be further improved by GOD loading, beside ratio of silk/D-sorbitol. Different microneedles with various amounts of GOD (0–1000 U mL−1) were prepared, and kinetic curves for different samples with varying amounts of glucose (2.5, 5, or 10 mM glucose) were obtained (Fig. 4). From data, we can get: first, when the GOD concentration ranged between 0–200 U mL−1, the D05 increased with an increase in glucose. This tendency is due to the fact that the enzymatic product increased. Second, future increase in GOD concentration did not affect D05. The D05 didn't increase with the increase amount of GOD. Enzymatic product limited by glucose concentration and diffusion. The enzyme didn't reach maximum reaction rate, in group 2.5 mM. When glucose concentration was 5 mM or higher, glucose diffusion and concentration achieved a balance. The D05 didn't increase with the increase glucose concentration and amount of GOD.
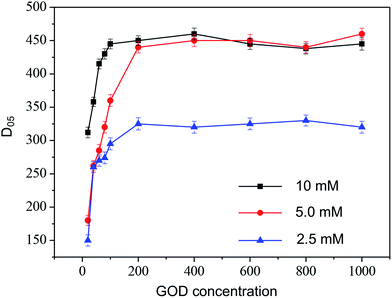 | ||
| Fig. 4 Corresponding calibration curve between current change of microneedle electrode with different amount of GOD (20–1000 U mL−1 GOD in mixture during preparation) in artificial ISF with 2.5, 5, 10 mM glucose. Experimental conditions same as Fig. 3. | ||
In other words, during incubation, the microneedle swelled and glucose diffused into the microneedle, hydrolyzed enzymatically into the H2O2 product, which then diffused to the Pt electrode and generated current. However, the permeability of glucose and H2O2 in the silk/D-sorbitol composite was limited.
From the data, we concluded the following: in the dry state, the microneedles have enough breaking strength to pierce the skin. Once immersed in the ISF, D-sorbitol and some silk diffused from microneedle resulting mass loss, microneedle uptake water, increase in volume and inner pores formation increased its permeability to glucose and H2O2. In the wet state, microneedles remained strong enough to retain their shape and connect the loop to produce a current. Combined with the reduced loss of silk-immobilized enzyme, the microneedle biosensor can continuously monitor glucose concentration for long periods of time and ensure accurate and effective data detection.
Work conditions of the microneedle biosensor
To find a glucose biosensor with high performance, a low limit in detection, great sensitivity, and a wide detection range, test conditions for glucose assays, like pH and electrolyte temperature, were studied by changing the experimental variable while keeping the other variables fixed and the results were shown in Fig. 5A and B, respectively. pH influence was studied by varying the pH of the artificial ISF in the range from 6 to 9 by using phosphate buffers. The optimum pH and temperature of microneedle electrode biosensor were found to be 7.0 and 35 °C, both close to human physiological conditions.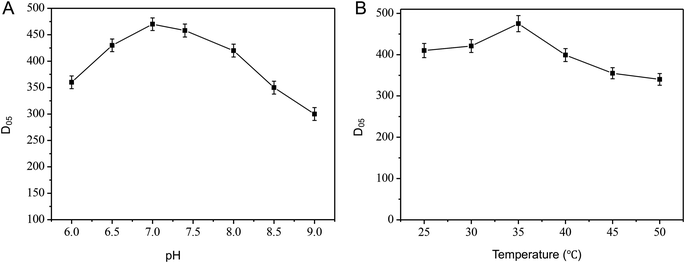 | ||
| Fig. 5 Effect of different pH (A) and temperature (B) on microneedle electrode (200 U mL−1 GOD in mixture during preparation). Experimental conditions same as Fig. 3. | ||
In vitro evaluation of the microneedle biosensor
The performances of the as prepared microneedle electrode biosensors were recorded at optimized condition. The calibration curve for glucose detection in artificial ISF, shown in Fig. 6, shows an extended linear range from 1.7 to 10.4 mM glucose, with calibration plot: y = 31.70x + 199.16, R = 0.996 (n = 5) (Fig. 6). This linearly range was the most significant range, it covered the usual human physiological range in blood and body fluid, and peak value 10 mM, after a meal for 2 hours. In the high glucose concentration range (over 10.4 mM, inset of Fig. 6), D05 did not change with glucose concentration, due to diffusion of glucose and enzymatic product in microneedle (Fig. 4).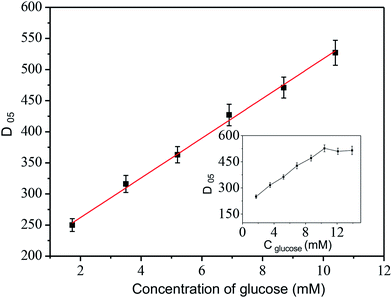 | ||
| Fig. 6 Calibration curve performed with microneedle electrode in artificial ISF. Experimental conditions same as Fig. 3. | ||
Long-term operational stability and storage stability of the biosensor
Stability was prerequisite factor for real-time, long-term glucose monitoring from the body. The decrease of the signal mostly resulted from the loss of enzyme activity.22 The stability of the microneedle-based glucose biosensor was examined for 10 measurements at different time intervals (1, 2, 3, 4, 5, 7, 9, 11, 13, 24 hours) over a period of 24 hours in artificial ISF. Fig. 7A illustrated that this experiment produced glucose signals that were highly reproducible. The microneedles-based biosensor showed a signal remain of its initial response of more than 90% after 24 hours (97.2%, 93.6% at 25, 37 °C).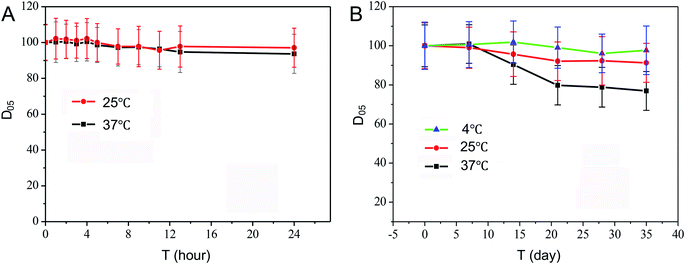 | ||
| Fig. 7 Stability measurements carried out over a period of 24 hours interval monitoring (A) and 35 days storage (B). Experimental conditions same as Fig. 3. | ||
The storage stability of the glucose biosensor at different temperatures was also investigated every week (Fig. 7B). These data indicate the stability of the microneedle biosensor was temperature dependent. After 5 weeks' storage, microneedle electrode showed a signal remain about 97.7%, 91.3%, 76.9% for 4, 25, 37 °C respectively. This demonstrated that the microneedle biosensor was sufficiently stable for long-time monitoring. Table 1 reviewed microneedle electrode materials and comparison of the results obtained with microneedles for bio-signal collection reported in literature. These examples demonstrated that many researches had been concerted on the development of long-term detection systems, including cross-linking with glutaraldehyde,23 mixing with BSA before including cross-linking with glutaraldehyde,24 drop-casting,14 layer assembly modify electrode.14,25–30 As we can see, linear detection cover physiological range could achieve, but long-term monitoring and store stability is definitely lower than that obtained with silk/D-sorbitol microneedle. Silk is a unique protein biopolymer, with six hydrophobic to one hydrophilic amino acid. Enzyme could be entrapped into nanoscale pocket during reverse parallel crystalline domain folding. This unique matrix can protect enzyme from temperature and moisture. This demonstrates that the microneedle biosensor was sufficiently stable for long-term monitoring. What more, the present study demonstrated that silk/D-sorbitol microneedle prepared without the need of additional cross-linking agent (Nafion), also, superior to many microneedles developed by using synthetic polymers (poly(o-phenylenediamine), polyester, Eshell 200 acrylate-based polymer). Since chemical crosslinkers have biosafety issues after implantation, and unclear degradation products of polymer may cause inflammation as well. Long-term stability of the blood glucose biosensor is greatly advantageous for obtaining precise measurements of the glucose concentration for long time periods while requiring less calibration and replacement. Thus, the silk/D-sorbitol microneedle electrode system developed in this study offered a new option for the future wearable minimally-invasive biosensors research and device development.
| Electrode material | Modify | Sensing bio-molecular | Linear range (mM) | Enzyme | Long-time monitor | Signal left compare original | Storage stability | Signal left compare original (%) | References |
|---|---|---|---|---|---|---|---|---|---|
| a GA: glutaraldehyde, AOx: alcohol oxidase, CS: chitosan, OPH: organophosphorus hydrolase, MWCNTs: multiwalled carbon nanotubes, MB: methylene blue, LOX: enzyme lactate oxidase, SS: stainless steel, PNP: p-nitrophenol, OPH: o-phenylene diamine, TTF: tetrathiafulvalene, RT: room temperature, TYR: enzyme tyrosinase, acrylate-based: Eshell 200 acrylate-based polymer, EnvisionTEC GmbH: Eshell 200 acrylate-based polymer, PPD: a poly(o-phenylenediamine) film, LOx: lactate oxidase, FCA: ferrocene carboxylic acid, ISE: ion-selective-electrode, VF: vinylferrocene, MWCNT: multiwalled carbon nanotubes. H-PG: highly porous gold electrodes, FcSH: 6-(ferrocenyl) hexanethiol, FADGDH: flavin adenine dinucleotide glucose dehydrogenase. | |||||||||
| Rhodium on carbon-EnvisionTEC GmbH-LOx | Surface modify | L-Lactic acid | 0–500 | LOx | 2h | 109.7% | — | — | 2011 (ref. 31) |
| EnvisionTEC GmbH-PPD-GluOx/GOD | Surface modify | Glutamate | 0–140 | GluOx/GOD | 8h | 97% | — | — | 2011 (ref. 32) |
| Carbon-polyester-GOx-lactate oxidase | Surface modify | Glucose/lactate | — | GOx/lactate oxidase | 24h | — | — | — | 2012 (ref. 33) |
| Bioanode: SS-carbon paste/GOx/TTF bioanode cathode: SS-carbon paste/Pt | Surface modify | Glucose | 5–25 | GOD | 60 h | 75% | 1 week | 70 | 2014 (ref. 25) |
| Porous carbon-nickel-k+ membrane | Surface modify | K+ | 0.1–10 | ISE | — | — | — | — | 2014 (ref. 34) |
| VF-silicon/glass-GOX/LOX-diacrylate | Surface modify | Glucose/lactic acid | All 0–1 | GOX/LOX | — | — | — | — | 2016 (ref. 35) |
| SS-carbon paste -OPH-Nafion | Surface modify | PNP | 20–180 | OPH | 2 | RSD = 5% | — | — | 2017 (ref. 26) |
| Pt-OPD-AOx-CS-Nafion | Surface modify | Alcohol | 0.05–0.4 | AOx | 100 min | RSD = 2.85% | — | — | 2017 (ref. 14) |
| CGM-GOx-BSA-GA | Surface modify | Glucose | Up to 14 | GOD | 4 days | — | 3 months | — | 2018 (ref. 24) |
| Carbon/catechol gel/bandage | Surface modify | TYR | 0.015–0.079 | — | — | 7 days | — | 2018 (ref. 31 and 36) | |
| Titanium/platinum/silver-polycarbonate structures-FCA-GOD | Surface modify | Glucose | — | GOD | 6h | (Bring it an hour early) | — | — | 2018 (ref. 37 and 38) |
| Au-MWCNTs-MB-LOX | Surface modify | Lactate | 0.01–0.2 | LOX | — | — | 30 days | 10 | 2019 (ref. 27) |
| H-PG-FcSH-FADGDH | Surface modify | Glucose | 0.1–10 | FADGDH | 30 days | — | — | Falling 20% | 2019 (ref. 39) |
| Gold-polycarbonate-MWCNT-MB-FADGDH | Surface modify | Glucose/lactic acid | 0.01–0.1 | FADGDH/LOX | — | — | — | — | 2019 (ref. 40) |
Experimental
Raw silk was purchased from Suzhou SOHO Biomaterials Science and Technology Co., Ltd. Lithium bromide (LiBr) was obtained from Shandong Tiancheng Chemical Co., Ltd. GOD (Type X-S, EC 1.1.3.4, 250 units per mg, from Aspergillus niger), bovine serum albumin (BSA), Slide-a-Lyzer dialysis bag (MWCO 8–12 kDa) was purchased from Shanghai Puyi Biotechnology Co., Ltd. China. Platinum (Pt) and silver (Ag) wires, and D(+)-glucose were all bought from Sigma-Aldrich. D-sorbitol and the remaining chemical reagents were all bought from SLRC Laboratory Animal Co., Ltd. All reagents were used without further purification. Deionized (DI) water collected from a purification system (Millipore Milli-Q, 18.2 MΩ cm at 25 °C) was utilized to prepare the aqueous solutions.Preparation of silk/polyols microneedle biosensor
By degumming silk fibers in 0.3% (w/v) Na2CO3/0.1% (w/v) NaHCO3 solution, silk was purified; then, it was dissolved in LiBr solution, as reported previously.41 In brief, we boiled silk fibers in 0.02 M sodium carbonate solution (98–100 °C, 30 minutes), washed three times in ultrapure water, and then drained and dehydrated in a fume hood for a whole night. To obtain a 20% concentration, we dissolved the dried fibers in 9.3 M LiBr solution in a 15![[thin space (1/6-em)]](https://www.rsc.org/images/entities/char_2009.gif) :
:![[thin space (1/6-em)]](https://www.rsc.org/images/entities/char_2009.gif) 100 bath ratio (w/v) (60 °C, 4 hours). The solution underwent dialysis against pure water to get rid of the LiBr (30 hours), using a Slide-a-Lyzer dialysis bag (Shanghai Puyi Biotechnology Co., Ltd.; China, MWCO 8–12 kDa). Subsequently, centrifugation was performed to remove insoluble fibrous debris. Finally, purified silk of approximately 6–8 wt% concentration was made.
100 bath ratio (w/v) (60 °C, 4 hours). The solution underwent dialysis against pure water to get rid of the LiBr (30 hours), using a Slide-a-Lyzer dialysis bag (Shanghai Puyi Biotechnology Co., Ltd.; China, MWCO 8–12 kDa). Subsequently, centrifugation was performed to remove insoluble fibrous debris. Finally, purified silk of approximately 6–8 wt% concentration was made.
The silk/polyols microneedles were prepared similarly to those used in our early report,21 integrating by platinum and silver wires along with GOD immobilized in work electrode. Platinum and silver wires (D = 0.04 mm) were boiled in 4 M sodium hydroxide solution for 20 minutes, 10 M nitric acid solution for 20 minutes, sonicated in DI water (40 °C) for 30 minutes, successively, before fabrication.
6% (w/v) silk was mixed with 30% (w/v) D-sorbitol and 7500 U mL−1 GOD (no GOD in RW and CW) in a 15 mL conical tube (for the details see Tables S1 and S2 in ESI†). Then, the mixture was cast into microneedle arrays, which were hollow and pyramid-shaped. The hollow microneedles were 800 μm long. The treated Pt or Ag wire was inserted into the mold and allowed to dry in the hood.
Characterization of the microneedle biosensor
| Water uptake = (mD − mS)/mS × 100 | (2) |
The formula used to calculate the increase of volume was:
| Increase of volume = (VD − VS)/VS × 100 | (3) |
Electrochemical performance
In vitro artificial ISF was used to assess the electrochemical performance of the microneedle system after swelling for 5 minutes. Electrochemical measurements utilized for the electrochemical investigations were collected via a PGSTAT302N electrochemical workstation (Autolab, Switzerland) integrated with a PC.Stability of microneedle biosensors
Conclusions
The present study has demonstrated the design and performance of a microneedle-based electrochemical biosensor for minimally-invasive continuous monitoring of glucose. GOD was immobilized in silk/D-polyols matrix and display high stability: less than 7% decrease of initial response after continuous monitoring over 24 hours. Only 2.3%, 8.7%, 23.1% decrease in response, after 35 days' storage at 4, 25, 37 °C respectively. The enzymatic–amperometric responses and glucose concentration was linear correlation within 1.7–10.4 mM L−1. This biosensor offers the advantages of fast and facile preparation, quick response at low glucose concentrations, as well as easy readouts in situations concerning physiology.Conflicts of interest
There are no conflicts to declare.Acknowledgements
The work was supported by National Natural Science Foundation of China (Grant No. 51373114), Six Talent Peaks Project in Jiangsu Province (Grant No. SWYY-038), PAPD, Nature Science Foundation of Jiangsu, China (Grant No. BK20171239, BK20191191) and Natural Science Foundation of Suzhou City Jiangsu Province, China (Grant No. SYN201849).Notes and references
- A. T. Kharroubi and H. M. Darwish, World J. Diabetes, 2015, 6, 850–867 CrossRef PubMed.
- J. J. M. Peñalver, I. M. Timón, C. S. Collantes and F. J. C. Gómez, World J. Diabetes, 2016, 7, 22–63 Search PubMed.
- P. Z. Zimmet, D. J. Magliano, W. H. Herman and J. EShaw, Lancet Diabetes Endocrinol., 2014, 2, 56–64 CrossRef PubMed.
- L. M. Wang, P. G. Gao and M. Zhang, JAMA, 2017, 317, 2515–2523 CrossRef PubMed.
- R. L'Heveder and T. Nolan, Diabetes Res. Clin. Pract., 2013, 101, 349–351 CrossRef PubMed.
- V. Scognamiglio and F. Arduini, TrAC, Trends Anal. Chem., 2019, 120, 1–15 CrossRef.
- H. Lee, Y. J. Hong and S. Baik, Adv. Healthcare Mater., 2018, 7, 1–14 Search PubMed.
- Z. J. Yang, X. C. Huang, R. C. Zhang, J. Li, Q. Xu and X. Y. Hu, Electrochim. Acta, 2012, 70, 325–330 CrossRef CAS.
- Y. Song, H. Y. Liu, Y. Wang and L. Wang, Anal. Methods, 2013, 5, 4165–4171 RSC.
- S. Sharma, A. El-Laboudi, M. Reddy, N. Jugnee, S. Sivasubramaniyam, M. E. Sharkawy, P. Georgiou, D. Johnston, N. Oliver and A. E. G. Cass, Anal. Methods, 2018, 10, 2088–2095 RSC.
- D. L. Harris, M. R. Battin, P. J. Weston and J. E. Harding, J. Pediatr., 2010, 157, 209–210 CrossRef PubMed.
- P. Bollell, S. Sharm, A. E. G. Cas and R. Antiochi, Biosens. Bioelectron., 2018, 123, 152–159 CrossRef PubMed.
- N. Vasylieva, S. Marinesco, D. Barbier and A. Sabac, Biosens. Bioelectron., 2015, 72, 148–155 CrossRef CAS PubMed.
- A. M. V. Mohan, J. RayWindmiller, R. K. Mishra and J. Wang, Biosens. Bioelectron., 2017, 91, 574–579 CrossRef CAS PubMed.
- J. Melke, S. Midha, S. Ghosh, K. Ito and S. Hofmann, Acta Biomater., 2016, 31, 1–16 CrossRef CAS PubMed.
- L. D. Koh, Y. Cheng, C. P. Teng, Y. W. Khin, X. J. Loh, S. Y. Tee, M. Low, E. Ye, H. D. Yu, Y. W. Zhang and M. Y. Han, Prog. Polym. Sci., 2015, 46, 86–110 CrossRef CAS.
- S. U. D. Wani and G. H. Veerabhadrappa, Curr. Drug Targets, 2017, 19, 1177–1190 CrossRef PubMed.
- S. Z. Lu, X. Q. Wang, Q. Lu, X. Hu, N. Uppal, F. G. Omenetto and D. L. Kaplan, Biomacromolecules, 2009, 10, 1032–1042 CrossRef CAS PubMed.
- S. Z. Lu, X. Q. Wang, N. Uppal, D. L. Kaplan and M. Z. Li, Front. Mater. Sci., 2009, 3, 367–373 CrossRef.
- Y. W. Sun, L. Ren, L. l. Jiang, Y. Tang and B. Liu, Sensors, 2016, 16, 908–920 CrossRef PubMed.
- S. Y. Wang, M. M. Zhu, L. Zhao, D. J. Kuang, S. C. Kundu and S. Z. Lu, ACS Biomater. Sci. Eng., 2019, 5, 1887–1894 CrossRef CAS.
- E. W. Nery and L. T. Kubota, J. Pharmaceut. Biomed. Anal., 2016, 117, 551–559 CrossRef CAS PubMed.
- Q. L. Yang, P. Atanasov and E. Wilkins, Sens. Actuators, B, 1998, 46, 249–256 CrossRef CAS.
- F. Ribet, G. Stemme and N. Roxhed, Biomed. Microdevices, 2018, 20, 101 CrossRef PubMed.
- G. V. Ramírez, Y. C. Li, J. Kim, W. Z. Jia, A. J. Bandodkar, R. N. Flores, P. R. Miller, S. Y. Wu, R. Narayan, J. R. Windmiller, R. Polsky and J. Wang, Electrochem. Commun., 2014, 47, 58–62 CrossRef.
- R. K. Mishra, A. M. V. Mohan, F. S., R. C. and J. Wang, Analyst, 2017, 142, 918–924 RSC.
- P. Bollella, S. Sharma, A. E. G. Cass and R. Antiochia, Biosens. Bioelectron., 2019, 123, 152–159 CrossRef CAS PubMed.
- S. A. Zaidi and J. H. Shin, Talanta, 2016, 149, 30–42 CrossRef CAS PubMed.
- Y. X. Hu, R. Liu, W. Zhang and K. X. Xu, Spectrosc. Spectral Anal., 2017, 37, 491–496 CAS.
- K. Hyun, S. W. Han, W. G. Koh and Y. Kwon, Int. J. Hydrogen Energy, 2015, 40, 2199–2206 CrossRef CAS.
- J. R. Windmiller, N. D. Zhou, M. C. Chuang, G. Valdes-Ramirez, P. Santhosh, P. R. Miller, R. Narayan and J. Wang, Analyst, 2011, 136, 1846–1851 RSC.
- J. R. Windmiller, G. Valdés-Ramírez, N. Zhou, M. Zhou, P. Miller, S. Brozik, R. Polsky, E. Katz, R. Narayan and J. Wang, Electroanalysis, 2011, 23, 2302–2309 CrossRef CAS.
- P. R. Miller, S. A. Skoog, T. L. Edwards, D. M. Lopez, D. R. Wheeler, D. C. Arango, X. Y. Xiao, S. M. Brozik, J. Wang, R. Polsky and R. J. Narayan, Talanta, 2012, 88, 739–742 CrossRef CAS PubMed.
- P. R. Miller, X. Y. Xiao, L. Brener, D. B. Burckel, D. R. Narayan and E. R. Polsky, Adv. Healthcare Mater., 2014, 3, 876–881 CrossRef CAS PubMed.
- A. Calio, P. Dardano, V. D. Palma, M. F. Bevilacqua, A. D. Matteo, H. I. Uele and L. D. Stefano, Sens. Actuators, B, 2016, 236, 343–349 CrossRef CAS.
- B. Ciui, A. Martin, R. K. Mishra, B. Brunetti, T. Nakagawa, T. J. Dawkins, M. Lyu, C. Cristea, R. Sandulescu and J. Wang, Adv. Healthcare Mater., 2018, 7, 1–9 Search PubMed.
- P. Bollella and L. Gorton, Curr. Opin. Electrochem., 2018, 10, 157–173 CrossRef CAS.
- S. Sharma, Z. Y. Huang, V. Rogers, M. Boutelle and A. E. G. Cass, Anal. Bioanal. Chem., 2016, 408, 8427–8435 CrossRef CAS PubMed.
- P. Bollella, S. Sharma, A. E. G. Cass, F. Tasca and R. Antiochia, Catalysts, 2019, 9, 1–14 CrossRef.
- P. Bollella, S. Sharma, A. E. G. Cass and R. Antiochia, Electroanal, 2019, 31, 374–382 CrossRef CAS.
- D. N. Rockwood, R. C. Preda, T. Yucel, X. Q. Wang, D. L. Lovett and D. L. Kaplan, Nat. Protoc., 2011, 6, 1612–1631 CrossRef CAS PubMed.
Footnote |
| † Electronic supplementary information (ESI) available. See DOI: 10.1039/c9ra10374k |
| This journal is © The Royal Society of Chemistry 2020 |

