 Open Access Article
Real-time and non-destructive hydrocarbon gas sensing using mid-infrared integrated photonic circuits
Tiening Jina,
Junchao Zhoua and
Pao Tai Lin *abc
*abc
aDepartment of Electrical and Computer Engineering, Texas A&M University, College Station, Texas 77843, USA. E-mail: paolin@ece.tamu.edu
bDepartment of Materials Science and Engineering, Texas A&M University, College Station, Texas 77843, USA
cCenter for Remote Health Technologies and Systems, Texas A&M University, College Station, Texas 77843, USA
First published on 19th February 2020
Abstract
A chip-scale mid-infrared (mid-IR) sensor was developed for hydrocarbon gas detection. The sensor consisted of amorphous Si (a-Si) optical ridge waveguides that were fabricated by complementary metal–oxide–semiconductor (CMOS) processes. The waveguide exhibited a sharp fundamental mode through λ = 2.70 to 3.50 μm. Its sensing performance was characterized by measuring methane and acetylene. From the spectral mode attenuation, the characteristic C–H absorption bands associated with methane and acetylene were found at λ = 3.29–3.33 μm and λ = 3.00–3.06 μm, respectively. In addition, real-time methane and acetylene concentration monitoring was demonstrated at λ = 3.02 and 3.32 μm. Hence, the mid-IR waveguide sensor enabled an accurate and instantaneous analysis of hydrocarbon gas mixtures.
1. Introduction
Hydrocarbons are molecules consisting of carbon, hydrogen, and oxygen atoms. Hydrocarbons have different chemical and physical properties depending on their molecular structures and chemical bonds.1,2 Various hydrocarbon gases, such as methane (CH4), ethane (C2H6), ethylene (C2H4), and acetylene (C2H2), are the major components of natural gas. In addition to petroleum, hydrocarbon gases are extensively used in chemical syntheses and semiconductor processes. On the other hand, they react to form ground-level ozone in the atmosphere and become the major component of smog, which result in the greenhouse effect. In addition, the inhalation of hydrocarbon gases may pose several health risks, with short-term exposure potentially causing dizziness, intoxication, irritations, and anesthesia. Thus, the monitoring of hydrocarbon gases is not only essential in industry but is also critical in the prevention of pollution.Various sensing methods have been explored to detect hydrocarbon gases, including catalysis, electro-chemistry, ultrasonics, semiconductors, and infrared absorption.3–7 In the oil industry, catalytic-type combustible sensors have been used to detect flammable hydrocarbon gas leaks. However, they have several drawbacks, such as sensor degradation and malfunction due to the harsh environments and frequently require oxygen to maintain detection accuracy.8,9 Solid-state sensors based on metal-oxide semiconductors (MOS) have shown high sensitivity and fast response times since their conductivity changes in the presence of an analyte gas. However, MOS sensors have poor selectivity and suffer from interference caused by background gases, such as ozone, water, and volatile organic compounds (VOCs).10–12 Another commonly used method, gas chromatograph (GC), is based on identifying the flow rate of analyte gas. However, GC requires an operation temperature that can exceed 150 °C to prevent the condensation of the gas compounds inside the device, which cause instability during the gas analysis because of thermal crosstalk. Moreover, the GC instrument are bulky and expend excessive amounts of energy, rendering them impractical for portable, on-site, and continuous gas detection.13–19 Therefore, it is critical to discover new sensing platforms that can detect hydrocarbon gases in a chip scale, with high specificity and sensitivity, and be compatible with CMOS for large volume manufacturing. A promising approach to achieve in situ and multiple hydrocarbon gas detection is mid-IR spectroscopy. Mid-IR is a spectral regime between wavelengths λ = 2.5 μm and 20 μm that overlap with the characteristic absorptions of various molecules, including CO2, CH4, NO, HCN, SO2, and VOCs. As such, mid-IR measurements provide both detection specificity and sensitivity for accurate and in-parallel gas identification. Hence, gas tracing through the mid-IR detection technique has been widely applied in the oil industry, as well as in environmental monitoring.20–28 Presently, however, acquiring infrared absorption spectra requires Fourier transform infrared spectroscopy (FTIR) or diffraction grating monochromators, both of which are benchtop instruments and thus are not suitable for portable or remote gas measurements. Alternatively, recent work in mid-IR planar photonics has shown that real-time detection on-a-chip is possible.28,29 Devices like pedestal waveguides, micro-ring resonators, and opto-nanofluidics were able to recognize various chemicals by analyzing the spectral attenuation of the waveguide modes.
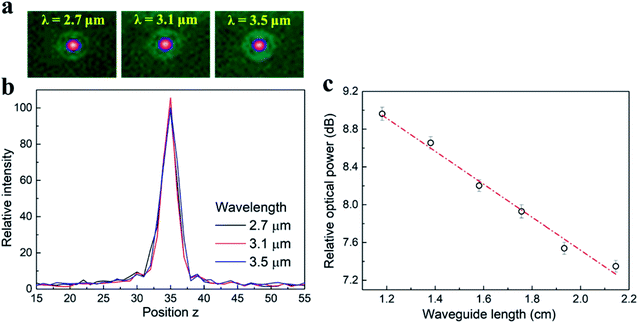
In this work, we propose integrated Si photonic circuits for the detection of important hydrocarbon gases, CH4 and C2H2. CH4 is the most common hydrocarbon gas used for domestic and commercial heating, and it is additionally used as an efficient cooking fuel worldwide. C2H2 is the simplest alkyne, and its worldwide production (over 150 million tons each year) exceeds that of any other organic compound.30,31 The photonic circuits were developed based on a-Si ridge waveguides, which were fabricated through the conventional CMOS process. Comparing to a rib waveguides, a ridge waveguide has a stronger evanescent field that increases the interaction between the probe mid-IR light and the molecules surrounding the waveguide surface, thus providing a higher sensitivity. The waveguide structures and mode profiles were designed and calculated by the two-dimensional finite difference method (FDM). Strong evanescent fields were observed on the top surface of the waveguide, which are critical for hydrocarbon gas detection. From the optical characterization, a bright and sharp waveguide mode was observed and a low optical loss of 1.74 dB cm−1 was obtained. To evaluate the sensing performance of the waveguide device, a test platform was built with a tunable mid-IR light, multiple gas injection system, and mid-IR signal detector. Gas detection was accomplished by correlating the waveguide spectral attenuation with the characteristic gas absorption bands. The fabricated mid-IR waveguide sensor was able to perform real-time analysis and monitoring of hydrocarbon gas mixtures.
2. Experimental
2.1 Device fabrication
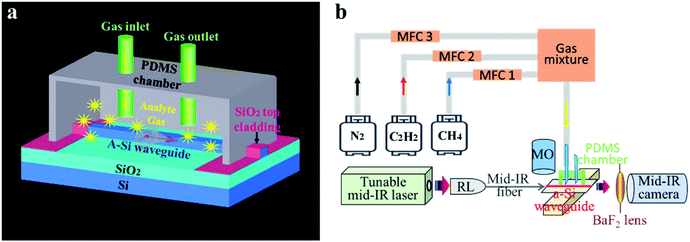
As shown in Fig. 1a, the device mainly consists of two parts: an a-Si ridge waveguide and a (polydimethylsiloxane) PDMS micro-gas chamber. When the hydrocarbon gases were injected into the PDMS chamber, the mid-IR light going through the waveguide was absorbed by the analytes according to their C–H bond vibration mode. In the fabrication process, first, a 1 μm thick a-Si thin film was deposited on the Si wafer that had a 3 μm thick SiO2 layer prepared by plasma-enhanced chemical vapor deposition (PECVD). The precursor gas for the a-Si deposition was SiH4, and the deposition temperature was 200 °C. Then, a 50 nm thick layer of Cr mask was patterned onto the a-Si layer by lithography, electron beam evaporation, and lift-off process, sequentially. The waveguide structure was transferred to the a-Si layer by reactive ion etching (RIE). SF6 was used for selective Si etching. Finally, the Cr mask and the organic residue on the device surface were removed by rinsing the surface with a ceric ammonium nitrate solution followed by oxygen plasma ashing. After waveguide fabrication, a 2 μm thick SiO2 layer was deposited on both ends of the waveguides by PECVD to prevent the PDMS chamber from contacting the waveguide surface. PDMS has absorption bands in the mid-IR range due to its O–H, C–H, and other chemical bonds. The waveguide light would be absorbed if the PDMS chamber was directly attached to the waveguide surface.2.2 Optical characterization system
3. Results and discussion
3.1 Morphology of the device
The morphology of the fabricated a-Si waveguides was first inspected by scanning electron microscopy (SEM). Fig. 2a shows the top surface of the a-Si waveguide sitting on top of the SiO2 under-cladding. The structure was clearly defined, without defects or particles found along the edges. The top surface was smooth, indicating that no depletion damage was introduced during the RIE etching process. From the cross-sectional SEM image in Fig. 2b, the waveguide structure was 10 μm wide and 1 μm high and it had a well-cleaved end facet, which was critical to minimize the optical loss caused by scattering. The 10 μm waveguide width improved the butt-coupling efficiency between the 9 μm core diameter mid-IR fiber and the waveguide.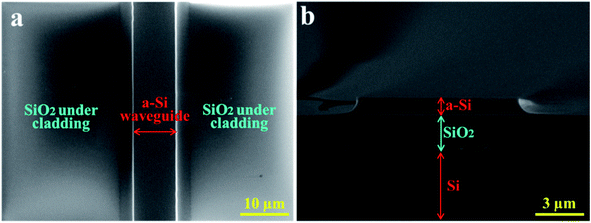 | ||
| Fig. 2 The SEM (a) top and (b) cross-sectional images of the a-Si waveguide. It is 10 μm wide and 1 μm high on a 3 μm thick SiO2 under-cladding layer. The substrate is Si wafer. | ||
3.2 Optical simulation and characterization
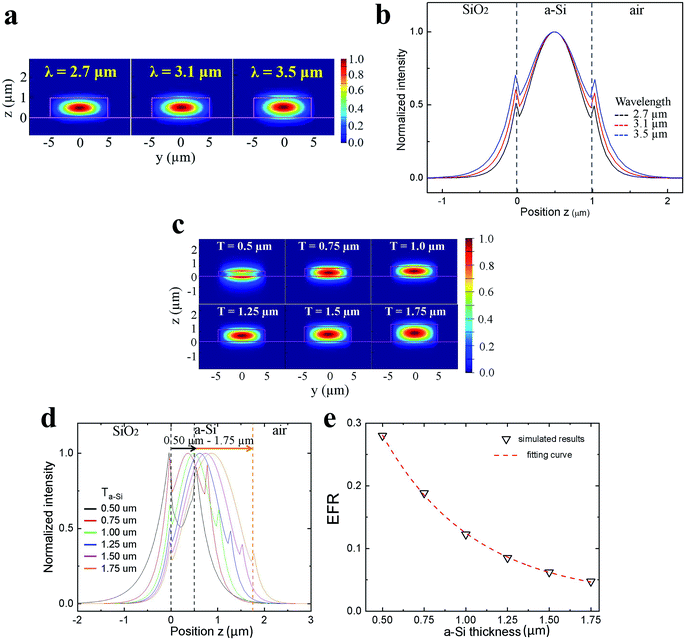
For the evanescent field sensing, the thickness of the a-Si ridge waveguide, Ta-Si, is critical because Ta-Si determines the strength of the evanescent field and the sensitivity. Sensing performance at various Ta-Si were simulated and analyzed. Fig. 3c showed the waveguide TM modes at λ = 3.30 μm when the Ta-Si increased from 0.5 μm to 1.75 μm. At Ta-Si = 0.5 μm, the a-Si layer was too thin to effectively confine the mid-IR and strong fields were found in the interface between the waveguide and the cladding layers. As the Ta-Si gradually increased to 1.75 μm, the confinement of the mid-IR became stronger and the evanescent wave became weaker. To better visualize the optical field profiles at different Ta-Si, 1-D intensity distributions along the z-axis (y = 0) are plotted in Fig. 3d. As Ta-Si increased, the evanescent field decreased and the waveguide mode shifted toward the center of the a-Si layer. Fig. 3e is the plot of the calculated evanescent field ratio (EFR) at different Ta-Si, where a better sensitivity was obtained at a high EFR.32–34 As the Ta-Si decreased from 1.75 μm to 0.5 μm, the EFR increased sharply from 0.05 to 0.28 indicating a significant improvement of the sensitivity. Nerveless, the coupling efficiency between the fiber and waveguide dropped as the Ta-Si decreased. Therefore, an optimized of Ta-Si = 1 μm was selected in this study.
3.3 Sensing tests
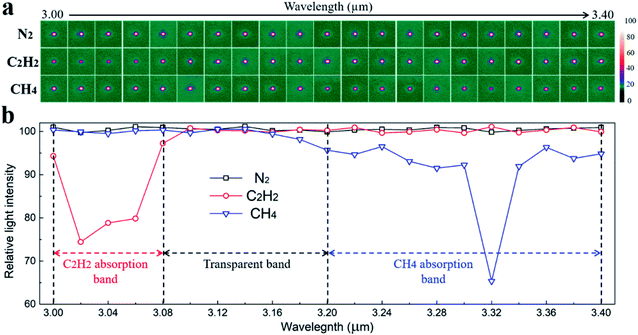
Two hydrocarbon gases, C2H2 and CH4, were selected to evaluate the sensing performance of the a-Si waveguide. The wavelength of the probe light was sequentially scanned from λ = 3.00 to 3.40 μm, a spectral region that included the characteristic C–H absorptions caused by C2H2 and CH4. Fig. 5a shows the captured waveguide mode images upon the injection of different gases into the PDMS chamber. When N2 was injected, the mode intensity was strong through the scanning range because the N![[triple bond, length as m-dash]](https://www.rsc.org/images/entities/char_e002.gif) N bond is IR inactive. When C2H2 was delivered into the chamber, the light mode notably faded between λ = 3.00 and 3.08 μm. After λ = 3.08 μm, the light mode became bright again. Once CH4 was presented, the light mode intensity remained strong over the spectrum except near λ = 3.32 μm. The results revealed that C2H2 and CH4 have distinguishable absorption properties within this scanning region. To better analyze these two gas absorption results, the waveguide mode intensity at discrete wavelengths was recorded and is depicted in Fig. 5b. For C2H2, significant light attenuation was found from λ = 3.00 to 3.08 μm, which was caused by its asymmetric C–H stretching.35,36 On the other hand, for CH4, the mode intensity dropped between λ = 3.18 and 3.40 μm due to the asymmetric C–H vibration, ν3. The absorptions found at λ = 3.32–3.40 μm and 3.18–3.30 μm were assigned to the prominent R branch and the mild P branch of CH4, respectively.37,38 Hence, the mid-IR waveguide sensor can accurately differentiate C2H2 and CH4 through their dissimilar C–H absorption spectra.
N bond is IR inactive. When C2H2 was delivered into the chamber, the light mode notably faded between λ = 3.00 and 3.08 μm. After λ = 3.08 μm, the light mode became bright again. Once CH4 was presented, the light mode intensity remained strong over the spectrum except near λ = 3.32 μm. The results revealed that C2H2 and CH4 have distinguishable absorption properties within this scanning region. To better analyze these two gas absorption results, the waveguide mode intensity at discrete wavelengths was recorded and is depicted in Fig. 5b. For C2H2, significant light attenuation was found from λ = 3.00 to 3.08 μm, which was caused by its asymmetric C–H stretching.35,36 On the other hand, for CH4, the mode intensity dropped between λ = 3.18 and 3.40 μm due to the asymmetric C–H vibration, ν3. The absorptions found at λ = 3.32–3.40 μm and 3.18–3.30 μm were assigned to the prominent R branch and the mild P branch of CH4, respectively.37,38 Hence, the mid-IR waveguide sensor can accurately differentiate C2H2 and CH4 through their dissimilar C–H absorption spectra.
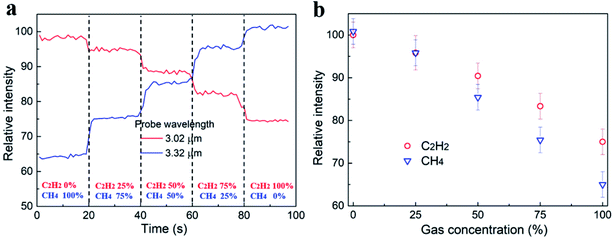
The real-time waveguide sensing test was carried out by injecting C2H2 and CH4 mixtures into the PDMS chamber. The sequence of the CH4/C2H2 concentrations were 0%, 25%, 50%, 75%, and 100%. Here, the concentration ratios were defined by the two gas flow rates controlled by the MFCs. In parallel, the laser wavelength was tuned to 3.02 μm and 3.32 μm, respectively. C2H2 attenuated the light intensely at λ = 3.02 μm, while CH4 was transparent at that wavelength. In contrast, the light at λ = 3.32 μm was only absorbed by CH4, and not by C2H2. As shown in Fig. 6a, abrupt mode intensity changes were observed between different CH4/C2H2 mixtures. In addition, both wavelengths were able to monitor the variation of the concentrations instantaneously. The light intensity at λ = 3.32 μm decreased as the CH4 concentration increased. Equivalently, the intensity at λ = 3.02 μm increased when the C2H2 concentration decreased. Fig. 6b plots the waveguide mode intensities measured at various CH4/C2H2 concentrations where a monotonic dependence was observed. The device sensitivity S can be expressed by eqn (1)32–34
| S = −ηεlI0e(−ηεCl−αl) | (1) |
4. Conclusions
A mid-IR a-Si waveguide sensor was demonstrated for non-destructive and real-time hydrocarbon gas detection. The waveguides were fabricated by CMOS processes. A clear waveguide fundamental mode was observed through λ = 2.70 to 3.50 μm, and a low optical loss of 1.74 dB cm−1 was obtained. Two hydrocarbon gases, C2H2 and CH4, were applied to test the waveguide sensing performance. A strong mode intensity attenuation was found between λ = 3.00–3.06 μm when C2H2 was applied, and between λ = λ = 3.29 to 3.33 μm when CH4 was used. The spectral mode variation corresponded to the different characteristic absorption bands caused by C–H stretching vibrations. Therefore, the mid-IR waveguide device provided a chip-scale sensor for in situ and remote hydrocarbon detection.Conflicts of interest
The authors declare no competing financial interests.Acknowledgements
The authors gratefully acknowledge funding support provided by Texas A&M University (TAMU) President's Excellence X-Grants, the Texas A&M Engineering Experiment Station (TEES) Seed Grant, NIH, and the NSF-ERC PATHS-UP Program. Device fabrication and characterization were performed at the AggieFab and the materials characterization facility (MCF) at Texas A&M University.References
- W. B. Innes, W. E. Bambrick and A. J. Andreatch, Hydrocarbon Gases, Specific Heats and Power Requirements for Compression, Anal. Chem., 1963, 35, 1198–1203 CrossRef CAS.
- N. Vedachalama, S. Srinivasalu, G. Rajendran, G. A. Ramadass and M. A. Atmanand, Review of unconventional hydrocarbon resources in major energy consuming countries and efforts in realizing natural gas hydrates as a future source of energy, J. Nat. Gas Sci. Eng., 2015, 26, 163–175 CrossRef.
- A. Z. Sadek, S. Choopun, W. Wlodarski, S. J. Ippolito and K. Kalantar-zadeh, Characterization of ZnO Nanobelt-Based Gas Sensor for H2, NO2, and Hydrocarbon Sensing, IEEE Sens. J., 2007, 7, 919–924 Search PubMed.
- A. Trinchi, S. Kandasamy and W. Wlodarski, High temperature field effect hydrogen and hydrocarbon gas sensors based on SiC MOS devices, Sens. Actuators, B, 2008, 133, 705–716 CrossRef CAS.
- R. Moos, A Brief Overview on Automotive Exhaust Gas Sensors Based on Electroceramics, Int. J. Appl. Ceram. Technol., 2005, 2, 401–413 CrossRef CAS.
- D. -J. Yang, I. Kamienchick, D. Y. Youn, A. Rothschild and I.-D. Kim, Ultrasensitive and Highly Selective Gas Sensors Based on Electrospun SnO2 Nanofibers Modified by Pd Loading, Adv. Funct. Mater., 2010, 20, 4258–4264 CrossRef CAS.
- T. Jin, J. Zhou, R. Gutierrez-Osuna, C. Ahn, W. Hwang, K. Park and P. T. Lin, Real-Time Gas Mixture Analysis Using Mid-Infrared Membrane Microcavities, Anal. Chem., 2018, 90, 4348–4353 CrossRef CAS PubMed.
- C.-H. Han, D.-W. Hong, I.-J. Kim, J. Gwak, S.-D. Han and K. C. Singh, Synthesis of Pd or Pt/titanate nanotube and its application to catalytic type hydrogen gas sensor, Sens. Actuators, B, 2007, 128, 320–325 CrossRef CAS.
- C.-H. Han, D.-W. Hong, S.-D. Han, J. Gwak and K. C. Singh, Catalytic combustion type hydrogen gas sensor using TiO2 and UV-LED, Sens. Actuators, B, 2007, 125, 224–228 CrossRef CAS.
- J. Schalwig, G. Müller, M. Eickhoff, O. Ambacher and M. Stutzmann, Group III-nitride-based gas sensors for combustion monitoring, Mater. Sci. Eng., B, 2002, 93, 207–214 CrossRef.
- J. Schalwig, P. Kreisl, S. Ahlers and G. Müller, Response mechanism of SiC-based MOS field-effect gas sensors, IEEE Sens. J., 2002, 2, 394–402 CrossRef CAS.
- A. Arbab, A. Spetz and I. Lundström, Gas sensors for high temperature operation based on metal oxide silicon carbide (MOSiC) devices, Sens. Actuators, B, 1993, 15, 19–23 CrossRef CAS.
- M. Akbar, M. Restaino and M. Agah, Chip-scale gas chromatography: From injection through detection, Microsyst. Nanoeng., 2015, 39, 15039 CrossRef.
- F. Haghighi, Z. Talebpour and A. Sanati-Nezhad, Through the years with on-a-chip gas chromatography: a review, Lab Chip, 2015, 15, 2559–2575 RSC.
- S. Narayanan, G. Rice and M. Agah, micro-discharge photoionization detector for micro-gas chromatography, Microchim. Acta, 2014, 181, 493–499 CrossRef CAS.
- T.-H. Tzeng, C.-Y. Kuo, S.-Y. Wang, P.-K. Huang, Y.-M. Huang, W.-C. Hsieh, Y.-J. Huang, P.-H. Kuo, S.-A. Yu, S.-C. Lee, Y. J. Tseng, W.-C. Tian and S.-S. Lu, A Portable Micro Gas Chromatography System for Lung Cancer Associated Volatile Organic Compound Detection, IEEE J. Solid-State Circuits, 2016, 51, 259–272 Search PubMed.
- J. Liu, J. H. Seo, Y. Li, D. Chen, K. Kurabayashi and X. Fan, Smart multi-channel two-dimensional micro-gas chromatography for rapid workplace hazardous volatile organic compounds measurement, Lab Chip, 2013, 13, 818–825 RSC.
- J. Sun, F. Guan, D. Cui, X. Chen, L. Zhang and J. Chen, An improved photoionization detector with a micro gas chromatography column for portable rapid gas chromatography system, Sens. Actuators, B, 2013, 188, 513–518 CrossRef CAS.
- F. James, P. Breuil, C. Pijolat, M. Camara, D. Briand, A. Bart and R. Cozic, Development of a MEMS preconcentrator for Micro-Gas Chromatography Analyses, Procedia Eng., 2014, 87, 500–503 CrossRef CAS.
- R. Bogue, Detecting gases with light: a review of optical gas sensor technologies, Sens. Rev., 2015, 35, 133–140 CrossRef.
- P. T. Lin, H. Jung, L. C. Kimerling, A. Agarwal and H. X. Tang, Low-loss aluminium nitride thin film for mid-infrared microphotonics, Laser Photonics Rev., 2014, 8, 23–28 CrossRef.
- B. Kumari, A. Barh, R. K. Varshney and B. P. Pal, Silicon-on-nitride slot waveguide: A promising platform as mid-IR trace gas sensor, Sens. Actuators, B, 2016, 236, 759–764 CrossRef CAS.
- A. Yu. Mironenko, A. A. Sergeev, A. E. Nazirov, E. B. Modin, S. S. Voznesenskiy and S. Yu. Bratskaya, H2S optical waveguide gas sensors based on chitosan/Au and chitosan/Ag nanocomposites, Sens. Actuators, B, 2016, 225, 348–353 CrossRef CAS.
- N. A. Yebo, W. Bogaerts, Z. Hens and R. Baets, On-Chip Arrayed Waveguide Grating Interrogated Silicon-on-Insulator Microring Resonator-Based Gas Sensor, IEEE Photonics Technol. Lett., 2011, 23, 1505–1507 CAS.
- C. R. Young, N. Menegazzo, A. E. Riley, C. H. Brons, F. P. DiSanzo, J. L. Givens, J. L. Martin, M. M. Disko and B. Mizaikoff, Infrared Hollow Waveguide Sensors for Simultaneous Gas Phase Detection of Benzene, Toluene, and Xylenes in Field Environments, Anal. Chem., 2011, 83, 6141–6147 CrossRef CAS PubMed.
- T. Watanabe, S. Okazaki, H. Nakagawa, K. Murata and K. Fukud, A fiber-optic hydrogen gas sensor with low propagation loss, Sens. Actuators, B, 2010, 145, 781–787 CrossRef CAS.
- Y. Zhao, Y. Zhang and Q. Wang, High sensitivity gas sensing method based on slow light in photonic crystal waveguide, Sens. Actuators, B, 2012, 173, 28–31 CrossRef CAS.
- T. Jin, H. Y. G. Lin and P. T. Lin, Monolithically Integrated Si-on-AlN Mid-Infrared Photonic Chips for Real-Time and Label-Free Chemical Sensing, ACS Appl. Mater. Interfaces, 2017, 9, 42905–42911 CrossRef CAS PubMed.
- T. Jin, L. Li, B. Zhang, H. Y. G. Lin, H. Wang and P. T. Lin, Real-Time and Label-Free Chemical Sensor-on-a-chip using Monolithic Si-on-BaTiO3 Mid-Infrared waveguides, Sci. Rep., 2017, 7, 5836 CrossRef PubMed.
- X. Duan, C. Wu, S. Xiang, W. Zhou, T. Yildirim, Y. Cui, Y. Yang, B. Chen and G. Qian, Novel Microporous Metal–Organic Framework Exhibiting High Acetylene and Methane Storage Capacities, Inorg. Chem., 2015, 54, 4377–4381 CrossRef CAS PubMed.
- A. Corma, Introduction: Chemicals from Coal, Alkynes, and Biofuels, Chem. Rev., 2014, 114, 1545–1546 CrossRef CAS PubMed.
- M. A. Butt, S. N. Khonina and N. L. Kazanskiy, Modelling of Rib channel waveguides based on silicon-on-sapphire at 4.67 μm wavelength for evanescent field gas absorption sensor, Optik, 2018, 169, 692–697 CrossRef.
- M. A. Butt, S. N. Khonina and N. L. Kazanskiy, Silicon on silicon dioxide slot waveguide evanescent field gas absorption sensor, J. Mod. Opt., 2018, 65, 174–178 CrossRef CAS.
- C. Ranacher, C. Consani, N. Vollert, A. Tortschanoff, M. Bergmeister, T. Grille and B. Jakoby, Characterization of Evanescent Field Gas Sensor Structures Based on Silicon Photonics, IEEE Photonics J., 2018, 10, 2700614 Search PubMed.
- H. Shirakawa and S. Ikeda, Infrared Spectra of Poly(acetylene), Polym. J., 1971, 2, 231–244 CrossRef CAS.
- E. Kovačević, I. Stefanović, J. Berndt and J. Winter, Infrared fingerprints and periodic formation of nanoparticles in Ar/C2H2 plasmas, J. Appl. Phys., 2003, 93, 2924–2930 CrossRef.
- Z. Ghorbani, P. Parvin, A. Reyhani, S. Z. Mortazavi, A. Moosakhani, M. Maleki and S. Kiani, Methane Decomposition Using Metal-Assisted Nanosecond Laser-Induced Plasma at Atmospheric Pressure, J. Phys. Chem. C, 2014, 118, 29822–29835 CrossRef CAS.
- Ch. Deschenauxdag, A. Affolterdag, D. Magnidag and Ch. Hollensteindag, Investigations of CH4, C2H2 and C2H4 dusty RF plasmas by means of FTIR absorption spectroscopy and mass spectrometry, J. Phys. D: Appl. Phys., 1999, 32, 1876–1886 CrossRef.
| This journal is © The Royal Society of Chemistry 2020 |

