
 Open Access Article
 This Open Access Article is licensed under a Creative Commons Attribution-Non Commercial 3.0 Unported Licence
Unraveling the effects of linker substitution on structural, electronic and optical properties of amorphous zeolitic imidazolate frameworks-62 (a-ZIF-62) glasses: a DFT study†
Mo Xionga,
Xiujian Zhao a,
Guanchao Yinb,
Wai-Yim Chingc and
Neng Li*a
a,
Guanchao Yinb,
Wai-Yim Chingc and
Neng Li*a
aState Key Laboratory of Silicate Materials for Architectures, Wuhan University of Technology, No. 122, Luoshi Road, Wuhan 430070, P. R. China. E-mail: lineng@whut.edu.cn
bSchool of Materials Science and Engineering, Wuhan University of Technology, No. 122, Luoshi Road, Wuhan 430070, P. R. China
cDepartment of Physics and Astronomy, University of Missouri-Kansas City, Kansas City, MO 64110, USA
First published on 7th April 2020
Abstract
Zeolitic imidazolate frameworks (ZIFs), as one sub-family of metal–organic frameworks (MOFs), are a new class of glass formers. Among them, one termed as ZIF-62 [Zn(Im)2−x(bIm)x], has great glass-forming ability compared with other ZIFs. Yet very few reports provide us with information about this glass from the computational point of view. In order to explore and have a deeper understanding of the effects of mixing organic ligands on the fundamental properties, we systematically investigate the electronic, intrinsic bonding and optical properties of amorphous ZIF-62 (a-ZIF-62) glass with density functional theory (DFT) calculation. Here we construct six amorphous ZIF-62 (a-ZIF-62) models with the ratio of bIm/(Im + bIm) ranging from 0 to 33.5%. These models are constructed based on a near perfect continuous random network model with over one thousand atoms originated from silica glass. They all keep a short range order but lack a long range order. As the concentration of bIm increases, our results show that the internal cohesion of a-ZIF-62 increases, indicating a strong network connectivity. Especially, for the first time we reveal that an obvious mid-band emerges in the conduction band due to the addition of bIm ligands. This further leads to alternation in the dielectric function. The calculated refractive index increases with an increase in the content of bIm ligands, which agrees well with the experimental results. The present results help us have a deeper understanding of the linker ratio effects on the various properties of amorphous ZIF glass and shed light on other ways to tune the properties of amorphous ZIF glass.
Introduction
Metal–organic frameworks (MOFs) in the past several decades have attracted a great of interest due to their multiple applications in gas sorption, separation and storage, catalysis, molecular recognition, drug delivery, sensing, radioactive waste storage and so on.1–7 In addition to these applications of crystalline MOFs, recent research has discovered that melting and then quenching some crystalline MOFs leads to the formation of MOF-glass.8–11 Although a huge number of crystalline MOFs exist, the discovered MOF glass derives from few of the MOFs. These MOFs mainly are zeolitic imidazolate frameworks (ZIFs). ZIFs are one unique sub-family of MOFs and adopt similar structures to zeolites, where the corner-sharing sites Si4+ or Al3+ are substituted by metal ions (like Zn2+, Co2+ and Li+) and bridging oxygen by rigid organic ligands.12,13 Generally, we use ZIF-glass herein in place of MOF-glass. A new field to explore the mechanism of melting and glass formation is presented by these novel glass. For example, in the case of ZIF-4 (Zn(Im)2), heating, melt-quenching and ball milling can all induce the amorphization of crystalline ZIF-4. Furthermore, the refined structure model produced through the reverse Monte Carlo (RMC) method recently confirm the general continuous random network (CRN) topology it adopted, which is analogous to that in silica.14,15 Apart from the static structure analysis, a dynamic tracing of the melting behaviour of ZIF-4 is also provided by the results that combine the first-principles molecular dynamics with in situ variable temperature X-ray experiments.16 The whole formation process of ZIF-glass, however, is still in absence. The further exploration discovers that the glass-forming ability (GFA) could be tuned by adjusting the chemistry of the initial structure.17 ZIF-62 is the typical material which composes two different organic ligands and owns the ultra-high glass forming ability.Amorphous ZIF-62 (a-ZIF-62) glass, derived from crystalline ZIF-62, adopts the same cag topology as ZIF-4. In contrast to ZIF-4 whose composition is universal, ZIF-62 consists of two mixed organic ligands—imidazolate (Im) (C3H3N2−) and benzimidazolate (bIm) (C5H7N2−).13 Moreover, the melting temperature Tm, the glass transition temperature Tg and the optical properties can be altered with the change of ratio of Im and bIm.17 The thermodynamics behaviour and enthalpy relaxation of a-ZIF-62 glass are further explored, showing a low driving force of nucleation and substantial degree of structural heterogeneity.18 Besides ZIF-62, cobalt-based ZIF-62 can form cobalt imidazolate glass from similar procedure.36
Despite the experiments and simulations provide the structural information of this a-ZIF-62 glass, there are limited reports on electronic structure, intrinsic bonding and optical properties. These properties are the key point for us to have a deeper understanding of this novel amorphous ZIF glass, and can be merely obtained by the first principle calculations. The main reason for the absence of these investigations is that there was not a suitable model for density functional theory (DFT) calculations. Recently our group have overcome this obstacle by successfully converting an amorphous SiO2 model to an amorphous ZIF model with still keeping the continuous random network topology.19 Here, we further develop this near perfect network model and apply it for the construction of the models of a-ZIF-62, which allows for the DFT calculations. In order to reveal the effects of different ratio of bIm/Im on those intrinsic properties of a-ZIF-62, we set the ratio of bIm/(Im + bIm) to range from 0 to 33.5% as reflected in six models. A systematic investigation of the structural, electronic, bonding and optical properties is carried out by DFT calculations. Our calculations show that all the models preserve short range order (SRO) but lack long range order (LRO). Furthermore, the calculated densities of states clearly exhibit a mid-gap emerging near the conduction band as the bIm ligands adds to the amorphous ZIF. This results in the change of dielectric function. The refractive index and the internal cohesion increase with increasing the bIm ligands in the a-ZIF-62. This study unveils the ligands effects on the a-ZIF-62 glass and paves the way for tuning the properties of amorphous ZIF glass.
Model details
The present a-ZIF-62 model originates from a periodic a-SiO2 model with 162 atoms (54 SiO2 molecules) constructed by one of the authors more than 30 years ago.20,21 Based on the structure of silica glass and crystal ZIF-4, we recently construct an amorphous ZIF model which contains 918 atoms with the same continuous random network (CRN) topology as that in the original a-SiO2 glass model.19 As well-known that ZIF-4 is closely related to zeolitic silica polymorphs by virtue of their analogous tetrahedral connectivity. The Zn–Zn bond length of separation in ZIF-4 is approximately twice that of Si–Si bond in a-SiO2, which indicates that the volume of an analogous ZIF may be approximated by 2 × 2 × 2 supercells of a-SiO2 with inorganic group (Im) bridges that make a Zn–Im–Zn angle close to 145°, similar to the Si–O–Si angle in a-SiO2. In order to convert the a-SiO2 model (162 atoms) to the a-ZIF-4 model (918 atoms), we replace the Si with Zn, the O with Im, and to keep the two Zn atoms and Im in the same plane. Then map the atoms in the Zn–Im–Zn plane to the Si–O–Si plane, converting the enlarged a-SiO2 model to the initial a-ZIF-4 model retaining the same network topology.Experimentally, partial replacement of the Im ligand with bIm (bIm = benzimidazolate, C7H5N2−) results in ZIF-62 [Zn(Im)1.75(bIm)0.25]. It undergoes amorphization at 610 K and then melts to liquid state at 710 K. After cooling back to room temperature, the a-ZIF-62 glass is formed.8
Inspired by the experiment results, we replace the Im with bIm in the a-ZIF-4 to construct the a-ZIF-62 models. Taking the disorder of bIm ligands into consideration, we randomly choose the original Im ligands with a Python script to be replaced. It should be pointed that the matching of the periodic boundary for a-ZIF-62 with strong directional bonding to yield a near-perfect ideal CRN model is a nontrivial task. Then six models are constructed with the ratio of bIm/(Im + bIm) ranging from 0 to 33.5%. We should emphasize that although the a-ZIF-62 adopts the same network topology as a-ZIF-4, the electronic and optical properties are different due to the replacement of the partial organic ligands as will be discussed below.
Computational methods
To ensure the high accuracy of the a-ZIF-62 models, we have fully relaxed all the structures with the density functional theory (DFT)-based Vienna Ab Initio Simulation Package (VASP).22 The projector augmented wave (PAW) method is performed by using the Perdew–Burke–Ernzerhof (PBE) potential with the generalized gradient approximation (GGA).23,24 For the electronic relaxation, a high energy cutoff of 600 eV is used with the electronic convergence criterion set at 10−5 eV. For ionic relaxation, we set the force convergence criteria to be 10−3 eV Å−1. A single k-point at the zone center is sufficient for such large glassy models.For electronic structure calculations and bonding calculations, we use the first-principles orthogonalized linear combination of atomic orbitals (OLCAO) method based on the VASP-relaxed structures. The combination of these two DFT-based methods has demonstrated to be highly effective in the study or large complex systems including non-crystalline solids25–28 and liquids,29 large organic crystals30 and biomolecules.31,32 More details of calculation are provided in the ESI.†
The program PLATON is used for all structures to calculate the porosity with “VOID” algorithm.33 The grid and probe radius are set to be 0.20 Å and 1.20 Å respectively in all the calculations.
Results and discussion
The structures of amorphous ZIF-62, Zn(Im)2−x(bIm)x, with x ranging from 0 to 0.67, are firstly all fully optimized. Fig. 1(a) and (b) depict the final relaxed structures for a-ZIF-62 and crystal ZIF-62, and Fig. 1(c) illustrates the basic components of the zinc nodes and two kinds of organic ligands. The other a-ZIF structures with different concentrations of bIm are shown in Fig. 2. The relaxed cell parameters are listed in Table 1. From the Table 1, we can see the densities of the simulated models increase with the increment of the concentration of bIm. As our models all adopt ideal network and have no defects which usually exist in the real glasses, so their densities are a little different from those in the experiments.8 The porosity is one of the most universal characteristics for MOFs materials which can be described by the solvent accessible volume (SAV). As the bIm ligands occupy much more space than the Im ligands, the porosity decreases with the increase of the bIm ligands, which is consistent with the experiments in ref. 35. And the glass network is still well preserved as shown in Fig. 2. In ref. 35, Frentzel-Beyme et al. found that there was a minor loss of porosity upon melting and forming a-ZIF-62 glasses. And the gas (n-butane, propane and propylene) sorption isotherms decrease with increasing bIm concentration, which indicates that the pore aperture size also reduces.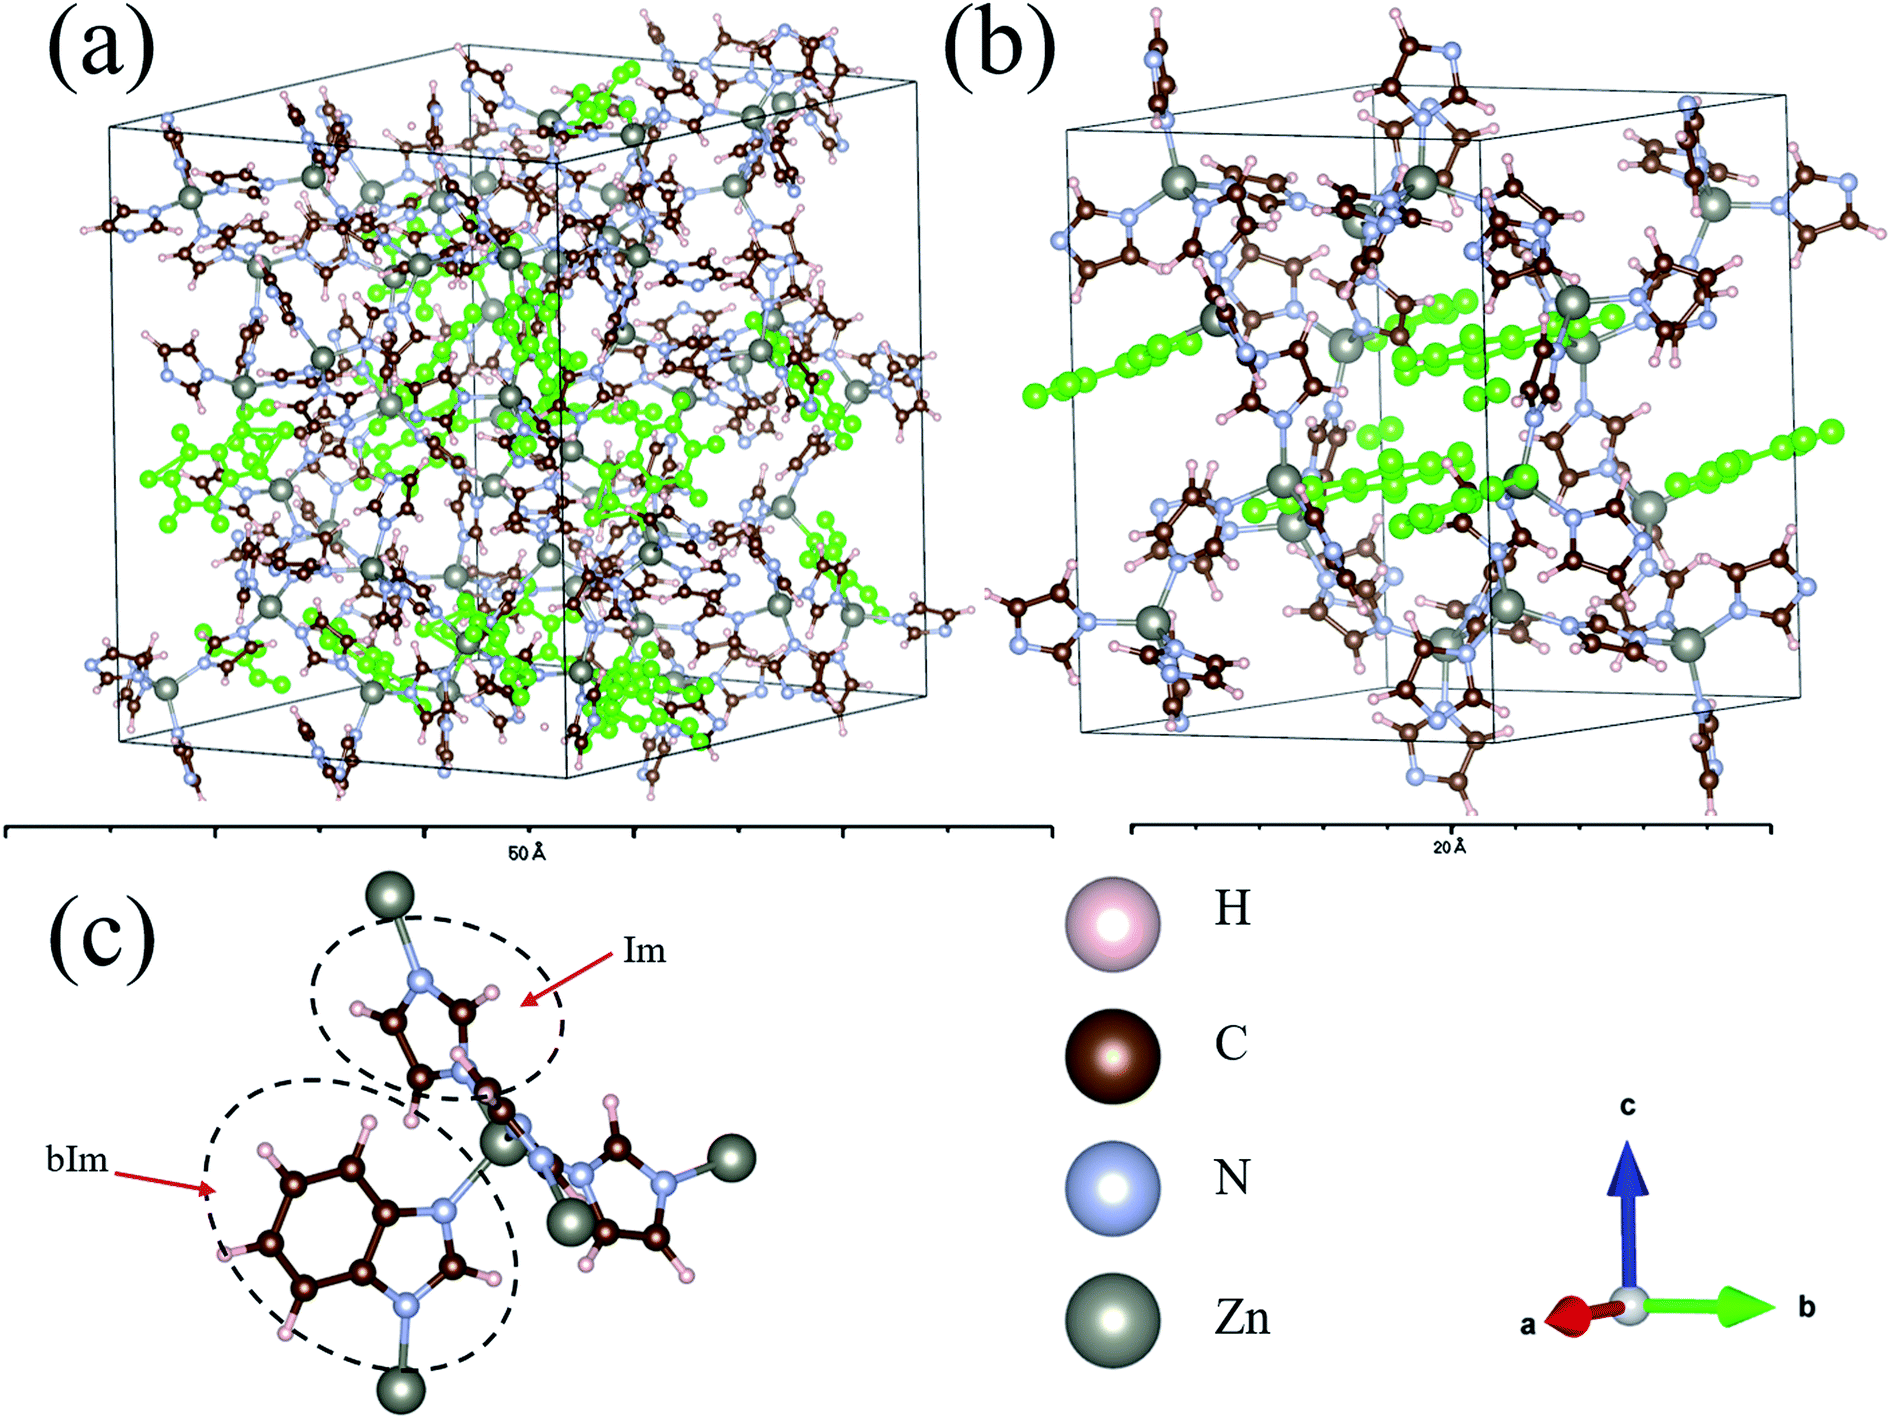 | ||
| Fig. 1 (a) The relaxed a-ZIF-62 and (b) ZIF-62. (c) The basic components of zinc node and organic ligands, imidazolate (Im) (C3H3N2−) and benzimidazolate (bIm) (C5H7N2−). The positions of the bIm linkers are highlighted in green. The elements Zn, N, C, H are represented by gray, blue, brown, pink balls. | ||
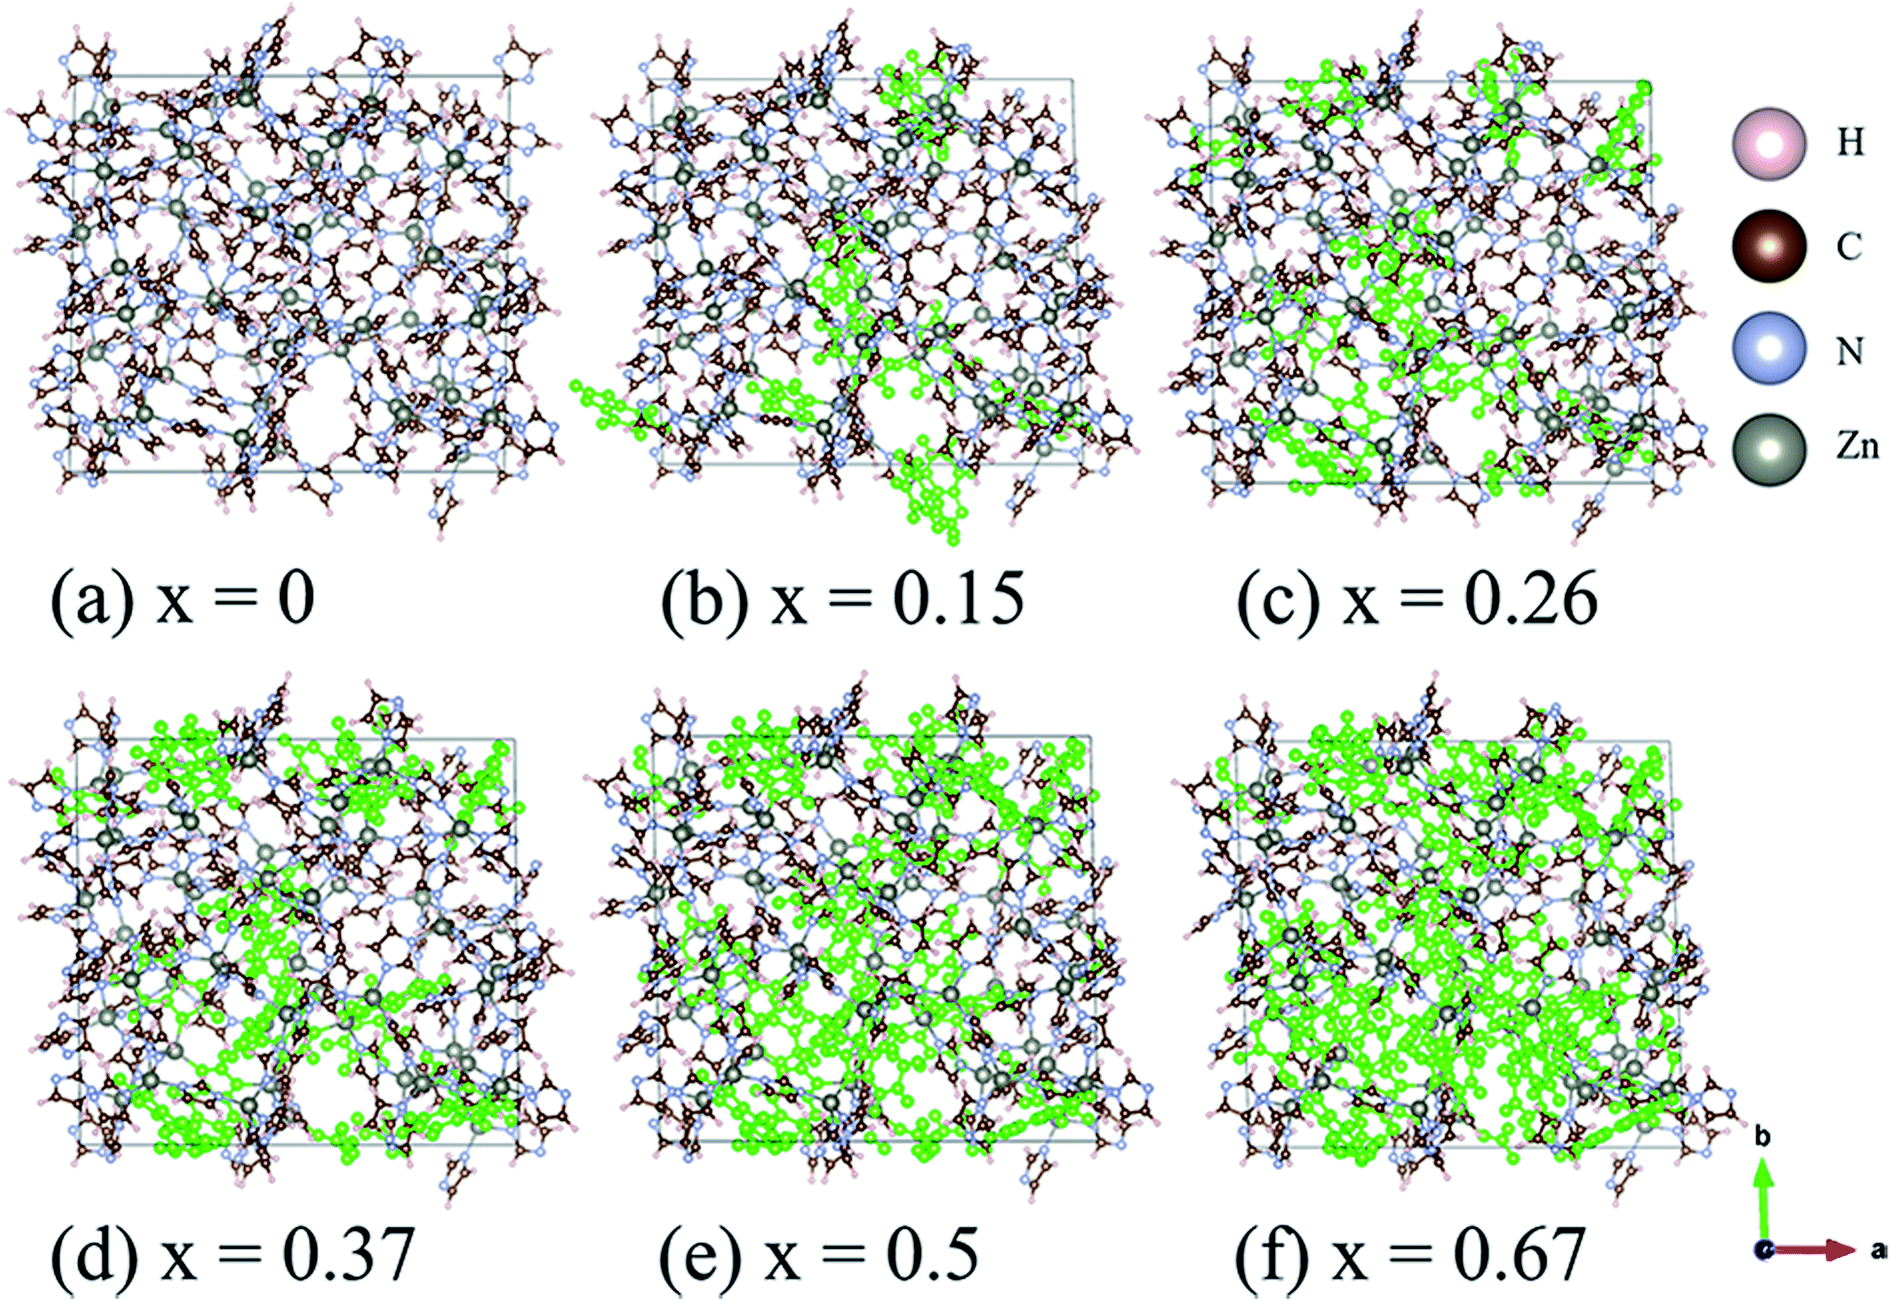 | ||
| Fig. 2 Ball and stick sketch of six models of amorphous ZIF models, Zn(Im)2−x(bIm)x with x from 0 to 0.67. The positions of the bIm linkers are highlighted in green. | ||
| Models | x = 0 | x = 0.15 | x = 0.26 | x = 0.37 | x = 0.5 | x = 0.67 |
|---|---|---|---|---|---|---|
| a (Å) | 26.234 | 26.551 | 26.504 | 26.289 | 26.359 | 26.395 |
| b (Å) | 23.891 | 24.278 | 24.153 | 24.272 | 24.318 | 24.663 |
| c (Å) | 27.097 | 27.36 | 26.894 | 27.237 | 27.297 | 27.321 |
| α° | 92.228 | 90.827 | 92.225 | 91.920 | 91.426 | 90.449 |
| β° | 94.394 | 93.762 | 94.021 | 93.867 | 94.541 | 94.459 |
| γ° | 89.056 | 91.551 | 90.360 | 90.419 | 90.900 | 91.896 |
| V (Å3) | 16![[thin space (1/6-em)]](https://www.rsc.org/images/entities/char_2009.gif) 918.9 918.9 |
17599.9 |
17160.3 |
17329.6 |
17434.1 |
17720.1 |
| ρ (g cm−3) | 1.058 | 1.054 | 1.110 | 1.128 | 1.155 | 1.179 |
| SAV | 43.66% | 43.4% | 39.0% | 37.7% | 35.6% | 33.4% |
A more detailed information of the local structure can be provided by the radial distribution function (RDF). RDF is usually used to describe the structure of amorphous materials. Fig. 3 shows the calculated total RDFs for these models. We can observe that all the peaks are well preserved and they are nearly all the same, which indicates that the increase of bIm in the models does not change the local structures during the short range. From the partial distribution function of each structures (see Fig. 4), it is seen that the substitution of bIm mainly changes the C–C and H–H peaks due to the addition of C atoms and H atoms in the bIm ligands. On the other hand, other pairs of peaks are nearly well preserved in Fig. 4.
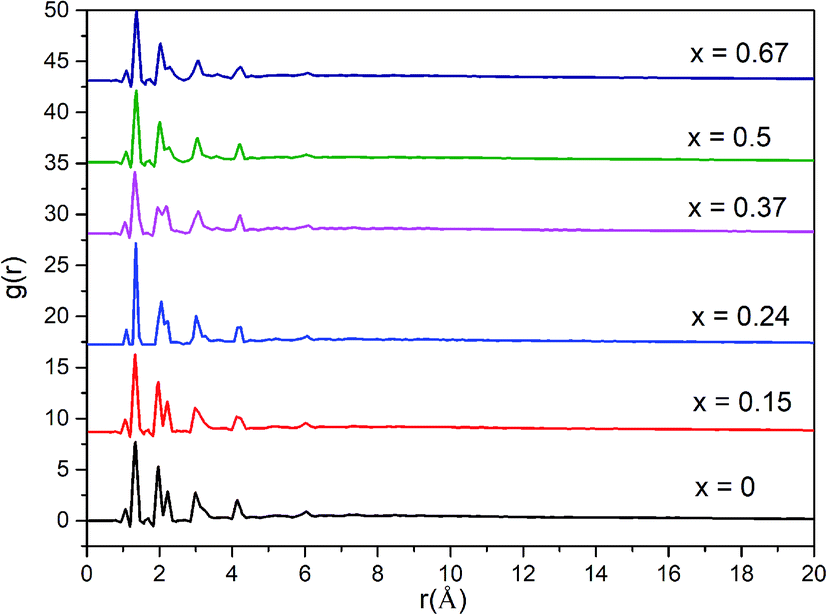 | ||
| Fig. 3 Total radial distribution function (RDF) for the six amorphous ZIF models, Zn(Im)2−x(bIm)x with x from 0 to 0.67. | ||
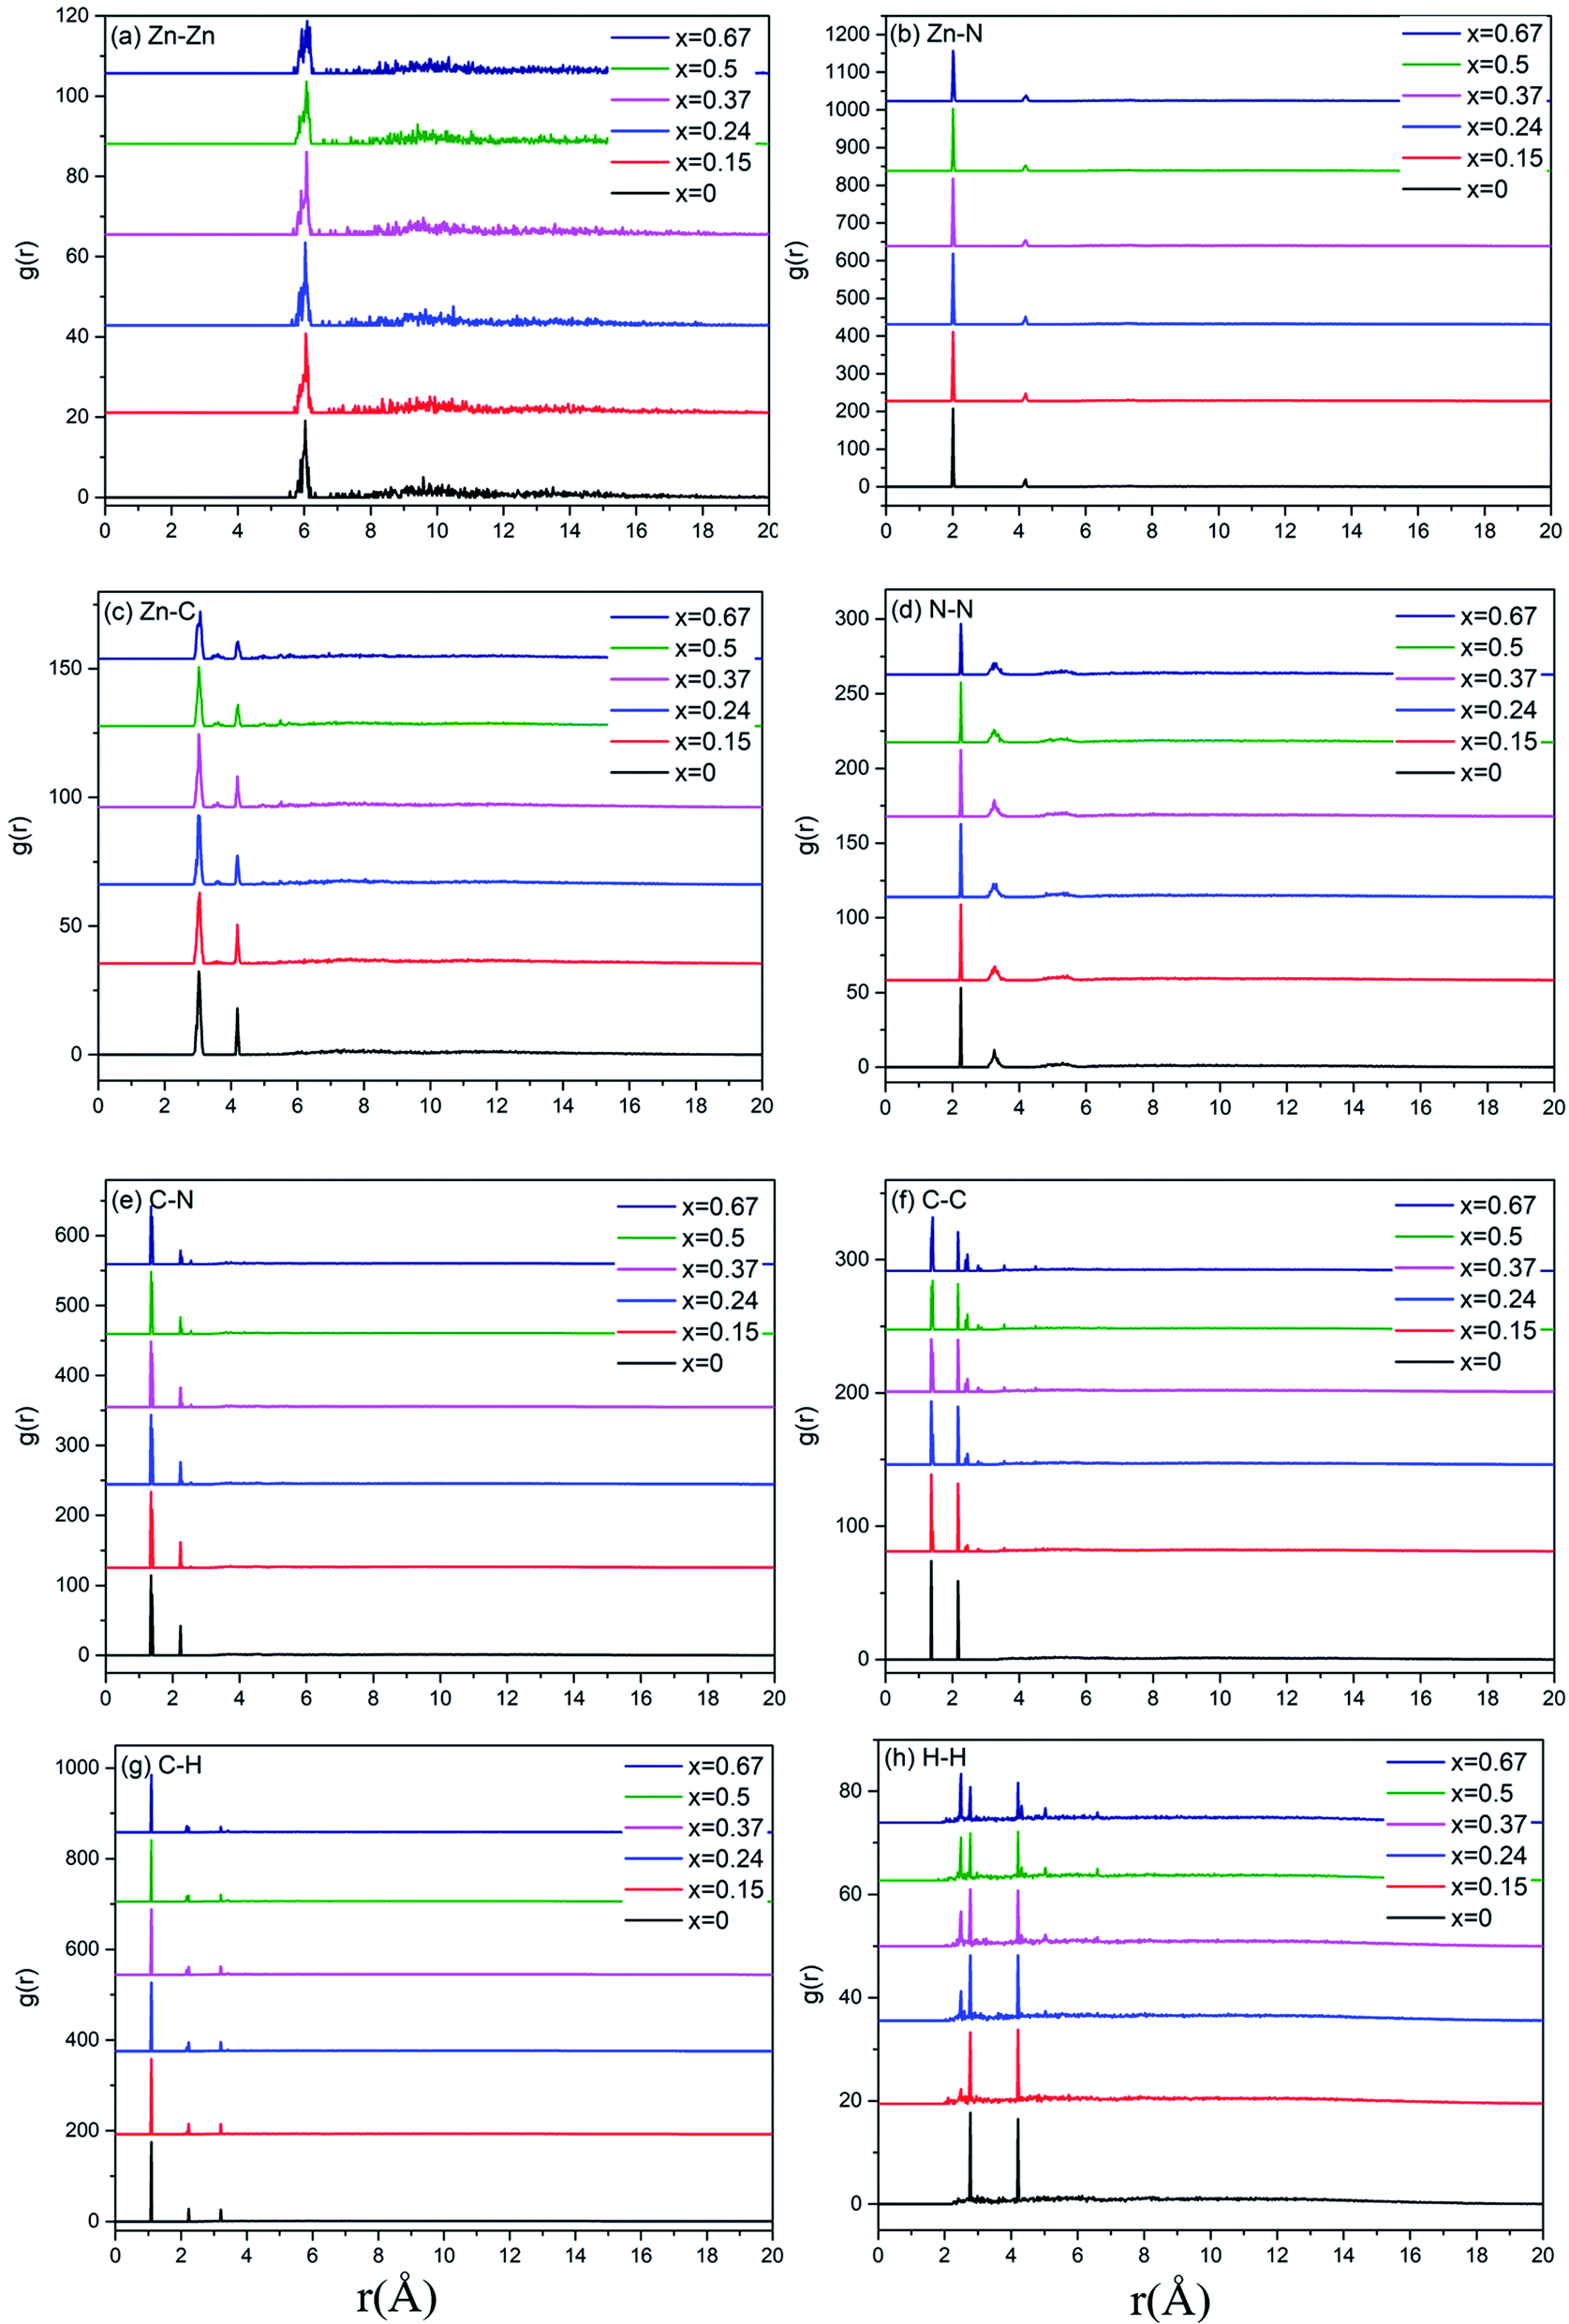 | ||
| Fig. 4 Partial radial distribution function (PRDF) for the six amorphous ZIF models, Zn(Im)2−x(bIm)x with x from 0 to 0.67. | ||
We specially choose the amorphous model with x = 0.24 as it has nearly the same ratio of bIm/(bIm + Im) to that in the experimental structures. A comparison between the calculated (Fig. 5(a)) and experimentally measured RDF (Fig. 5(b)) is made to assess and validate these models.8 The G(r) in experiment is calculated via Fourier transformation of the X-ray total scattering function S(Q). The spectrum shows that all the peaks in the experimental and computed data align well except a slight difference on the amplitudes. This difference is ascribed to the fact that the standard real space calculation method is used in the simulation. The partial distribution function (PDF) of all atoms pairs (Fig. 5(c)), which provides full information clearly. Despite this slight difference, the peaks in the simulated results fit well with those in the experiments, which indicates that our model maintains the major structure properties of amorphous ZIF-62 glass. Both patterns keep a short range order as the multiple peaks shown below 6 Å, and a lack of long range order due to rare peaks above 6 Å. From the calculated partial radial function, it is notified that the components of the peaks come from pairs of C–H, (peak A), pairs of C–N, C–C (peak B), pairs of Zn–N (peak C), pairs of C–N, C–C, N–N (peak C′), pairs of N–H, N–N, Zn–C, Zn–H (peak D), pairs of H–H, Zn–C, Zn–N (peak E), and pairs of Zn–N (peak F).
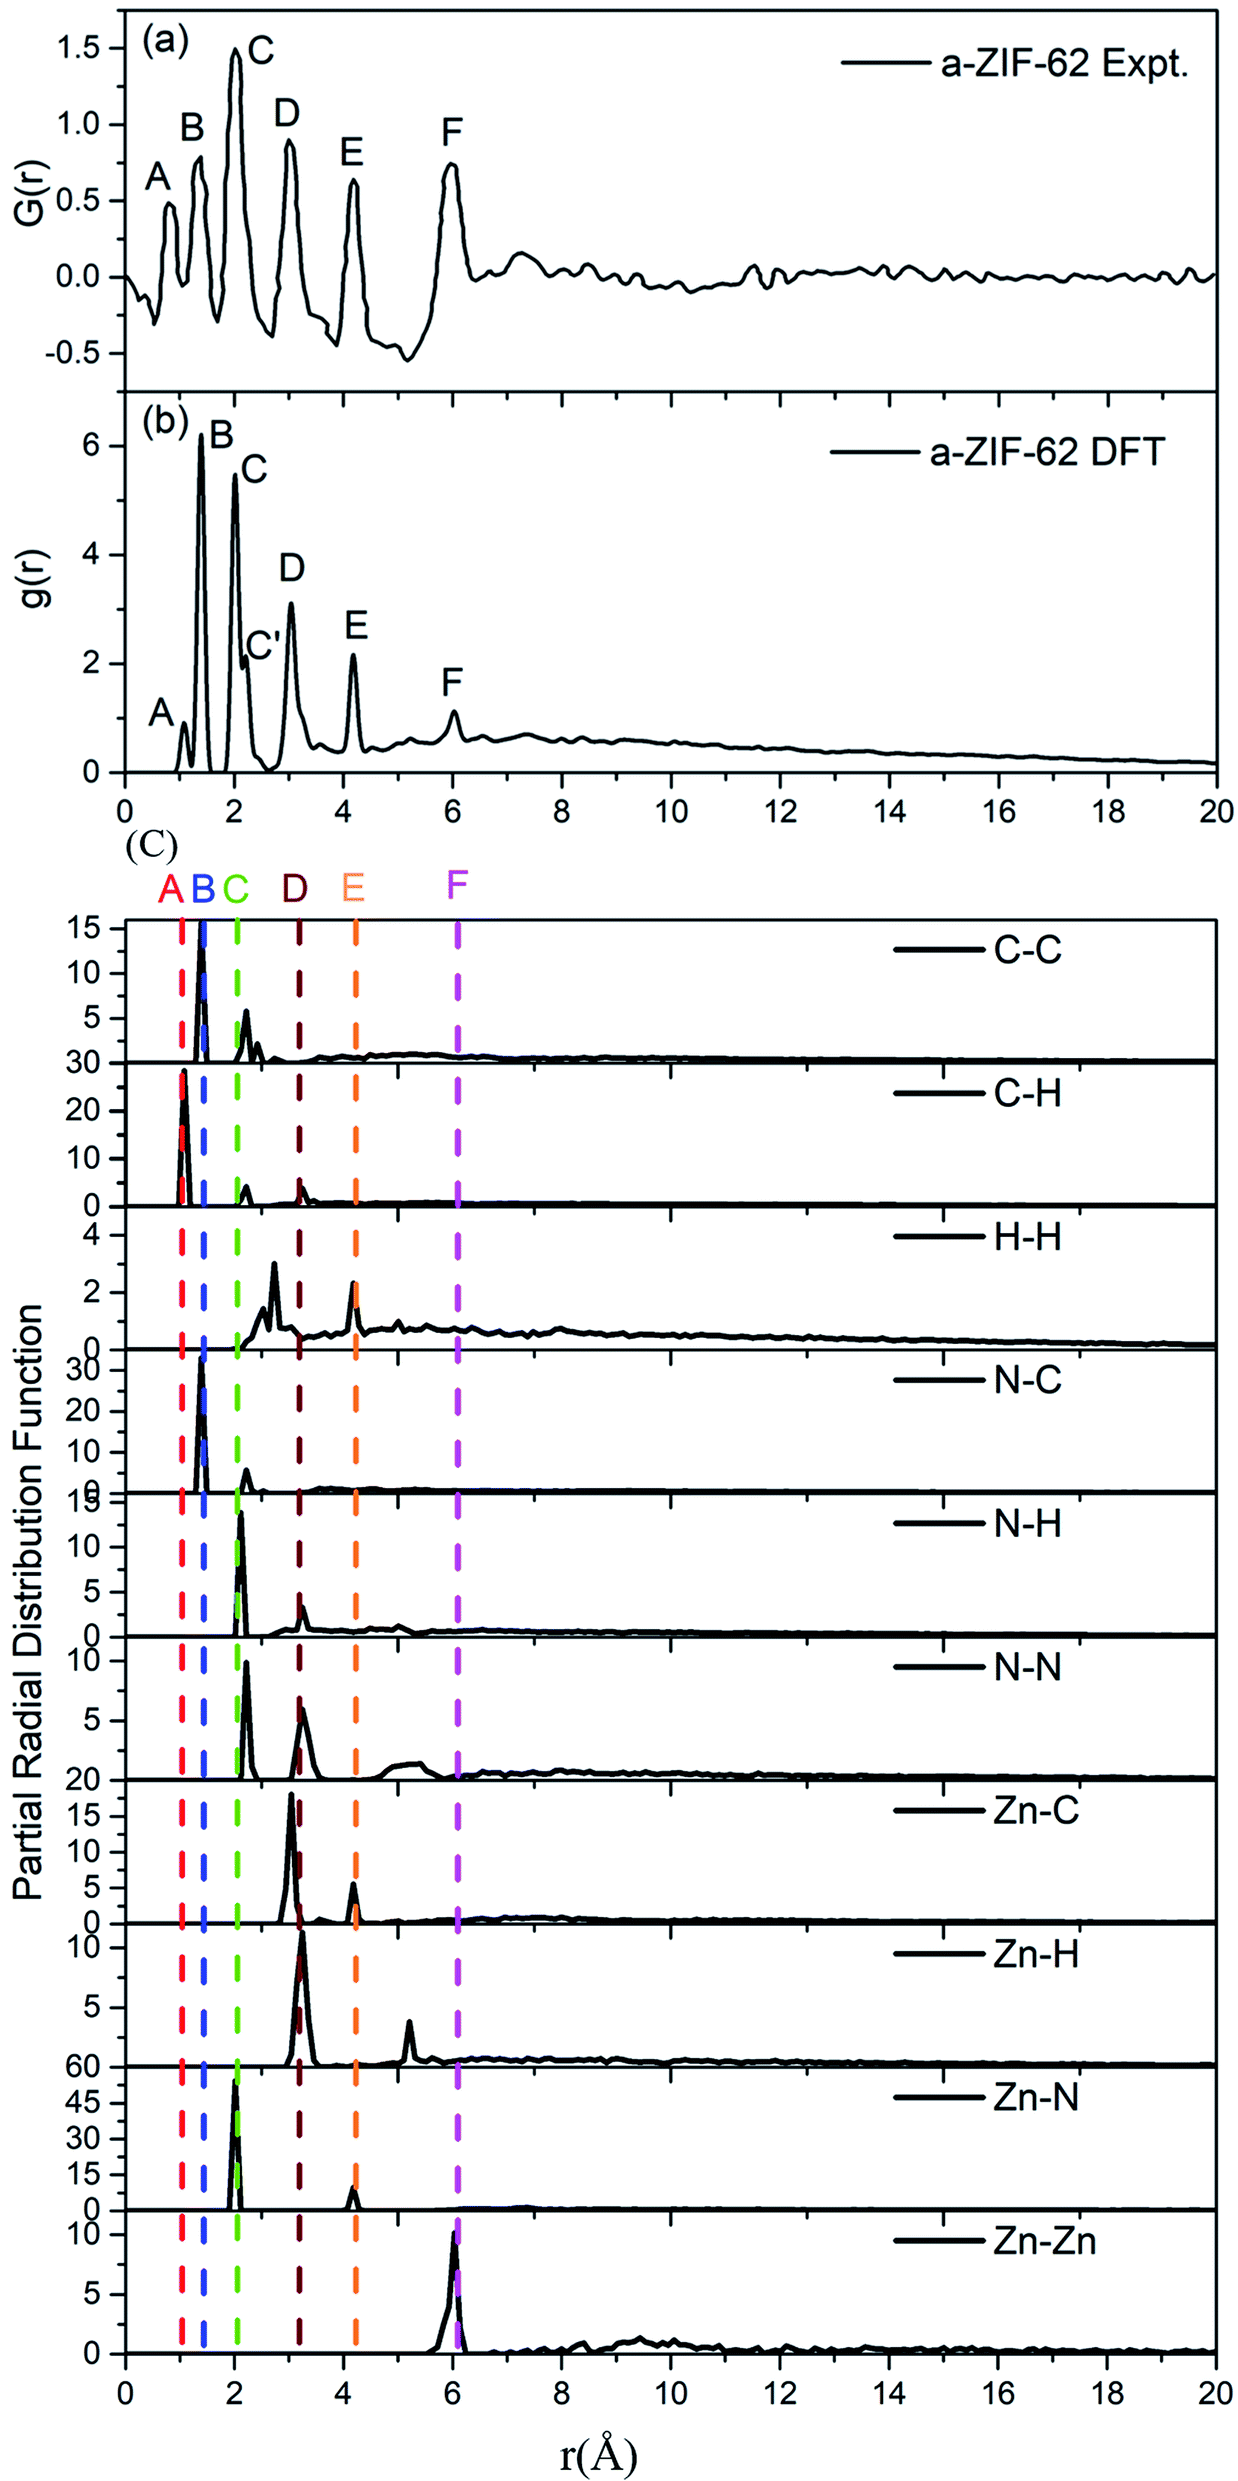 | ||
| Fig. 5 (a) Experimental radial distribution function (RDF) for amorphous ZIF-62 glass (ref. 8), (b) the calculated RDF for the relaxed a-ZIF-62 structure. (c) The partial radial distribution function (PRDF) for all atomic pairs in a-ZIF-62. | ||
The basic information needed to understand the potential interaction at the atomic level in any material is interatomic bonding and electronic structure. However, the structural analysis and properties of materials are often limited by the geometric parameters. It is not well defined for these quantities in the complex multicomponent glasses like ZIF glass. Therefore, it is very difficult to get this information in the simulation of glasses by molecular dynamics or ab initio molecular dynamics. Only by DFT calculation in this study, can we obtain them. The detailed results of interatomic bonding and electronic structure in the six models of amorphous ZIF glass, Zn(Im)2−x(bIm)x, are exhibited below.
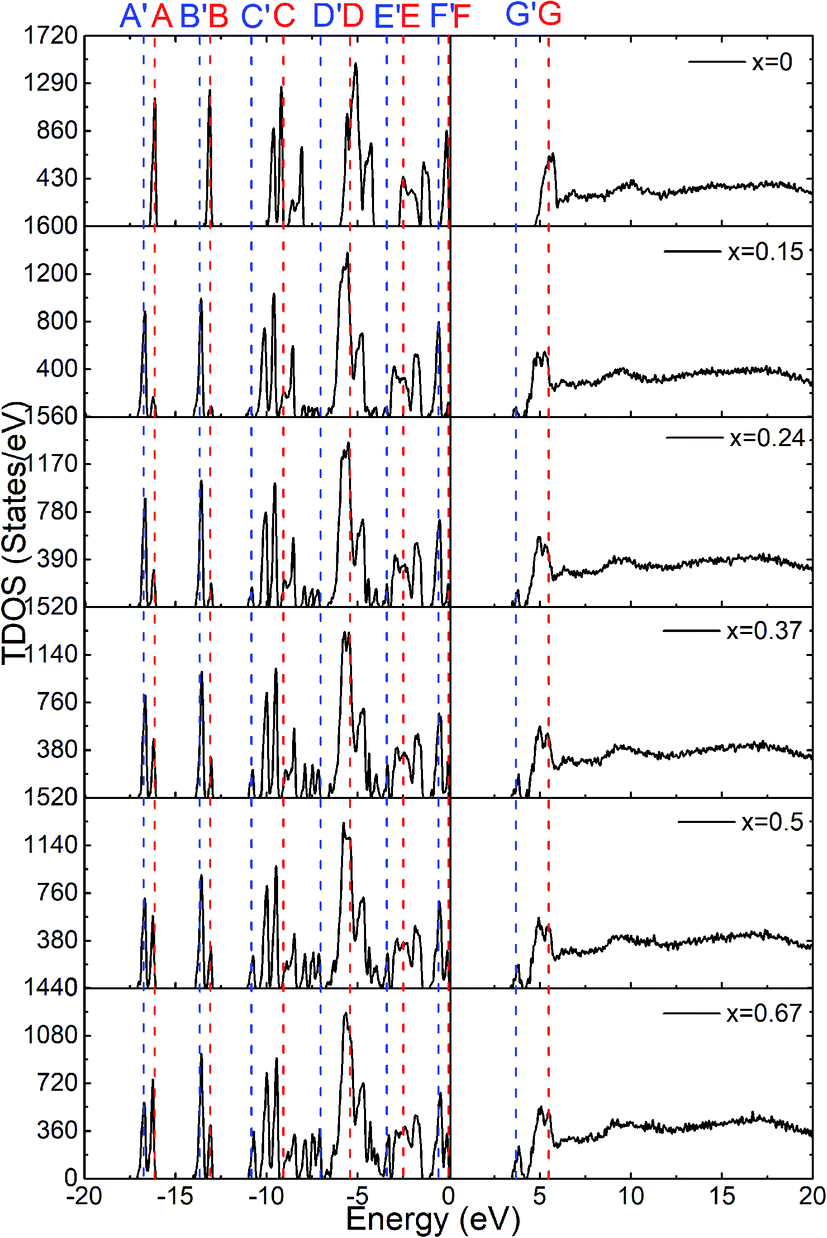
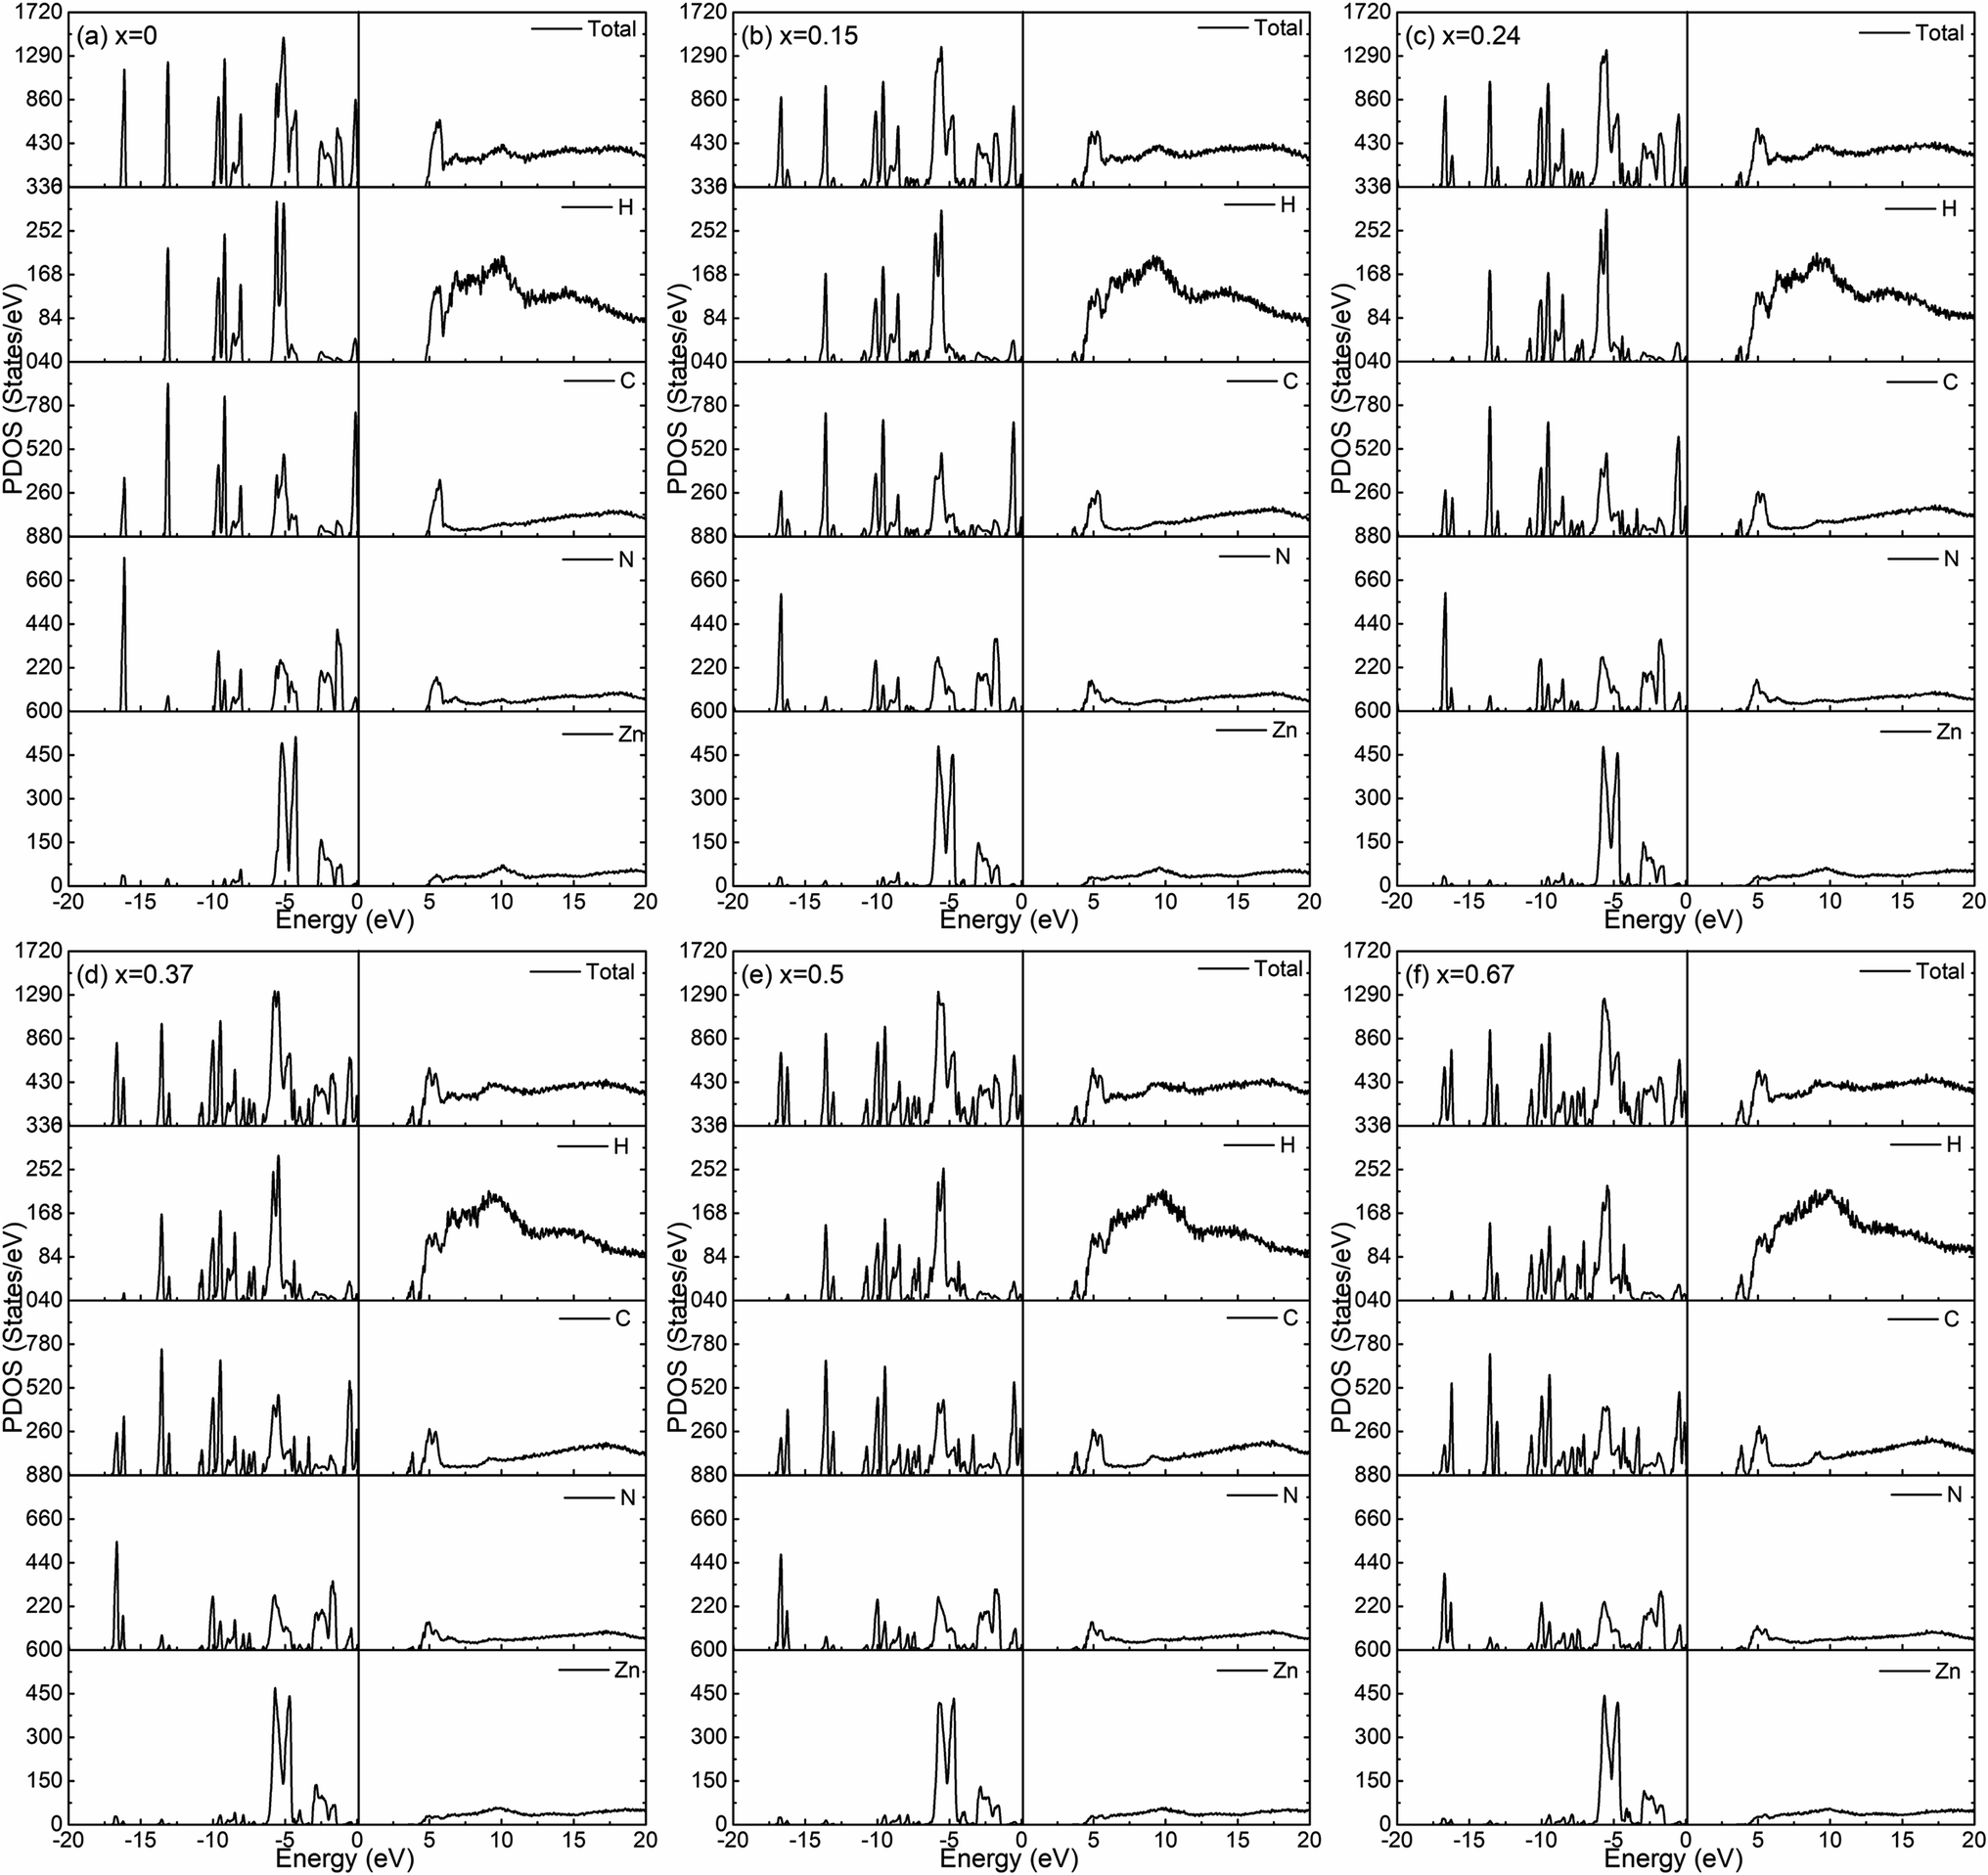
The calculated total density of states for the six amorphous ZIF models (Zn(Im)2−x(bIm)x) are shown in Fig. 6. Furthermore, the partial density of states for each type of atom is shown in Fig. 7. It clearly presents how the DOS in the VB and CB regions evolves as bIm for amorphous ZIF. The zero of the energy is set at the top of the occupied valence band (VB), which is separated by a gap from the unoccupied conduction band (CB). For all the amorphous ZIFs models, the VB consists of multiple sharp peaks, which can be roughly grouped into A to F in red color with the location of −16.12 eV, −13.09 eV, −9.08 eV, −5.43 eV, −2.48 and 0 eV, respectively. These peaks mainly originate from the bonding of C–N, C–C, and C–H in the organic ligands Im or bIm. Specifically, around −5 eV, a strong interaction of the Zn atoms with N atoms contributes to the group D. All the amorphous models share a similar pattern. However, new peaks begin to emerge as labeled A′ to F′ in blue color with the addition of bIm. As the concentration of bIm increases, the amplitudes of the new emerging peaks also increase without changing their positions. From the partial density of states exhibited in Fig. 7, it can be seen clearly that the emerging peaks A′ and B′ located at −16.77 and −13.64 eV originate from the hybrid of C-2s and N-2s orbitals. The bonding of C-2p and H-1s orbitals lead to the peak C′ located at −10.38 eV. The group peak D′ composed of three small peaks corresponds to the bonding of C-2p and N-2p, and the hybrid of C-2p and H-1s orbitals. In the CB region, one main peak G locates at around 6 eV with x = 0 in pure amorphous Zn(Im)2. More importantly, a mid-band peak G′ emerges at 3.76 eV starting from x = 0.15, and it is more notable with the concentration of bIm increases. The peak G splits into two peaks. The changes of the peaks in CB region stem from the bonding of C-2p and H-1s orbitals due to the replacement of bIm. The calculated band gap deceases from 4.52 to around 3.24 eV as listed in Table 1. We should note that calculated band gaps may be under estimated to the usual deficiency of DFT. At present, it is still lack of experiment values for comparison.
 | ||
| Fig. 6 The calculated total density of states for the six amorphous ZIF models, Zn(Im)2−x(bIm)x with x from 0 to 0.67. | ||
 | ||
| Fig. 7 The calculated partial density of states for the six amorphous ZIF models, Zn(Im)2−x(bIm)x with x from 0 to 0.67. | ||
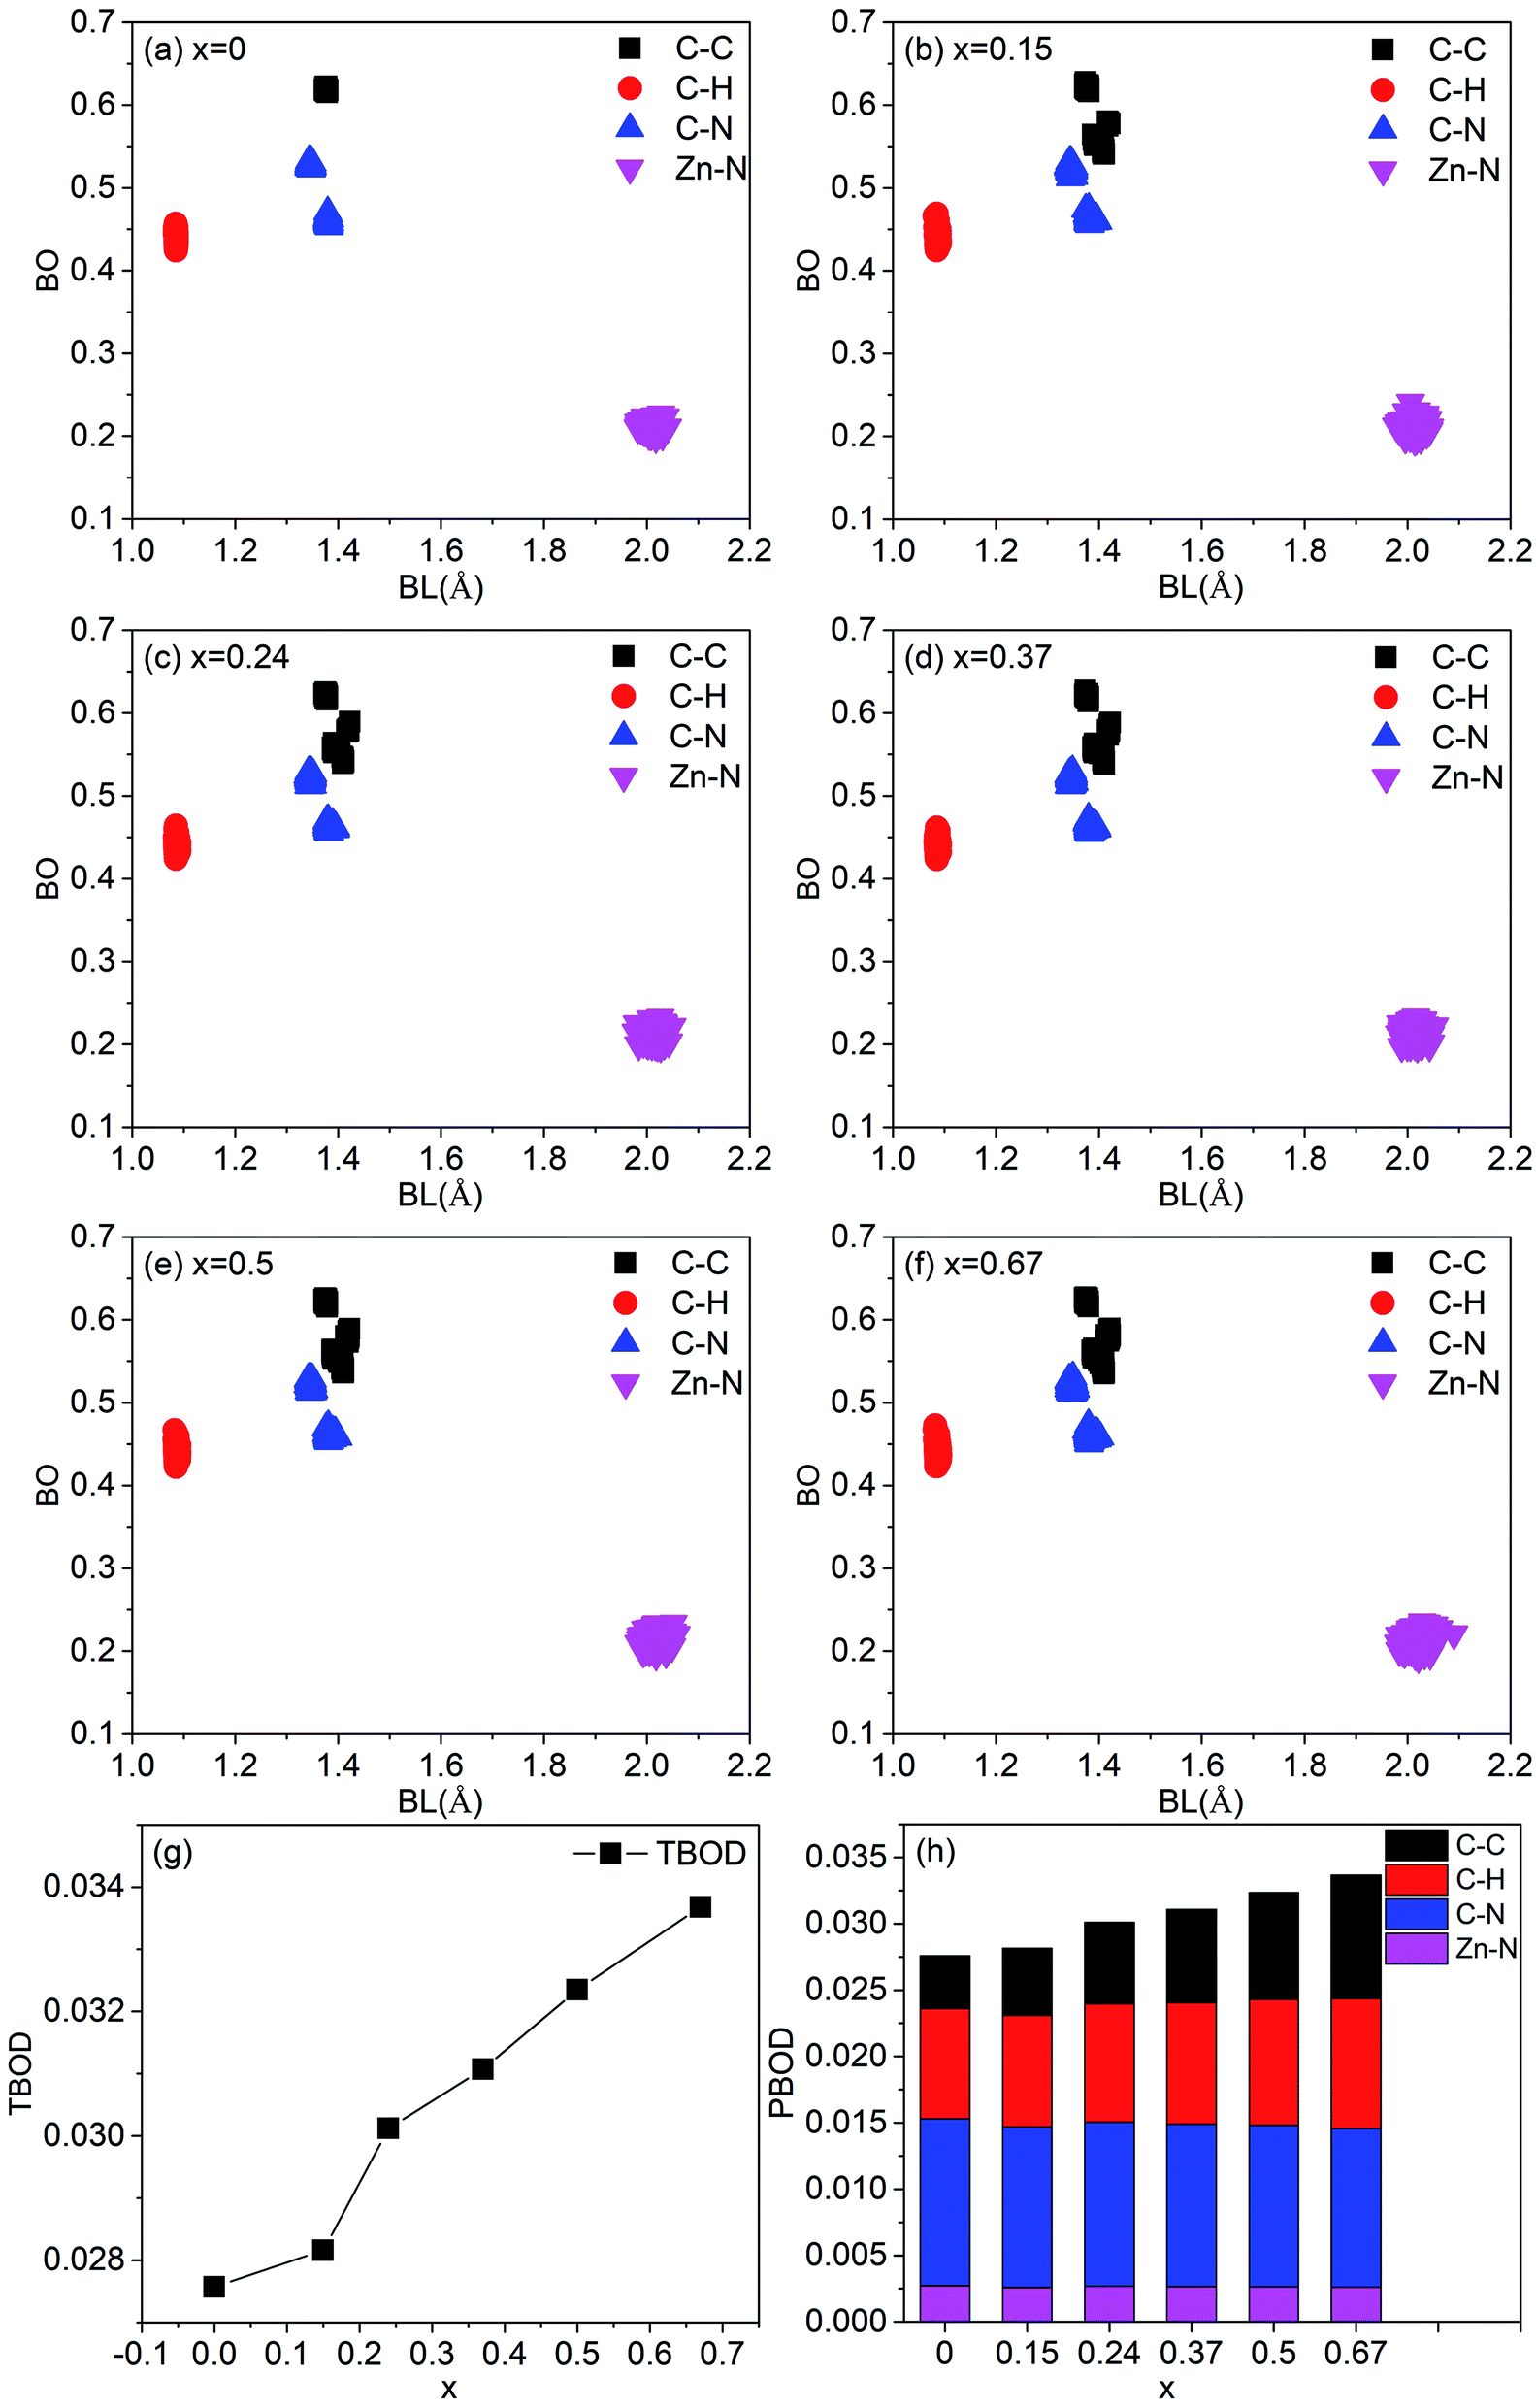
In order to characterize the strength of the bonds between atoms and the degree of internal cohesion in a-ZIF-62, the bond order (BO) (in unit of electrons e−) is calculated. The values of BO are dependent on the bond length and the local environment around them. Dividing the sum of the values of all BO that represents the total bond order (TBOD) by the cell volume results in the values of total bond order density, which can be used to characterize the strength and internal cohesion of a material. From Fig. 8(a)–(f), the scattered plot exhibits the calculated BO versus bond length (BL) up to 2.5 Å for all pairs in these six amorphous ZIF structures. Overall, there are four main bonding types in both structures, i.e., C–C, C–H, N–C in the imidazolate (Im) (C3H3N2−) or benzimidazolate (bIm) (C5H7N2−), and Zn–N bonds that connect the Im and bIm through the Zn atoms. The highest BO values come from the most strongly covalent C–C bonds. Different C–C bonding types in bIm mainly lead to three groups of BO for C–C bonds. As for C–N bonds, all the models have two types of BO values because of the two different local bonding environments for C–N bonds in the ligands of Im. The BO values for the shortest C–H bonds are relatively smaller. The ionic cation Zn is with Im or bIm via N sites in them. The Zn–N bonds exhibit a relatively large BO value with all bond length close to 2.0 Å. However, their bond order values are smaller than C–C, C–N and C–H bonds, indicating an ionic bonding character. The contribution to the total bond order density is from different pairs is shown in Fig. 8(a)–(f). As the concentration of bIm increases, the contribution from C–C bonds increases while that from C–N bonds decreases. The contributions from others vary slightly. The calculated TBOD of these amorphous models is plotted in Fig. 8(g) as a function of concentration x. The addition of bIm in the amorphous ZIF structures increases the covalent character of bonding, which results in an increment of TBOD. The partial bond order density (PBOD) is defined here as the contributions from different pairs to the TBOD and shown in the stacked column graph in Fig. 8(h), and their values are listed in Table 2. It is clearly shown that the increase of TBOD mainly comes from the increment of PBOD of C–C pairs and C–H pairs. The PBOD of C–N pairs decreases 15% while that of Zn–N pairs nearly keep the same as bIm increases. The calculated effective charge Q* and partial charge ΔQ on each atom are listed in Table 2. Overall, the Zn atoms lose electrons to N sites, and H atoms to C sites. The ΔQ values of C, H and Zn decrease while those of H increase.
 | ||
| Fig. 8 (a)–(g) Calculated bond order versus bond length relation with a pie chart representing partial bond order density due to different pair of bonding atoms in the six amorphous ZIF models, Zn(Im)2−x(bIm)x with x from 0 to 0.67, (h) variation of the TBOD with x. | ||
| Models | x = 0 | x = 0.15 | x = 0.26 | x = 0.37 | x = 0.5 | x = 0.67 |
|---|---|---|---|---|---|---|
| PBOD | ||||||
| C–C | 0.00395 | 0.00505 | 0.00613 | 0.00701 | 0.00807 | 0.00932 |
| C–H | 0.00832 | 0.00842 | 0.00893 | 0.00916 | 0.00948 | 0.00979 |
| C–N | 0.01259 | 0.01209 | 0.01238 | 0.01225 | 0.01217 | 0.01195 |
| Zn–N | 0.00271 | 0.00260 | 0.00267 | 0.00265 | 0.00264 | 0.00261 |
| TBOD | 0.02757 | 0.02816 | 0.03012 | 0.03107 | 0.03235 | 0.03368 |
| Eg (eV) | 4.52 | 3.29 | 3.24 | 3.22 | 3.18 | 3.2 |
| n | 1.432 | 1.448 | 1.478 | 1.493 | 1.512 | 1.532 |
|
||||||
| Q* | ||||||
| C | 4.092 | 4.102 | 4.105 | 4.107 | 4.106 | 4.107 |
| N | 5.451 | 5.443 | 5.446 | 5.449 | 5.453 | 5.458 |
| H | 0.758 | 0.756 | 0.752 | 0.749 | 0.748 | 0.746 |
| Zn | 11.095 | 11.091 | 11.092 | 11.095 | 11.103 | 11.111 |
|
||||||
| ΔQ | ||||||
| C | −0.092 | −0.102 | −0.105 | −0.107 | −0.106 | −0.107 |
| N | −0.451 | −0.443 | −0.446 | −0.449 | −0.453 | −0.458 |
| H | 0.242 | 0.244 | 0.248 | 0.251 | 0.252 | 0.254 |
| Zn | 0.905 | 0.909 | 0.908 | 0.905 | 0.897 | 0.889 |
| ωp (eV) | 15.609 | 15.721 | 15.720 | 15.752 | 16.591 | 16.566 |
The optical properties of a-ZIF-62, Zn(Im)2−x(bIm)x can provide us much useful information for the further application. The frequency dependent dielectric function is the key quantity of the optical properties, which associates with the interaction of photons with electrons. The calculated results of the complex dielectric function and the electron energy loss function of a-ZIF-62 are shown in Fig. 9. For the imaginary part ε2(ω), there are five absorption peaks A to E in pure amorphous Zn(Im)2 models, out of which two are well resolved (peak A at 5.43 eV and peak B at 6.63 eV) and the others are relatively broadened (peak C at 7.55 eV, peak D at 12.31 eV, and peak E with 14.51 eV). As Im is substituted with bIm, new peaks group A′ emerge below the peak A, which consists of two peaks at 3.71 and 4.15 eV. The peak A firstly splits into two peaks at x = 0.15, then one of them becomes broader and disappears at x = 0.67. The peak B and C both broaden with the increase of bIm. The peak C firstly disappears till x = 0.37, then emerges above x = 0.5. For all the structures, the peak D and E slightly change. As the real part ε1(ω) can be derived from ε2(ω), it owes the similar characteristics. It is noted that the after the peak A′ emerges, the absorption band is not shifted with the increase of the concentration x. The energy loss function (ELF) for these structures is shown in Fig. 9(b). The plasma frequency ωp represents the frequency of collective electron excitation in the materials, and can be identified from the largest peak position in the spectra. As shown in Fig. 9(b), the ωp is estimated around 15.7 eV in all the amorphous models in the present study. The values are listed in Table 2. The optical refractive index n is frequently estimated from the square root of ε1(0). The calculated refractive index n, as well as the experimental values from ref. 34, in our Zn(Im)2−x(bIm)x glass model as a function of x are plotted in Fig. 10. Their values are listed in Table 2. It is clearly shown that the value of n increases with the increase of bIm in these ZIF glass, which is in good agreement with other experimental results.34
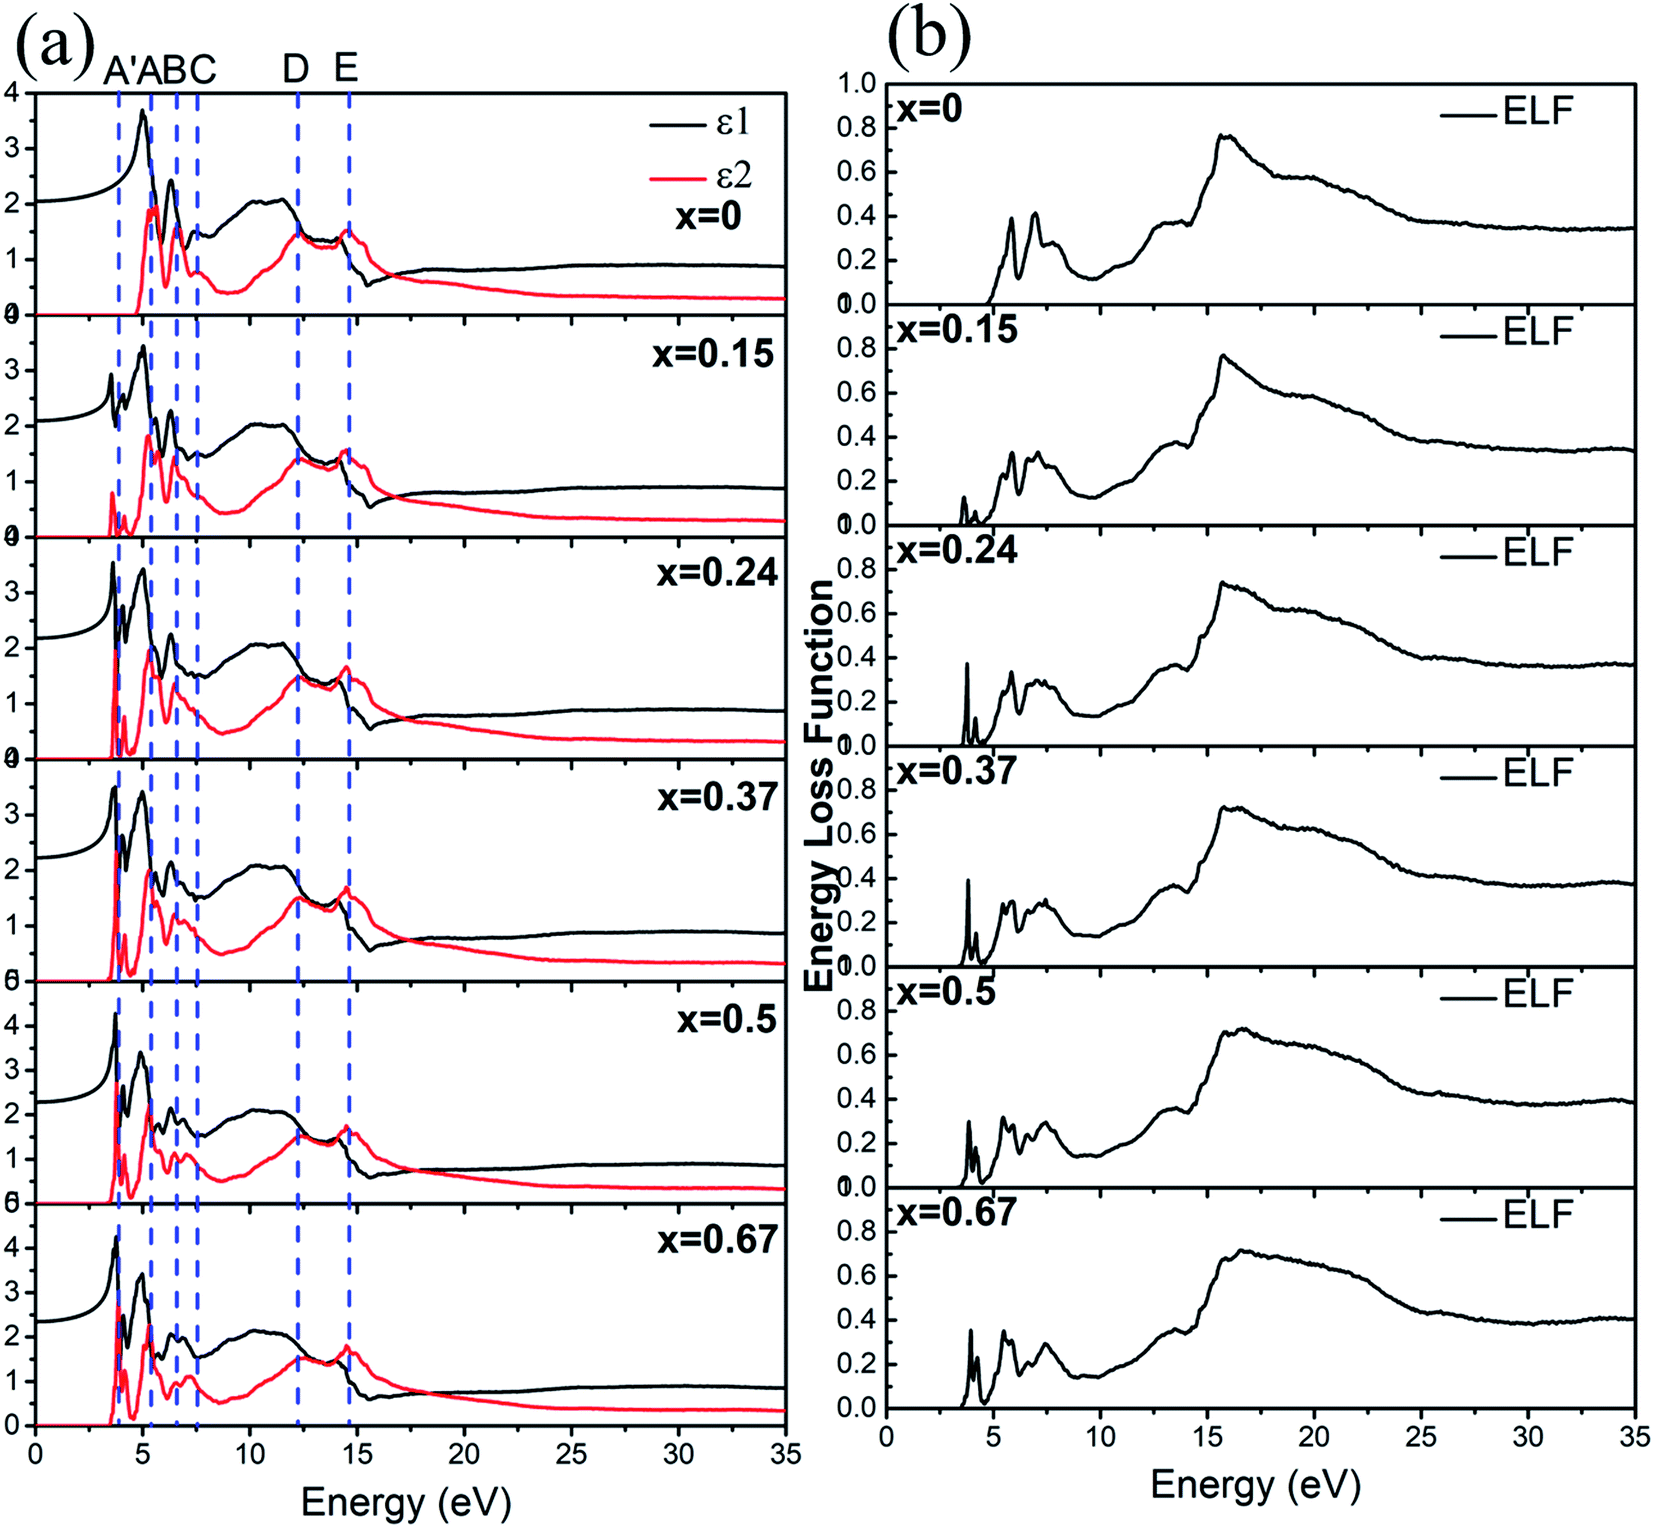 | ||
| Fig. 9 (a) The dielectric function and (b) energy loss function for Zn(Im)2−x(bIm)x with x from 0 to 0.67. | ||
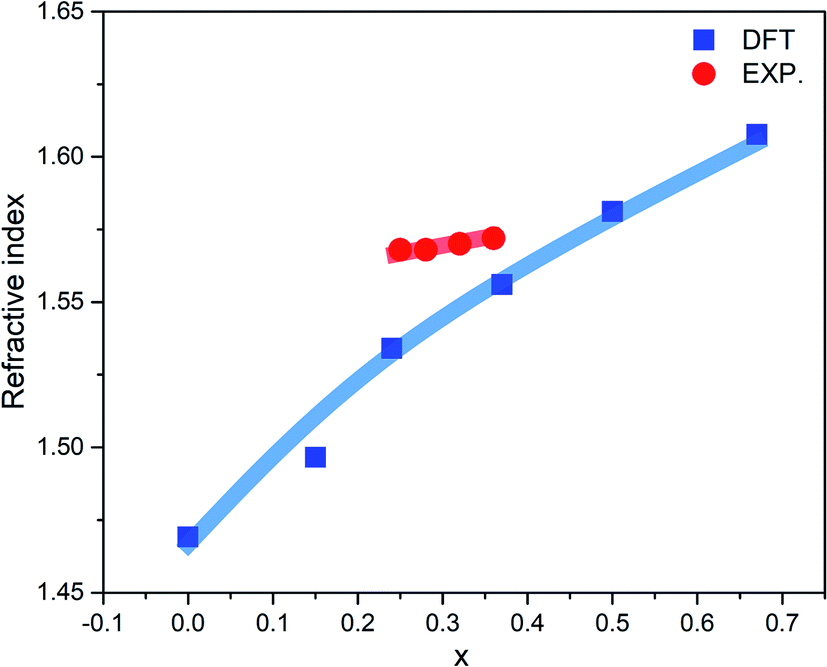 | ||
| Fig. 10 Calculated (blue line) and experimental (red line) refractive index (n) as a function of x for ZIF-62 glass. The experimental results come from ref. 34. | ||
Conclusions
In conclusion, this work unveils the effects of mixed organic ligands on the geometric structure, electronic structure, chemical bonding and optical properties of amorphous ZIF-62 (Zn(Im)2−x(bIm)x) from the computational viewpoint. A systematical investigation has been presented by density functional theory (DFT) calculations. The calculated radial distribution function results show that the increase of bIm just slightly changes the local structures in all the models. All the models exhibit the retention of short range order and the lack of the long range order. However, the porosity decreases due to the space occupied by the larger ligand of bIm in the structure. Replacing Im with bIm ligands leads to a sub band emerging near the conduction band, decreasing the band gap of a-ZIF-62. The calculated total bond order density (TBOD) reveals an increment of the internal cohesion with increasing bIm in the a-ZIF-62. The alternation of the band structure directly influences the dielectric function. Furthermore, the calculated refractive index n increases with the increment of bIm in the ZIF-62 glass, which is in good agreement with the experimental results. As such, the investigation provides valuable information for the further exploration of tuning the various properties of the amorphous ZIF glass from both experimental and computational points of view.Conflicts of interest
There are no conflicts to declare.Acknowledgements
We thank financially supported by the Fund of the National Natural Science Foundation of China (No. 11604249), the Overseas Expertise Introduction Project (111 project) for Discipline Innovation of China (B18038), the Fok Ying-Tong Education Foundation for Young Teachers in the Higher Education Institutions of China (No. 161008), the Basic Research Program of Shenzhen (Grant No. JCYJ20190809120015163), the Fundamental Research Funds for the Central Universities (2019III034, 2016-YB-009, WUT:193201003), and the research board of the State Key Laboratory of Silicate Materials for Architectures. We also thank Shanghai and Shenzhen Supercomputer Center for providing computing resources.References
- P. Horcajada, C. Serre, M. Vallet Regí, M. Sebban, F. Taulelle and G. Férey, Angew. Chem., Int. Ed., 2006, 45, 5974–5978 CrossRef CAS PubMed.
- J. Lee, O. K. Farha, J. Roberts, K. A. Scheidt, S. T. Nguyen and J. T. Hupp, Chem. Soc. Rev., 2009, 38, 1450–1459 RSC.
- L. Ma, C. Abney and W. Lin, Chem. Soc. Rev., 2009, 38, 1248–1256 RSC.
- A. C. McKinlay, R. E. Morris, P. Horcajada, G. Férey, R. Gref, P. Couvreur and C. Serre, Angew. Chem., Int. Ed., 2010, 49, 6260–6266 CrossRef CAS PubMed.
- R. E. Morris and P. S. Wheatley, Angew. Chem., Int. Ed., 2008, 47, 4966–4981 CrossRef CAS PubMed.
- L. J. Murray, M. Dincă and J. R. Long, Chem. Soc. Rev., 2009, 38, 1294–1314 RSC.
- R. Zou, A. I. Abdel-Fattah, H. Xu, Y. Zhao and D. D. Hickmott, CrystEngComm, 2010, 12, 1337–1353 RSC.
- T. D. Bennett, Y. Yue, P. Li, A. Qiao, H. Tao, N. G. Greaves, T. Richards, G. I. Lampronti, S. A. Redfern, F. Blanc, O. K. Farha, J. T. Hupp, A. K. Cheetham and D. A. Keen, J. Am. Chem. Soc., 2016, 138, 3484–3492 CrossRef CAS PubMed.
- T. D. Bennett, J.-C. Tan, Y. Yue, E. Baxter, C. Ducati, N. J. Terrill, H. H.-M. Yeung, Z. Zhou, W. Chen and S. Henke, Nat. Commun., 2015, 6, 8079 CrossRef CAS PubMed.
- D. Umeyama, S. Horike, M. Inukai, T. Itakura and S. Kitagawa, J. Am. Chem. Soc., 2015, 137, 864–870 CrossRef CAS PubMed.
- Y. Zhao, S.-Y. Lee, N. Becknell, O. M. Yaghi and C. A. Angell, J. Am. Chem. Soc., 2016, 138, 10818–10821 CrossRef CAS PubMed.
- A. Phan, C. J. Doonan, F. J. Uribe-Romo, C. B. Knobler, M. O'keeffe and O. M. Yaghi, Acc. Chem. Res., 2010, 43, 58–67 CrossRef CAS PubMed.
- K. S. Park, Z. Ni, A. P. Côté, J. Y. Choi, R. Huang, F. J. Uribe-Romo, H. K. Chae, M. O'Keeffe and O. M. Yaghi, Proc. Natl. Acad. Sci. U. S. A., 2006, 103, 10186–10191 CrossRef CAS PubMed.
- T. D. Bennett, A. L. Goodwin, M. T. Dove, D. A. Keen, M. G. Tucker, E. R. Barney, A. K. Soper, E. G. Bithell, J.-C. Tan and A. K. Cheetham, Phys. Rev. Lett., 2010, 104, 115503 CrossRef PubMed.
- D. Keen and T. Bennett, Phys. Chem. Chem. Phys., 2018, 20, 7857–7861 RSC.
- L. Longley, S. M. Collins, C. Zhou, G. J. Smales, S. E. Norman, N. J. Brownbill, C. W. Ashling, P. A. Chater, R. Tovey and C.-B. Schönlieb, Nat. Commun., 2018, 9, 2135 CrossRef PubMed.
- A. Qiao, T. D. Bennett, H. Tao, A. Krajnc, G. Mali, C. M. Doherty, A. W. Thornton, J. C. Mauro, G. N. Greaves and Y. Yue, Sci. Adv., 2018, 4, eaao6827 CrossRef PubMed.
- C. Zhou, M. Stepniewska, L. Longley, C. W. Ashling, P. A. Chater, D. A. Keen, T. D. Bennett and Y. Yue, Phys. Chem. Chem. Phys., 2018, 20, 18291–18296 RSC.
- P. Adhikari, M. Xiong, N. Li, X. Zhao, P. Rulis and W.-Y. Ching, J. Phys. Chem. C, 2016, 120, 15362–15368 CrossRef CAS.
- W. Ching, Phys. Rev. Lett., 1981, 46, 607 CrossRef CAS.
- L. Guttman, W. Ching and J. Rath, Phys. Rev. Lett., 1980, 44, 1513 CrossRef CAS.
- G. Kresse and J. Furthmüller, Phys. Rev. B: Condens. Matter Mater. Phys., 1996, 54, 169 CrossRef PubMed.
- P. E. Blöchl, Phys. Rev. B: Condens. Matter Mater. Phys., 1994, 50, 17953 CrossRef PubMed.
- J. P. Perdew, K. Burke and M. Ernzerhof, Phys. Rev. Lett., 1996, 77, 3865 CrossRef CAS PubMed.
- W.-Y. Ching and P. Rulis, Electronic Structure Methods for Complex Materials: The orthogonalized linear combination of atomic orbitals, Oxford University Press, 2012 Search PubMed.
- S. Aryal, M. Gao, L. Ouyang, P. Rulis and W. Ching, Intermetallics, 2013, 38, 116–125 CrossRef CAS.
- W. Y. Ching, Y. Mo, S. Aryal and P. Rulis, J. Am. Ceram. Soc., 2013, 96, 2292–2297 CrossRef CAS.
- L. Liang, P. Rulis and W. Ching, Acta Biomater., 2010, 6, 3763–3771 CrossRef CAS PubMed.
- S. Aryal, P. Rulis, L. Ouyang and W. Ching, Phys. Rev. B: Condens. Matter Mater. Phys., 2011, 84, 174123 CrossRef.
- C. C. Dharmawardhana, A. Misra, S. Aryal, P. Rulis and W. Ching, Cem. Concr. Res., 2013, 52, 123–130 CrossRef CAS.
- L. Wang, Y. Mo, P. Rulis and W. Ching, RSC Adv., 2013, 3, 25374–25387 RSC.
- L. Liang, P. Rulis, L. Ouyang and W. Ching, Phys. Rev. B: Condens. Matter Mater. Phys., 2011, 83, 024201 CrossRef.
- R. W. Hooft, L. H. Straver and A. L. Spek, J. Appl. Crystallogr., 2008, 41, 96–103 CrossRef CAS PubMed.
- A. Qiao, H. Tao, M. P. Carson, S. W. Aldrich, L. M. Thirion, T. D. Bennett, J. C. Mauro and Y. Yue, Opt. Lett., 2019, 44, 1623–1625 CrossRef CAS PubMed.
- L. Frentzel-Beyme, M. Kloß, P. Kolodzeiski, R. Pallach and S. Henke, J. Am. Chem. Soc., 2019, 141, 12362–12371 CrossRef CAS PubMed.
- L. Frentzel-Beyme, M. Kloß, R. Pallach, S. Salamon, H. Moldenhauer, J. Landers, H. Wende, J. Debus and S. Henke, J. Mater. Chem. A, 2019, 7, 985–990 RSC.
Footnote |
| † Electronic supplementary information (ESI) available: Further details of computational methods. See DOI: 10.1039/c9ra09977h |
| This journal is © The Royal Society of Chemistry 2020 |