 Open Access Article
A novel method for highly effective removal and determination of binary cationic dyes in aqueous media using a cotton–graphene oxide composite
A. A.
Nayl
 *ab,
A. I.
Abd-Elhamid
c,
M. A.
Abu-Saied
 d,
Ahmed A.
El-Shanshory
c,
Hesham M. A.
Soliman
c,
Magda A.
Akl
e and
H. F.
Aly
b
aChemistry Department, College of Science, Jouf University, Sakakah, Saudi Arabia. E-mail: aanayl@yahoo.com
bHot Laboratories Center, Atomic Energy Authority, Nasr 13759, Egypt
cNanotechnology and Composite Materials Research Department, Advanced Technology and New Materials Research Institute (ATNMRI), City of Scientific Research and Technological Applications (SRTA-City), New Borg Al-Arab 21934, Alexandria, Egypt
dPolymeric Materials Research Department, Advanced Technology and New Materials Research Institute (ATNMRI), City of Scientific Research and Technological Applications (SRTA-City), New Borg Al-Arab 21934, Alexandria, Egypt
eChemistry Department, Faculty of Science, Mansoura University, Mansoura, Egypt
First published on 24th February 2020
Abstract
The presence of dyes in industrial wastewater is a serious problem that hazards the surrounding environment. Therefore, this work investigates the removal of a binary dye system composed of Methylene Blue (MB) and Crystal Violet (CV) using an innovative composite (cotton fiber–graphene oxide (C–GO)). The simultaneous determination of the concentrations of the dyes in the binary system is a challenge. Thus, a new method was investigated to simultaneously detect the concentration of the dyes in the binary system using first-order derivative UV spectra to avoid the complex overlap of the maximum peaks in the original zero-order absorption spectra. Different parameters affecting the filter sorption mode, such as the concentration of the dyes, the dose of the (C–GO) composite, the dose of NaCl, flow rate, temperature, and pH, were investigated. The data obtained showed high adsorption efficiency for the binary dye system (>99%). This was approved based on the maximum sorption capacity (Q°) value obtained for the Langmuir model. Furthermore, this technique was developed, evaluated and applied to treat real industrial waste. The obtained data showed that the C–GO composite was highly efficient in treating industrial wastewater containing such dyes when a sufficient quantity is used. Therefore, it can be used as a promising adsorbent for such dyes in wastewater treatment processes.
1. Introduction
The hydrosphere contains fresh and marine water bodies contaminated by numerous types of organic and inorganic pollutants, which demands great environmental attention. These pollutants are poisonous, carcinogenic, hazardous, highly toxic and non-biodegradable. In addition, these materials have very harmful effects on human health, animal health, and marine life even at very low concentrations.1–3 Some industries that require synthetic dyes for coloring their products, such as paper, textile, fur, drugs, cosmetics, food, plastics, photographic, and leather, are regarded as the main sources of these contaminants in the environment as they produce large amounts of wastewater contaminated by such dyes from numerous industrial processes.4–10 These dyes are regarded as one of the most dangerous types and pose a serious environmental issue. Dyes are synthetic chemicals and have different aromatic structures and functional groups. Small amounts of these dyes (even < 1 ppm) are capable of coloring large amounts of water. The resulting effluents can affect the photosynthetic activities of aquatic plants by inhibiting the penetration of sunlight into deeper water layers and cause health hazards like skin diseases, allergy, neurological problems, kidney dysfunction, and throat swelling, besides serious environmental threat.11–16 Therefore, it is imperative to reduce and eliminate such pollutants through a suitable technology that can achieve the desired level of industrial wastewater treatment for environmental safeguarding.17 Currently, several technologies, such as adsorption,18–24 membrane separation20,25 nanofiltration,26,27 ozonation,28,29 electroflotation,30 precipitation,31 oxidation,32,33 and coagulation,34–36 have been developed to remove these dyes. According to the literature, the removal of dyes and the treatment of wastewater using adsorption technologies are competitive and effective compared with other chemical and physical technologies.9,37,38 Methylene Blue (MB) and Crystal Violet (CV) are examples of cationic industrial dyes that are widely used on a large scale, highly soluble in aqueous media, and very toxic at very low concentrations.37–46 Therefore, these dyes should be removed from the wastewater. In the last few years, due to the high scarcity of pure water, the removal of these dyes and the treatment of contaminated wastewater using technologies that do not create sludge have gained great attention.46–49In the last decade, nanomaterial research has brought about significant breakthroughs in many fields of applied science.50 With the advancements in nanotechnology and its applications, carbon nanoadsorbents are being considered promising adsorbents for wastewater treatment.51
Graphene oxide (GO) is a well-established adsorbent due to its unique structure and characteristics. GO exhibits a two-dimensional network with a thickness of one C-atom decorated with various O-function groups, such as –OH and C–O–C on its basal plane and –COOH and –C![[double bond, length as m-dash]](https://www.rsc.org/images/entities/char_e001.gif) O at the sheet edge. The presence of these groups in GO highly increases and improves its hydrophilicity and dispensability in aqueous media.38,52 Moreover, these oxygenated function groups actively react with positively charged contaminants, such as positive-charged organic compounds and different types of metals ions.40 Using graphene oxide-based composites, the removal and adsorption of different types of dyes,52–54 Cu+,55,56 and tetrabromobisphenol A (TBBPA)57 from wastewater have been studied.
O at the sheet edge. The presence of these groups in GO highly increases and improves its hydrophilicity and dispensability in aqueous media.38,52 Moreover, these oxygenated function groups actively react with positively charged contaminants, such as positive-charged organic compounds and different types of metals ions.40 Using graphene oxide-based composites, the removal and adsorption of different types of dyes,52–54 Cu+,55,56 and tetrabromobisphenol A (TBBPA)57 from wastewater have been studied.
This work deals with the preparation of a low-cost adsorbent with high adsorption efficiency for cationic dyes in aqueous solutions. The composite was prepared by simply mixing the cotton fiber and GO in an aqueous solution using a homogenizer. This technique kept the GO-sheets separated and allowed the GO-monolayers to penetrate the cotton fiber. The soft structure of the obtained composite was found suitable for use in various adsorption techniques, such as batch adsorption and filtering. A comparison between the two techniques was assessed and discussed. Further, the filter technique developed and evaluated in our previous work52 was extended to the industry in this work. This was carried out by applying it for the removal of two dyes from a binary system, which was the simulated example of industrial effluents, and evaluating the ability of the prepared filter. Finally, two different real samples were used, and the filter could successfully treat them. To enhance its performance, simulated industrial wastewater prepared using a binary dye system with two cationic dyes (MB and CV) was employed. To avoid the overlap between the maximum absorption peaks in the zero-order absorption spectra of these dyes, the first-order derivative UV-spectra, in which the maximum absorption peaks of the dyes were completely isolated, was investigated as a new method to detect the concentration of the dyes in the binary system simultaneously. Different factors that affect the adsorption processes were studied. Moreover, the experiments were scaled up, and the decontamination of two different real samples was demonstrated, revealing the potential of the prepared composite in purifying real industrial wastewater.
2. Experimental methods
2.1. Chemicals and materials
The chemicals and materials used in this work were of analytical grade and used without any further treatment. Methylene Blue (MB) and Crystal Violet (CV) (99.0%, Sigma-Aldrich), H2SO4 (Riedel DeHaen), graphite (200 mesh, >99.9%, Alpha Aesar), K2S2O8 (Sigma-Aldrich), KMNO4 (99.0%, Longlive), H2O2 (Pharaohs Ltd), HCl (Al Salam for Equipments and Basic Chemicals), cotton (obtained from the local markets), and the real industrial wastes supplied from AKSA EGYPT company.2.2. Preparation of graphene oxide and cotton fiber–graphene oxide composite
Graphene oxide was prepared using a procedure explained previously.52 Briefly, in a 150 mL glass beaker, three grams of graphite powder was mixed with about 70.0 mL of conc. H2SO4 for 10.0 min. Under vigorous stirring, the temperature of the resulting mixture was raised to about 40.0 °C for 30.0 min. Then, the resultant slurry was added to 150 mL deionized water and stirred further for 15.0 min at 95.0 °C. Double-distilled water was used to make up the volume of the resultant slurry to 500 mL, and then, 15.0 mL H2O2 (30.0%) was slowly added to the solution. The color of the formed suspension (dark brown) changed to yellow. The final suspension was filtered, and the filtrate with the product graphene oxide was washed with 250 mL of 10.0% hydrochloric acid. Then, GO was washed with bidistilled water (250 mL) and dried at 35.0 °C for about 99.0 h. The product compound was used for further experiments. A homogenizer was used to prepare the C–GO composite, which was completely characterized by TEM, SEM, LOM, XRD, FTIR, IR, and TGA, as described in our previous works.52,582.3. Determination and adsorption of binary dye
The concentrations of both dyes were determined simultaneously in the investigated binary system (MB and CV), and to avoid the complex calculations that are required in this concern, a new method using first-order derivative absorption spectra from a ultraviolet-visible spectrophotometer (UV/Vis Spectrophotometer-Double Beam, T80+, PG instruments Ltd., UK) was investigated. This method could separate the maximum peaks of the two dyes in the investigated binary system that overlapped in the zero-order absorption spectra.Stock solutions of 1.00 g L−1 of each dye were prepared, and the required concentrations used in the study were prepared by dilution with deionized water. The influence of different parameters that affect the adsorption processes was studied by the addition of 0.04 g of the cotton–GO composite to 50.0 mL of a solution containing 10 ppm of each dye with flow rate ≈ 4.55 mL min−1 and pH = 7.00 at room temperature unless otherwise cited. The pH of the initial solutions of the binary system (MB and CV) were adjusted using a definite concentration of HCl or NaOH (0.50 mol L−1). The resulting solution sample was separated using centrifugation and the concentrations of the dyes in the binary system (MB and CV) were measured spectrophotometrically, as stated above. The adsorption efficiency (% R) of each dye was calculated as:
 | (1) |
For the preparation of the binary mixture dye system, equal dye concentrations were used, and the adsorption equilibrium for each dye in the binary system was calculated.
2.4. Regeneration experiment
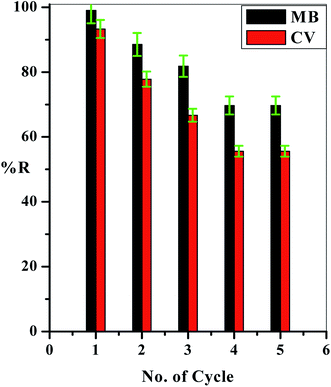
To reuse the prepared C–GO composite for repeated applications, a solution of 4.00% HCl (10.0 mL) was passed through the packed filter, and then, 5.00 mL of distilled water was used for washing, followed by 10.0 mL of EDTA (20.0%). Finally, another 5.00 mL of distilled water was used for washing at a flow rate of 625 × 10−3 mL min−1 using a peristaltic pump. The adsorption percentage of each dye in each experiment was determined by eqn (1).3. Results and discussion
3.1. Adsorption process
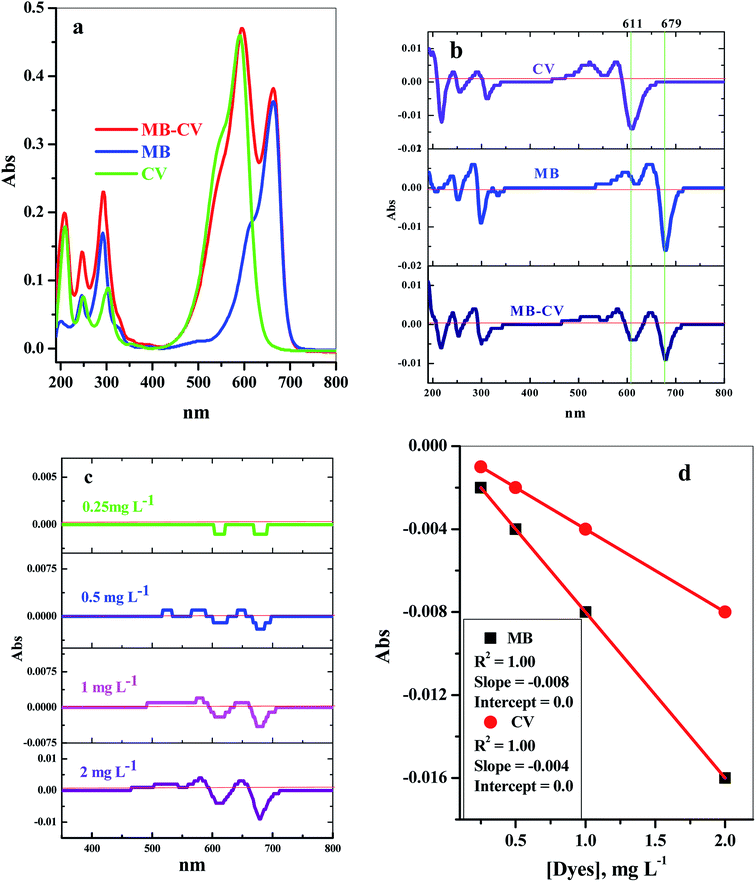
This way, we could directly determine one of the two components at a wavelength where the absorbance value of the other component is zero or close to zero, as in Fig. 1. The data obtained showed that the concentrations of the dyes MB and CV could be determined directly from the first-order derivative absorption spectra at 679 nm and 614.8 nm, respectively. Therefore, the calibration curves of the dyes in the binary system were plotted at these respective wavelengths (Fig. 1d).
The Langmuir model assumes that the adsorbent surface has homogeneously distributed binding sites with equivalent sorption energy and can be written as:
 | (2) |
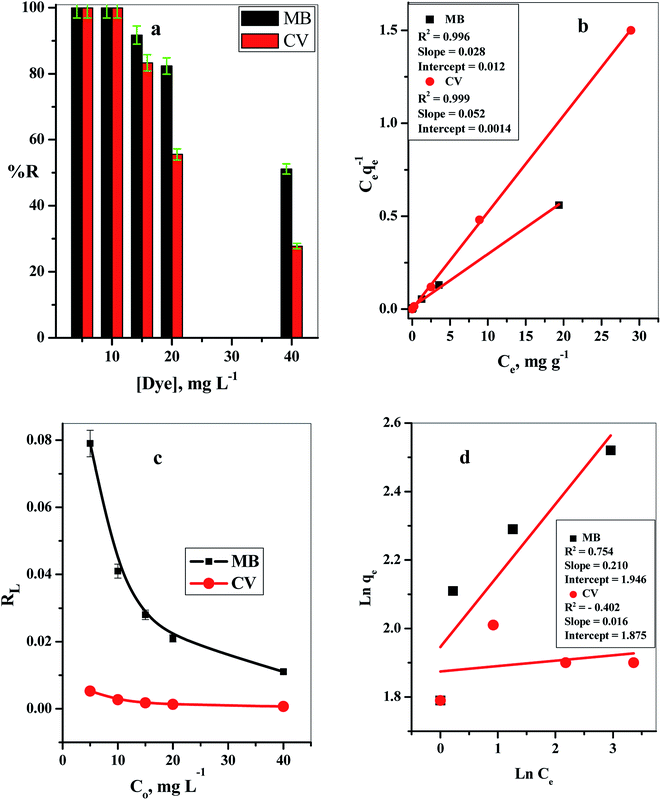
By plotting Ce/qeversus Ce, straight lines with [1/Q°] as the slopes and [1/(Q°b)] as intercepts were obtained, as shown in Fig. 2b.
The base feature of the Langmuir model was determined by the separation factor, RL, known as the equilibrium parameter,60 and could be calculated as follows:
 | (3) |
The Freundlich model describes non-ideal adsorption on a heterogeneous surface and multilayer adsorption.61 It is represented by eqn (4):
 | (4) |
![[thin space (1/6-em)]](https://www.rsc.org/images/entities/char_2009.gif) qevs. ln
qevs. ln![[thin space (1/6-em)]](https://www.rsc.org/images/entities/char_2009.gif) Ce emphasized the validity of this isotherm model.
Ce emphasized the validity of this isotherm model.
The relations between Ce/qeversus Ce (eqn (2); Fig. 2b) and log![[thin space (1/6-em)]](https://www.rsc.org/images/entities/char_2009.gif) qeversus log
qeversus log![[thin space (1/6-em)]](https://www.rsc.org/images/entities/char_2009.gif) Ce (eqn (4)) (Fig. 2d) were plotted to elucidate the applicability of the suitable model for the sorption of both MB and CV dyes in the binary system on the C–GO nanocomposite. The experimental constants and correlation coefficients were evaluated and are represented in Table 1.
Ce (eqn (4)) (Fig. 2d) were plotted to elucidate the applicability of the suitable model for the sorption of both MB and CV dyes in the binary system on the C–GO nanocomposite. The experimental constants and correlation coefficients were evaluated and are represented in Table 1.
| Dye | Langmuir isotherm model | Freundlich isotherm model | ||||
|---|---|---|---|---|---|---|
| Q° (mg g−1) | b (L mg−1) | R 2 | 1/n | K f (mg g−1) | R 2 | |
| MB | 35.71 | 2.330 | 0.996 | 4.76 | 7.00 | 0.754 |
| CV | 19.23 | 37.14 | 0.999 | 62.5 | 6.52 | 0.402 |
The obtained linear correlation coefficient values (R2) for the adsorption of MB and CV from the binary system were 0.996 and 0.999, respectively, which illustrated that the sorption processes of both dyes followed the Langmuir isotherm model, and the dyes were adsorbed at homoenergetic sites as a monolayer on the composite.
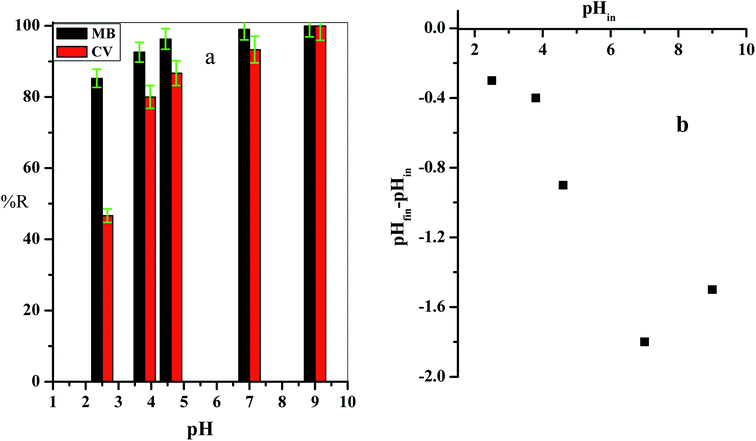
The point of zero charge (pHZPC) of the cotton–graphene oxide composite (Fig. 6b) was demonstrated by detecting the pH values of the treated solutions (pHfin). The ΔpH (pHfin − pHin) values were found to be negative overall in the tested solution pH range (2.00–9.00), which indicated that the C–GO composite carried a negative charge. Therefore, it provides a suitable environment for the sorption of cationic dyes, and the adsorption of cationic dyes is enhanced by the replacement of the H+ protons found in the composite active groups.
3.2. Scaling up
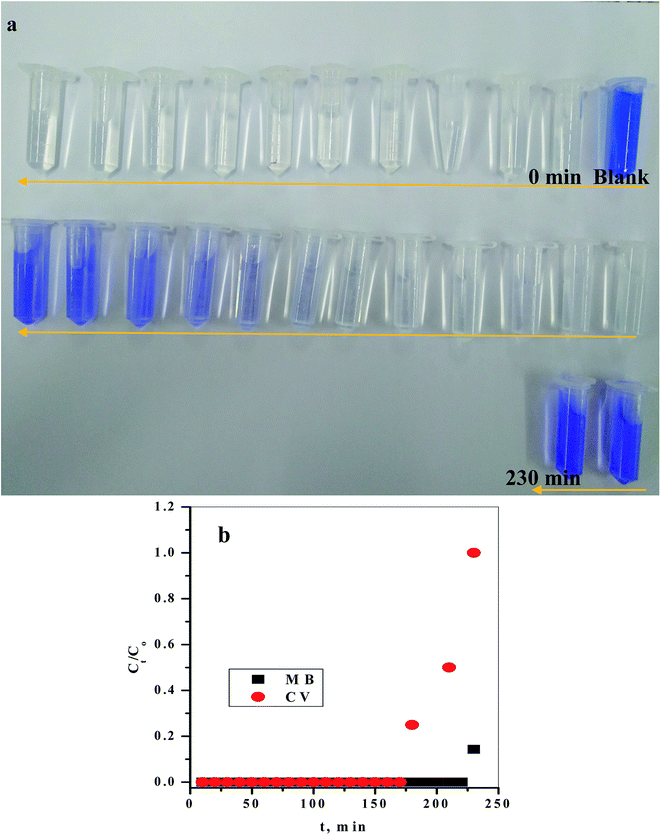
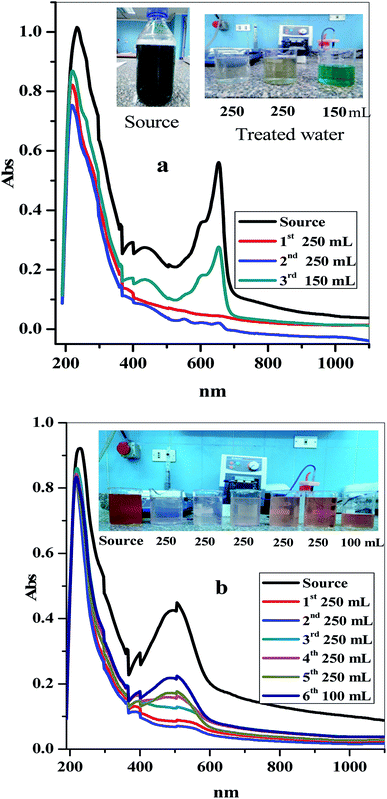
In order to determine the availability and efficiency of the prepared C–GO composite in industrial applications, scaling up the experiment is a vital step. In this concern, 1.00 L of dyed water containing equal concentrations of MB and CV (5.00 mg L−1) at T = 25.0 °C and pH ≈ 7.00 was prepared. This was passed through 0.20 g of the C–GO composite packed in a 1.00 mL plastic tip at a flow rate of 4.55 mL min−1. The treated water was collected every 10.0 min in 2.00 mL-Eppendorf tubes, as shown in Fig. 8a. The concentration of each dye was detected using the first-order derivative spectra from the UV-Vis spectrophotometer. The time required for the breakthrough of the binary cationic dye (MB and CV) system was obtained from the breakthrough curve, which is shown in Fig. 8b. The analysis of the results obtained from the breakthrough curve showed that the MB dye required more time for the breakthrough than the CV dye. This indicated that the prepared C–GO composite preferred to adsorb the MB dye molecules than those of the CV dye.Depending on these results, the prepared C–GO composite was utilized to treat and decontaminate a real sample (two dyed samples of wastewater from a factory), as shown in Fig. 9a and b. The two waste samples were analyzed using UV-Vis spectrophotometry in the range of 1100 to 190 nm. The two samples were treated using the C–GO composite filter, and the concentrations of the two dyes in the treated real sample solutions were detected using UV-Vis spectrophotometry. The variation in solution color between the source sample and the treated ones are shown in Fig. 9a and b. The obtained data showed that the as-prepared C–GO composite was highly efficient in treating industrial wastewater containing such dyes to a satisfactory level. Therefore, the C–GO composite can be used as a promising adsorbent material in industrial adsorption processes.
3.3. Characterization of the composite after sorption
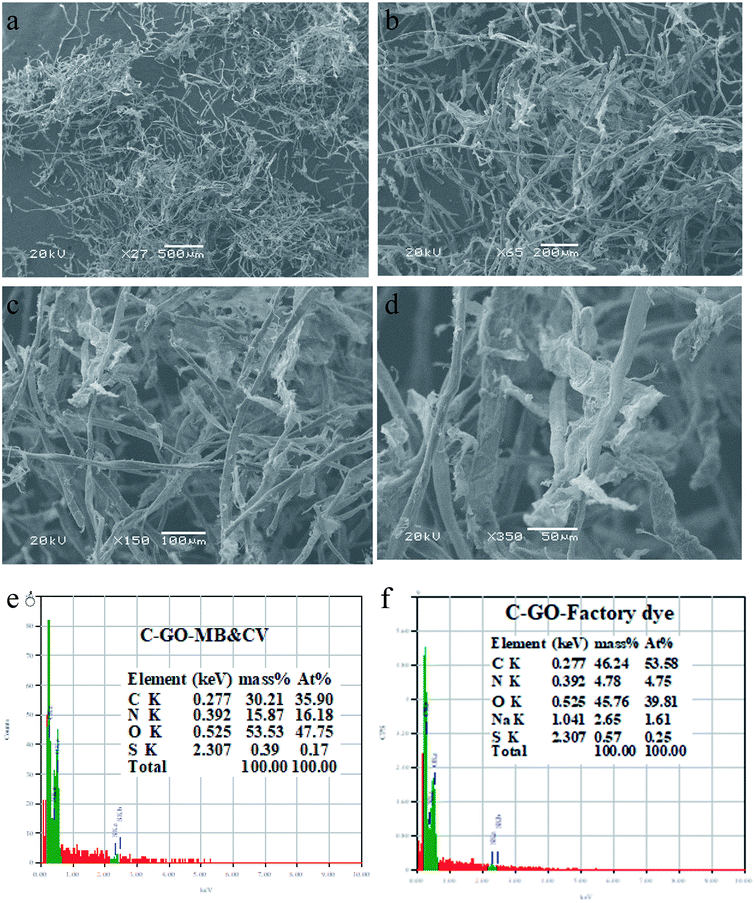
The SEM characterization of the composite after the scaling-up process was investigated, as shown in Fig. 10a–d. The SEM images were taken at different magnifications (×27, ×65, ×150, and ×350), which confirmed that cotton and GO were interwoven tightly with each other very well, as demonstrated in Fig. 10a–d. The results were evident and approved the stability of the prepared composite.Furthermore, EDS analysis was carried out for two used C–GO composite samples-after the scaling-up experiment and after treating the green wastewater. The EDS analysis results showed that it was composed of C and O, as explained in our previous work.52 After the treatment process, the analysis detected N and S (Fig. 10e) in the case of MB and CV dyes and N, S and Na in the case of the green dye (Fig. 10f), which may be related to the dyes adsorbed on the composite.
4. Conclusion
A cotton–graphene oxide (C–GO) composite was prepared and used as an effective adsorbent material for binary cationic dyes (such as MB and CV) in contaminated water. The concentrations of both the dyes in the binary system were determined simultaneously by a new method using the first-order derivative UV-spectra to avoid the complexity of overlapped maximum peaks in the original zero-order absorption spectra. The adsorption efficiency of the (C–GO) composite for the binary cationic dyes (MB and CV) from their solutions strongly depended on the pH of the solution, (C–GO) composite dose, and the initial dye concentration, and fitted the Langmuir isotherm with R2 ≫ 0.99. In the application study, the results obtained revealed that the cotton–graphene oxide composite is a promising adsorbent with a high removal percentage for binary cationic dyes (MB and CV) from real factory wastewater.Conflicts of interest
There are no conflicts to declare.References
- V. K. Gupta, R. Jain, A. Mittal and M. Mathur, J. Colloid Interface Sci., 2007, 309, 464–469, DOI:10.1016/j.jcis.2006.12.010.
- C. Liu, A. M. Omer and X. K. Ouyang, Int. J. Biol. Macromol., 2018, 106, 823–833, DOI:10.1016/j.ijbiomac.2017.08.084.
- M. A. Rauf, I. Shehadeh, A. Ahmed and A. Al-Zamly, World Academy of Science Engineering and Technol., 2009, 3, 608–613 Search PubMed.
- G. O. El-Sayed, Desalination, 2011, 272, 225–232, DOI:10.1016/j.desal.2011.01.025.
- A. Raj, B. Bethi and S. H. Sonawane, J. Environ. Chem. Eng., 2018, 6, 5311–5319, DOI:10.1016/j.jece.2018.08.016.
- M. K. Uddin and U. Baig, J. Cleaner Prod., 2019, 211, 1141–1153, DOI:10.1016/j.jclepro.2018.11.232.
- T. Ngulube, J. R. Gumbo, V. Masindi and A. Maity, Heliyon, 2018, 4, e00838, DOI:10.1016/j.heliyon.2018.e00838.
- L. Lu, R. Shan, Y. Shi, S. Wang and H. Yuan, Chemosphere, 2019, 222, 391–398, DOI:10.1016/0043-1354(90)90063-C.
- Z. U. Zango and S. S. Imam, Nanosci. Nanotechnol., 2018, 8, 1–6, DOI:10.5923/j.nn.20180801.01.
- T. Ngulube, J. R. Gumbo, V. Masindi and A. Maity, J. Environ. Manage., 2017, 191, 35–57, DOI:10.1016/j.jenvman.2016.12.031.
- A. Deb, M. Kamani, A. Debnath, K. L. Bhowmik and B. Saha, Ultrason. Sonochem., 2019, 54, 290–301, DOI:10.1016/j.ultsonch.2019.01.028.
- R. Yang, D. Li, A. Li and H. Yang, Appl. Clay Sci., 2018, 151, 20–28, DOI:10.1016/j.clay.2017.10.016.
- A. C. Lacuesta, M. U. Herrera, R. Manalo and M. D. L. Balela, Surf. Coat. Technol., 2018, 350, 971–976, DOI:10.1016/j.surfcoat.2018.03.043.
- G. Uyar, F. H. Kaygusuz and B. Erim, React. Funct. Polym., 2016, 106, 1–7, DOI:10.1016/j.reactfunctpolym.2016.07.001.
- K. Zhou, Q. Zhang, B. Wang, J. Liu, P. Wen, Z. Gui and Y. Hu, J. Clean. Prod., 2014, 81, 281–289, DOI:10.1016/j.jclepro.2014.06.038.
- S. C. R. Santos and R. A. R. Boaventura, J. Environ. Chem. Eng., 2016, 4, 1473–1483, DOI:10.1016/j.jece.2016.02.009.
- T. Ngulube, J. R. Gumbo, V. Masindi and A. Maity, Heliyon, 2018, 4, e00838, DOI:10.1016/j.heliyon.2018.e00838.
- Y. Bulut and H. Aydin, Desalination, 2006, 194, 259–267, DOI:10.1016/j.desal.2005.10.032.
- N. M. Mahmoodi, M. Arami, H. Bahrami and S. Khorramfar, Desalination, 2010, 264, 134–142, DOI:10.1016/j.desal.2010.07.017.
- V. K. Gupta and Suhas, J. Environ. Manage., 2009, 90, 2313–2342, DOI:10.1016/j.jenvman.2008.11.017.
- M. Ugurlu, Adsorption of a textile dye onto activated sepiolite, Microporous Mesoporous Mater., 2009, 119, 276–283, DOI:10.1016/j.micromeso.2008.10.024.
- Y. Liu, J. Wang, Y. Zheng and A. Wang, Chem. Eng. J., 2012, 184, 248–255, DOI:10.1016/j.cej.2012.01.049.
- V. Sharma, P. Rekha and P. Mohanty, Nanoporous hypercrosslinked polyaniline: an efficient adsorbent for the adsorptive removal of cationic and anionic dyes, J. Mol. Liq., 2016, 222, 1091–1100, DOI:10.1016/j.molliq.2016.07.130.
- R. Pandimurugan and S. Thamibidurai, J. Environ. Chem. Eng., 2016, 4, 1332–1347, DOI:10.1016/j.jece.2016.01.030.
- S. Munirasu, M. A. Haija and F. Banat, Environ. Protect., 2016, 100, 183–202, DOI:10.1016/j.psep.2016.01.010.
- S. Chakraborty, S. De, J. K. Basu and S. Das Gupta, Desalination, 2005, 174, 73–85, DOI:10.1016/j.desal.2004.08.040.
- V. Naddeo and V. Belgiorno, Water Sci. Technol., 2007, 55, 219–225, DOI:10.2166/wst.2008.148.
- F. Erol and T. A. Ozbelge, Chem. Eng. J., 2008, 139, 272–283, DOI:10.1016/j.cej.2007.07.100.
- E. Hu, X. Wu, S. Shang, X. M. Tao, S. X. Jiang and L. Gan, J. Clean. Prod., 2016, 112, 4710–4718, DOI:10.1016/j.jclepro.2015.06.127.
- M. Belkacem, M. khodir and S. Abdelkrim, Desalination, 2008, 228, 245–254, DOI:10.1016/j.desal.2007.10.013.
- V. K. Gupta, R. Kumar, A. Nayak, T. A. Saleh and M. A. Barakat, Adv. Colloid Interface Sci., 2013, 193–194, 24–34, DOI:10.1016/j.cis.2013.03.003.
- S. Ghoreishi and R. Haghighi, Chem. Eng. J., 2003, 95, 163–169, DOI:10.1016/S1385-8947(03)00100-1.
- C. F. Moreira, R. A. R. Boaventura, E. Brillas and P. J. V. Vilar, Appl. Catal., B, 2017, 202, 217–261, DOI:10.1016/j.apcatb.2016.08.037.
- M. T. Yagub, T. K. Sen, S. Afroze and H. M. Ang, Adv. Colloid Interface Sci., 2014, 209, 172–184, DOI:10.1016/j.cis.2014.04.002.
- M. Sillanpää, M. C. Ncibi, A. Matilainen and M. Vepsäläinen, Chemosphere, 2018, 190, 54–71, DOI:10.1016/j.chemosphere.2017.09.113.
- Z. Su, T. Liu, W. Yu, X. Li and N. J. D. Graham, Water Res., 2017, 126, 144–152, DOI:10.1016/j.watres.2017.09.022.
- T. Ngulube, I. R. Gumbo, V. Masindi and A. Maity, J. Environ. Manage., 2017, 191, 35–57, DOI:10.1016/j.jenvman.2016.12.031.
- F. Wang, J. J. H. Haftka, T. L. Sinnige, J. L. M. Hermens and W. Chen, Environ. Pollut., 2014, 186, 226–233, DOI:10.1016/j.envpol.2013.12.010.
- T. Aysu and M. M. KüçükInt, J. Environ. Sci. Technol., 2015, 12, 2273–2284, DOI:10.1007/s13762-014-0623-y.
- G. K. Ramesha, A. Vijaya Kumara, H. B. Muralidhara and S. Sampath, J. Colloid Interface Sci., 2011, 361, 270–277, DOI:10.1016/j.jcis.2011.05.050.
- R. Ahmad, J. Hazard. Mater., 2009, 171, 767–773, DOI:10.1016/j.jhazmat.2009.06.060.
- Y. Lin, X. He, G. Han, Q. Tian and W. Hu, J. Environ. Sci., 2011, 23, 2055–2062, DOI:10.1016/S1001-0742(10)60643-2.
- A. Saeed, M. Sharif and M. Iqbal, J. Hazard. Mater., 2010, 179, 564–572, DOI:10.1016/j.jhazmat.2010.03.041.
- S. Senthilkumaar, P. R. Varadarajan, K. Porkodi and C. V. Subbhuraam, J. Colloid Interface Sci., 2005, 284, 78–82, DOI:10.1016/j.jcis.2004.09.027.
- M. Rafatullah, O. Sulaiman, R. Hashim and A. Ahmad, J. Hazard. Mater., 2010, 177, 70–80, DOI:10.1016/j.jhazmat.2009.12.047.
- G. Crini, Bioresour. Technol., 2006, 97, 1061–1085, DOI:10.1016/j.biortech.2005.05.001.
- T. Chahm, B. A. Martins and C. A. Rodrigues, Environ. Earth Sci., 2018, 77, 508–522, DOI:10.1007/s12665-018-7681-2.
- V. K. Gupta, S. Khamparia, I. Tyagi, D. Jaspal and A. Malviya, Global J. Environ. Sci. Manage., 2015, 1, 71–94, DOI:10.7508/gjesm.2015.01.007.
- C. R. Holkar, A. J. Jadhav, D. V. Pinjari, N. M. Mahamuni and A. B. Pandit, J. Environ. Manage., 2016, 182, 351–366, DOI:10.1016/j.jenvman.2016.07.090.
- M. C. Roco, J. Aerosol Sci., 1998, 29, 749–751, DOI:10.1016/S0021-8502(97)10036-2.
- C. Puri and G. Sumana, Appl. Clay Sci., 2018, 166, 102–112, DOI:10.1016/j.clay.2018.09.012.
- A. I. Abd-Elhamid, A. A. Nayl, A. A. El Shanshory, H. M. A. Soliman and H. F. Aly, RSC Adv., 2019, 9, 5770–5785, 10.1039/c8ra10449b.
- R. Peng, X. Chen and R. Ghosh, Sep. Purif. Technol., 2017, 174, 561–569, DOI:10.1016/j.seppur.2016.10.037.
- L. Dashairya, M. Rout and P. Saha, Adv. Compos. Hybrid Mater., 2018, 1, 135–148, DOI:10.1007/s42114-017-0019-9.
- X. Mi, G. Huang, W. Xie, W. Wang, Y. Liu and J. Gao, Carbon, 2012, 50, 4856–4864, DOI:10.1016/j.carbon.2012.06.013.
- X. Ren, J. Li, X. Tan and X. Wang, Dalton Trans., 2013, 42, 5266–5274, 10.1039/c3dt32969k.
- X. Zhao and P. Liu, Langmuir, 2014, 30, 13699–13706, DOI:10.1021/la504077x.
- A. I. Abd-Elhamid, H. F. Aly, H. A. M. Soliman and A. A. El-Shanshory, J. Mol. Liq., 2018, 265, 226–237, DOI:10.1016/j.molliq.2018.05.127.
- H. Shi, W. Li, L. Zhong and C. Xu, Ind. Eng. Chem. Res., 2014, 53, 1108–1118 CrossRef CAS.
- K. R. Hall, L. C. Eagleton, A. Acrivos and T. Vermeulen, Ind. Eng. Chem. Fundam., 1966, 5, 212–223, DOI:10.1080/19443994.2015.1015173.
- H. M. F. Freundlich, Z. Phys. Chem., 1906, 57, 385, DOI:10.1515/zpch-1907-5723.
- E. Fosso-Kankeu, H. Mittal, S. B. Mishra and A. K. Mishra, J. Ind. Eng. Chem., 2015, 22, 171–178, DOI:10.1016/j.jiec.2014.07.007.
- J. Lu, R. N. Jin, C. Liu, Y. F. Wang and X. kun Ouyang, Int. J. Biol. Macromol., 2016, 93, 547–556, DOI:10.1016/j.ijbiomac.2016.09.004.
- E. Ekrami, F. Dadashian and M. Arami, Desalin. Water Treat., 2016, 57, 7098–7108, DOI:10.1080/19443994.2015.1015173.
- A. M. Abd, E. L. Latif and M. M. Ibrahim, Desalin. Water Treat., 2009, 6, 252–268, DOI:10.5004/dwt.2009.501.
- K. V. Kumar and A. Kumaran, Biochem. Eng. J., 2005, 27, 83–93, DOI:10.1016/j.bej.2005.08.004.
| This journal is © The Royal Society of Chemistry 2020 |

