 Open Access Article
Grape skin fermentation by Lactobacillus fermentum CQPC04 has anti-oxidative effects on human embryonic kidney cells and apoptosis-promoting effects on human hepatoma cells
Jia Liuabc,
Fang Tan*d,
Xinhong Liuabce,
Ruokun Yiabc and
Xin Zhao *abc
*abc
aChongqing Collaborative Innovation Center for Functional Food, Chongqing University of Education, Chongqing 400067, China. E-mail: liujia@cque.edu.cn; liuxh@cque.edu.cn; yirk@cque.edu.cn; zhaoxin@cque.edu.cn; Tel: +86-23-6265-3650
bChongqing Engineering Research Center of Functional Food, Chongqing University of Education, Chongqing 400067, China
cChongqing Engineering Laboratory for Research and Development of Functional Food, Chongqing University of Education, Chongqing 400067, China
dDepartment of Public Health, Our Lady of Fatima University, Valenzuela 838, Philippines
eCollege of Biological and Chemical Engineering, Chongqing University of Education, Chongqing 400067, China. E-mail: tanfang@foods.ac.cn
First published on 29th January 2020
Abstract
Studies on the antioxidant effects of grapes have attracted increasing interest. We used Lactobacillus fermentum CQPC04 to ferment grape skins. Components of the fermentation solution were separated and identified via high-performance liquid chromatography, and polyphenol compounds, including resveratrol and epicatechin, were isolated and identified from the fermentation solution. The major fermentation production components were assessed for their antioxidative abilities when administered under H2O2-induced oxidative damage in cell culture models. The fermentation solution significantly reduced oxidative damage, increased the expressions of the superoxide dismutase (SOD), catalase (CAT), glutathione (GSH), and GSH-peroxidase (GSH-Px) antioxidant genes and proteins in human embryonic kidney (293T) cells, stimulated the indices of total antioxidant capacity (T-AOC), SOD, CAT, GSH, and GSH-Px, and inhibited the indices of lactate dehydrogenase (LDH), malondialdehyde (MDA), and nitric oxide (NO), and the fermentation solution alleviated the increase in glutathione oxidized (GSSG) caused by oxidative damage, and the ratio of GSH/GSSG was up-regulated compared to the damage group. The fermentation solution also accelerated Human hepatoma (HepG2) cell death. Applying the fermentation solution to HepG2 cells significantly altered the cell morphology. HepG2 cell apoptosis and cell cycles were detected via flow cytometry. The fermentation solution promoted the apoptotic rate, and more cells were retained in the G2 phase, which prevented cells from further dividing. In the fermented group, the mRNA expression levels of Bcl-2, cox-2, PCNA, CD1, C-myc, CDK4, NF-κB and pRb1 were significantly decreased, and the expression levels of Caspase-3, Caspase-7, Caspase-8, Caspase-9, p53, TGF-β, and p21 were higher than those in the normal group. Phospho-NF-κB (p65), Bax and Caspase-8 protein expression increased, and NF-κB (p65) protein expression decreased. Protein expression levels also promoted apoptosis. Fermented grape skin solution is bioavailable in vitro and may help prevent oxidation and cancer cell proliferation.
1. Introduction
Many free radicals are produced through breathing and metabolism. Under normal physiological conditions, free radical generation and the antioxidant system are in a state of dynamic equilibrium in the body.1 When the accumulation of free radicals exceeds the protective capacity of the antioxidant system, the balance is broken and manifests as oxidative stress.2 Studies have shown that oxidative stress can damage various macromolecules (e.g., polysaccharides, proteins, lipids, and DNA) in cells.3–5 Oxidative stress can also stimulate signaling pathways involved in apoptosis, inflammatory response, and cell function changes, ultimately leading to pathological changes in diseases, such as Parkinson's, Alzheimer's, and cancer.6–8 Therefore, improving antioxidant capacity and proper intake of antioxidative foods are important for health. Studies have shown that pumpkin polysaccharides relieve oxidative damage to liver cells9 and that flavonoids can inhibit hemolysis caused by oxidative damage from H2O2, reduce peroxide production and increase peroxidase activity.10 Furthermore, polyphenols can improve the oxidative stress response in rats with Parkinson's disease.11The liver is the main metabolic organ in the body. More than 90% of primary liver cancer is hepatocellular carcinoma (HCC), one of the most common malignant tumors. Environmental factors, such as hepatitis B and C viral infections, drinking polluted water, parasitic diseases, and chemical substances, are closely related to HCC pathogenesis.12 Because liver cancer occurrence shows occult characteristics, most patients have already entered the middle and late stages when diagnosed. Due to the abundant blood supply to the liver, cancer cells are easily transferred inside and outside the organ, making HCC difficult to treat.
The growth and transfer of cancer cells and tissues require large energy supplies. ATP production in cancer cells depends on the developed mitochondria and glycolysis system,13 which can maintain a high energy production state in any environment. Most anticancer agents exert anticancer effects by acting on mitochondria to cause functional damage. Related studies have shown that silencing-related oncogene or protein expressions can interfere with mitochondrial activity and activate death receptor activity, thereby promoting apoptosis or autophagy apoptosis.14 Polyphenols inhibit the growth of intestinal cancer cells,15 liver cancer cells16 and breast cancer cells.17 For example, polyphenols can inhibit the growth of transplanted liver cancer cell tumors (SMMC-7721) in nude mice.18
Grape skins contain many active ingredients,19 including polyphenols, cellulose, and proteins, such as resveratrol, tannic acid, catechin, quercetin, and anthocyanins, which have strong antioxidative, antimutative, antibacterial, anti-inflammatory, cardiovascular protective and other effects. With increases in grape production and the rapid development of the grape industry, the annual production of grape dregs in China is also increasing rapidly. Only 25% of dregs can be recycled and reused, and most are used as feed or fertilizer or are discarded. Recent in-depth research has identified more than 10 monomeric phenols, including catechin, quercetin, gallic acid and chlorogenic acid, from grape skin residue.20
Lactobacillus fermentum CQPC04 (LF-CQPC04) is a fermented Lactobacillus spp. isolated from traditional pickled vegetables in Sichuan, China, by the Chongqing Collaborative Innovation Center for Functional Food. The strain was deposited at the China General Microorganisms Collection and Management Center (CGMCC no. 14493). Our previous evaluation of the LF-CQPC04 activity showed that the strain had a survival rate of 84.14% in artificial gastric acid at pH 3.0 and a growth rate of 66.38% in 0.3% bile salt. This strain retains good activity when it reaches the intestinal tract. In addition, we established an animal obesity model and found that the strain had a good lipid-lowering effect after injecting it via oral gavage. Here, we explored the functional effects of strain LF-CQPC04 and of reusing grape skin.
2. Materials and methods
2.1 Sample processing
Fresh JuFeng grape skins were vacuum dried and ground to a powder through a 500-mesh screen. In the fermentation group, 10 g of grape skin powder and 1 g of white sugar were dissolved in 100 mL of Ultra-Pure water, then inoculated 1 mL of 1 × 10⁷ CFU mL−1 LF-CQPC04 into the solution and strain control group inoculated with 1 mL of 1 × 10⁷ CFU mL−1 Lactobacillus delbrueckii subsp. Bulgaricus (LB, China General Microbiological Culture Collection Center, CGMCC no. 1.16075). The solution was fermented at 37 °C in a 100 rpm shaker. After 24, 48, 72, 96 and 120 hours, the solution was centrifuged at 12![[thin space (1/6-em)]](https://www.rsc.org/images/entities/char_2009.gif) 000 rpm for 10 min, then the supernatant was collected and stored at −80 °C. In the control group, 10 g of grape skin powder was dissolved in 100 mL of 60% ethanol solution in a water bath at 70 °C for 4 h. The precipitate was discarded by centrifugation, and the solution was rotary evaporated (R-1001VN, Zhengzhou Great Wall Scientific Industrial and Trade Co., Ltd, Zhengzhou, Henan, China) to remove the ethanol to obtain the grape skin extract (CF: the fermentation solution fermented by LF-CQPC04; BF: the fermentation solution fermented by Lactobacillus delbrueckii subsp. Bulgaricus; and WE: the solution extracted by ethanol).
000 rpm for 10 min, then the supernatant was collected and stored at −80 °C. In the control group, 10 g of grape skin powder was dissolved in 100 mL of 60% ethanol solution in a water bath at 70 °C for 4 h. The precipitate was discarded by centrifugation, and the solution was rotary evaporated (R-1001VN, Zhengzhou Great Wall Scientific Industrial and Trade Co., Ltd, Zhengzhou, Henan, China) to remove the ethanol to obtain the grape skin extract (CF: the fermentation solution fermented by LF-CQPC04; BF: the fermentation solution fermented by Lactobacillus delbrueckii subsp. Bulgaricus; and WE: the solution extracted by ethanol).
2.2 Antioxidant in vitro
The 1,1-diphenyl-2-picrylhydrazyl (DPPH) radical-scavenging assay (Solarbio Life Sciences, Beijing, China) was performed per the method described by Thaipong et al.21 The fermented samples (24, 48, 72, 96 and 120 hours) were added to 0.1 mM mL−1 DPPH, dissolved in methanol (0.1 mL) solution and mixed thoroughly. After incubation for 30 min in the dark at room temperature, the absorbance was measured at 570 nm. The 2,2′-azino-bis(3-ethylbenzothiazoline-6-sulfonic acid) (ABTS) (Solarbio Life Sciences, Beijing, China) working fluid was prepared per the method described by Roberta et al.22 Briefly, 20 μL of fermentation sample solution and 200 μL of ABTS working solution were mixed in a well. The absorbance was measured at 720 nm using a microplate reader (Thermo Fisher Scientific, New York, USA).2.3 Induction of cellular oxidative damage
The human embryonic kidney (293T) cells (the 293T cell line was purchased from Cell Bank of the Chinese Academy of Science (Shanghai, China)) were seeded in 96-well plates at 1 × 10⁶, then cultured in a constant-temperature incubator (thermo371, Thermo Fisher Scientific, New York, USA) at 37 °C and 5% CO2 for 24 h with DMEM (H) (Solarbio Life Sciences, Beijing, China). After the cells were completely adhered, culture solution was aspirated and washed once with phosphate-buffered saline (PBS). The 293T cells were randomly divided into 8 groups. The blank group contained 200 μL of cell medium but was not inoculated with cells. The control group was inoculated with cells, and 200 μL of cell medium was added, but no H2O2. The experimental group comprised different concentrations of H2O2 (0, 100, 200, 300, 400, 500, 600, and 700 μmol L−1) in 200 μL of cell medium for the oxidative damage model, with 3 replicates per group. After culturing the cells for 1, 2 and 3 hours, the original culture solution was discarded, 100 μL of the new culture solution was added, and the cell viability was measured using the CCK-8 method (Solarbio Life Sciences, Beijing, China).2.4 Drug dosing concentration screening
The 293T cells and human hepatoma (HepG2) cells (the HepG2 cell line was purchased from Cell Bank of the Chinese Academy of Science (Shanghai, China)) were seeded in 96-well plates at 1 × 10⁶ and cultured in a constant-temperature incubator at 37 °C and 5% CO2 for 24 h with DMEM (H) and DMEM (L) (Solarbio Life Sciences, Beijing, China). After the cells had adhered completely, the culture solution was aspirated and washed once with PBS. HepG2 and 293T cells were randomly divided into 8 groups. The blank group received 200 μL of culture medium but was not inoculated with cells. The control group was inoculated with cells and received 200 μL of cell medium but no extract. The experimental group received different extract concentrations (0, 100, 200, 300, 400, 500, 600, 700 μmol L−1) and 200 μL of cell medium for treatment, with 3 replicates per group. After the cells were cultured for 48 hours, the original culture solution was discarded, 100 μL of the new culture solution was added, and the cell viability was measured via the CCK-8 method.2.5 Measurement of cell indices
The cell samples were broken using an ultrasonic cell disrupter (Ultrasonic Homogenizer Scientz-IID, Ninbo Scientz Biotechnology Co., Ltd., Ningbo, Zhejiang, China). The levels of lactate dehydrogenase (LDH), glutathione (GSH), glutathione oxidized (GSSG), catalase (CAT), superoxide dismutase (SOD), GSH-peroxide (GSH-Px), total antioxidant capacity (T-AOC), nitric oxide (NO) and malondialdehyde (MDA) were determined using assay kits (Nanjing Jiancheng Bioengineering Institute, Nanjing City, China).2.6 Measurement of cell cycle and apoptosis
Cell samples were treated with 0.25% EDTA–trypsin (Solarbio Life Sciences, Beijing, China) and centrifuged at 1000 rpm for 10 min at 4 °C, then the supernatant was removed, washed with PBS that had been precooled at 4 °C, and centrifuged again for 10 min. The cell cycle was detected via flow cytometry using the Cell Cycle and Apoptosis Analysis Kit (Yeasen, Shanghai, China). Cell apoptosis was detected via flow cytometry (AccuriC6, BD Biosciences, San Jose, CA, USA.) using the Annexin V-FITC/PI Apoptosis Detection Kit (Yeasen, Shanghai, China).2.7 Reverse transcription-quantitative polymerase chain reaction (RT-qPCR)
Total RNA was extracted using assay kits (BiaMaiKe; Beijing, China). The RNA concentration and purity were determined using a microspectrophotometer (Nano-300, Hangzhou Allsheng Instruments Co., Ltd., Hangzhou, Zhejiang, China). RNA was reverse-transcribed to cDNA using the RevertAid First Stand cDNA Synthesis Kit (Thermo Fisher Scientific, Baltics, USA). Target gene expression levels were measured using HieffTM qPCR SYBR® Green Master Mix (High Rox Plus) (Yeasen, Shanghai, China) with the Step One Plus Real-Time PCR System (Thermo Fisher Scientific, New York, NY, USA). The target gene expression was normalized with Actin and calculated using the 2−ΔΔCt method. Table 1 lists the RT-qPCR primers used. RT-qPCR was performed using the following cycling conditions: predenaturation at 95 °C for 3 min, followed by 40 cycles of denaturation at 95 °C for 30 s, annealing at X °C for 30 s (X means the annealing temperature which was determined by gradient PCR (A200 Gradient Thermal cycle, Zhejiang LongGene Scientific Instrument Co., Ltd., Hangzhou, Zhejiang, China)) (Table 1), and extension at 72 °C for 30 s.| Gene | Primer sequence | X (annealing temperature, °C) |
|---|---|---|
| Actin | F: 5′-TCAAGAAGGTGGTGAAGCAGG-3′ | |
| R: 5′-AGCGTCAAAGGTGGAGGAGTG-3′ | ||
| CAT | F: 5′-TGGAGCTGGTAACCCAGTAGG-3′ | 57.0 |
| R: 5′-CCTTTGCCTTGGAGTATTTGGTA-3′ | ||
| SOD1 | F: 5′-GGTGGGCCAAAGGATGAAGAG-3′ | 57.0 |
| R: 5′-CCACAAGCCAAACGACTTCC-3′ | ||
| GSH | F: 5′-GGGAGCCTCTTGCAGGATAAA-3′ | 57.0 |
| R: 5′-GAATGGGGCATAGCTCACCAC-3′ | ||
| GSH-Px | F: 5′-CAGTCGGTGTATGCCTTCTCG-3′ | 57.0 |
| R: 5′-GAGGGACGCCACATTCTCG-3′ | ||
| p53 | F: 5′-CTTTGAGGTGCGTGTTTGTGC-3′ | 51.6 |
| R: 5′-GGTTTCTTCTTTGGCTGGGGA-3′ | ||
| CDK4 | F: 5′-ATGGCTACCTCTCGATATGAGC-3′ | 56.6 |
| R: 5′-CATTGGGGACTCTCACACTCT-3′ | ||
| CyclinD1 | F: 5′-GCTGCGAAGTGGAAACCATC-3′ | 60.3 |
| R: 5′-CCTCCTTCTGCACACATTTGAA-3′ | ||
| p21 | F: 5′-TGTCCGTCAGAACCCATGC-3′ | 54.9 |
| R: 5′-AAAGTCGAAGTTCCATCGCTC-3′ | ||
| pRb1 | F: 5′-CTCTCGTCAGGCTTGAGTTTG-3′ | 66.0 |
| R: 5′GACATCTCATCTAGGTCAACTGC-3′ | ||
| c-myc | F: 5′-TGGAACGTCAGAGGAGAAACGA-3′ | 50.0 |
| R: 5′-CTTGAACGGACAGGATGTAGGC-3′ | ||
| Caspase-3 | F: 5′-CATGGAAGCGAATCAATGGACT-3′ | 50.7 |
| R: 5′-CTGTACCAGACCGAGATGTCA-3′ | ||
| Caspase-8 | F: 5′-ATTTTGAGATCAAGCCCCACG-3′ | 66.0 |
| R: 5′-GGATACAGCAGATGAAGCAGTCC-3′ | ||
| Caspase-9 | F: 5′-CTCAGACCAGAGATTCGCAAAC-3′ | 50.0 |
| R: 5′-GCATTTCCCCTCAAACTCTCAA-3′ | ||
| Caspase-7 | F: 5′-CGGTCCTCGTTTGTACCGTC-3′ | 64.4 |
| R: 5′-CGCCCATACCTGTCACTTTATCA-3′ | ||
| cox-2 | F: 5′-CTGGCGCTCAGCCATACAG-3′ | 65.0 |
| R: 5′-CGCACTTATACTGGTCAAATCCC-3′ | ||
| Bcl-2 | F: 5′-ATGTGTGTGGAGAGCGTCAACC-3′ | 65.0 |
| R: 5′-CAGAGACAGCCAGGAGAAATCAA-3′ | ||
| NF-κB | F: 5′-GAAGCACGAATGACAGAGGC-3′ | 50.9 |
| R: 5′-GCTTGGCGGATTAGCTCTTTT-3′ | ||
| PCNA | F: 5′-CCAGGGCTCCATCCTCAAGAA-3′ | 62.0 |
| R: 5′-GACGTGGGACGAGTCCATGCT-3′ | ||
| TGF-β | F: 5′-CAGCGTGCCTAAACTTTATCAGC-3′ | 58.2 |
| R: 5′-TCAGGAGGATGTTTCACATGGA-3′ |
2.8 Western blot analysis
Total protein was extracted from the cells using 200 μL of radio immunoprecipitation assay (RIPA) buffer and 2 μL of phenylmethanesulfonyl fluoride (PMSF) (Easy Bio, Beijing, China). The protein was extracted for 30 minutes on ice and denatured by boiling for 10 minutes at 100 °C. The extracted protein concentrations were determined using a Quartzy Quick Start Bradford Protein Assay Kit (Bio-Rad Laboratories, Hercules, CA, USA). Protein (30 μg) was separated using 12% sodium dodecyl sulfate-polyacrylamide gel electrophoresis (SDS-PAGE; Whatman Schleicher & Schuell, Keene, NH, USA) and transferred to nitrocellulose membranes (Thermo Fisher Scientific, Waltham, MA, USA). These membranes were sealed for 2 hours in 5% skim milk solution, then washed 5 times with TBST 1× (Solarbio Life Sciences, Beijing, China) and incubated with primary antibodies against SOD, CAT, GSH, GSH-Px, Caspase-8, Phospho-NF-κB (p65), NF-κB (p65), Bax and β-actin (Invitrogen, Thermo Fisher Scientific, RockFord, USA) overnight at 4 °C. The blots were washed 5 times with TBST 1×, then incubated with horseradish peroxidase (HRP)-conjugated goat-anti-rabbit immunoglobulin G (IgG) secondary antibody (Cell Signaling Technology Inc., Danvers, MA, USA) for 1 hour at 25 °C and washed 5 times with TBST 1×. Finally, the blots were incubated with enhanced chemiluminescence (ECL) HRP substrates (Solarbio Life Sciences, Beijing, China), and the expression was imaged using a Tanon 5200 Luminous Imaging Workstation (Tanon Science and Technology Co., Ltd., Shanghai, China). Semiquantitative analysis of protein expression was performed using ImageJ 1.44 software (National Institutes of Health, Bethesda, MD, USA).2.9 High-performance liquid chromatography (HPLC) assay
The standard products of p-hydroxycinnamic acid, neochlorogenic acid, chlorogenic acid, rutin, polydatin, rosmarinic acid, and epicatechin gallate (Shanghai Yuanye Biotechnology Co., Ltd., Shanghai, China) were weighed, and 0.1 mg mL−1 solution was prepared using methanol (Thermo Fisher Scientific, USA). The grape skin fermentation solution by lactic acid bacteria was extracted with a HyperSep C18 column (Thermo Scientific, Bellefonte, PA), eluted with methanol–water (1![[thin space (1/6-em)]](https://www.rsc.org/images/entities/char_2009.gif) :
:![[thin space (1/6-em)]](https://www.rsc.org/images/entities/char_2009.gif) 1, v/v), and filtered through a 0.22 μm filter. Fermentation components were detected (UltiMate3000 HPLC System, Thermo Fisher Scientific, USA) using the following chromatographic conditions: Accucore C18 column (4.6 mm × 150 mm, 2.6 μm, Thermo Fisher Scientific), flow rate of 0.5 mL min−1, detection wavelength of 285 nm, injection volume of 10 L, column temperature of 30 °C, collection time of 75 min, and mobile phases A for acetonitrile (Thermo Fisher Scientific, USA) and B for 0.1% aqueous acetic acid solution.
1, v/v), and filtered through a 0.22 μm filter. Fermentation components were detected (UltiMate3000 HPLC System, Thermo Fisher Scientific, USA) using the following chromatographic conditions: Accucore C18 column (4.6 mm × 150 mm, 2.6 μm, Thermo Fisher Scientific), flow rate of 0.5 mL min−1, detection wavelength of 285 nm, injection volume of 10 L, column temperature of 30 °C, collection time of 75 min, and mobile phases A for acetonitrile (Thermo Fisher Scientific, USA) and B for 0.1% aqueous acetic acid solution.
2.10 Statistical analysis
The data were statistically analyzed using SPSS 17.0 and GraphPad Prism 7 statistical software. The experimental results are expressed as the means ± standard deviation (SD). One-way ANOVA or t-tests were used for between-group comparisons. P < 0.05 indicated a statistically significant difference. All experiments were repeated three times.3. Results
3.1 Antioxidant activities
The grape skin fermentation had a higher antioxidant capacity and better time dependence (Fig. 1). To determine the antioxidant capacity of the fermentation solution, the DPPH and ABTS radical scavenging activities of the fermentation solution were measured. The DPPH radical scavenging activities of the LP-CQPC04 fermentation solution (CF) at 72, 96 and 120 hours were 97.54%, 92.86% and 92.69%, respectively. The ABTS radical scavenging activities of the fermentation solution at 72, 96 and 120 hours were 81.00%, 93.60% and 92.43%, respectively. The abilities of the Lactobacillus delbrueckii subsp. Bulgaricus fermentation solution (BF) to resist DPPH and ABTS were the highest at 120 hours at 86.68% and 68.54%, respectively. The ethanol extraction (WE) resistance rates to DPPH and ABTS were 54.53% and 57.98%, respectively.3.2 H2O2 induced oxidative damage model in human embryonic kidney (293T) cells
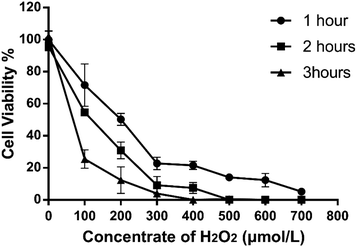
Different H2O2 concentrations exerted different inhibitory effects on 293T cell growth, and the cell survival rate decreased as the concentration increased (Fig. 2). Compared with the control group, H2O2 treatment significantly inhibited cell survival of 293T cells, and the inhibition increased with time, concentration, performance time and concentration dependence. When treated with 100 μmol L−1 of H2O2 for 2 hours, the cell viability decreased significantly, reaching an IC50 of 54.67 ± 3.16%, which differed significantly from that of the control group (95.70 ± 5.32%). If the concentration is too low, the cell damage will be minimal; if the concentration is too high, the cell death will be excessive. Therefore, the H2O2 concentration used in the oxidative damage model was 100 μmol L−1, and the action time was 2 hours.3.3 Effect of grape skin fermentation solution on the growth of human embryonic kidney (293T) cells and human hepatoma (HepG2) cells
Applying fermentation solution to 293T cells for 48 hours promoted cell proliferation compared with that of the blank control group (Fig. 3A). When the concentration of the CF group exceeded 400 μmol L−1, cell proliferation was significantly inhibited with the increasing concentration, while the BF and WE cell proliferation was not significant. Therefore, the CF concentrations of 300 μmol L−1 were used as the recommended doses for oxidation damage subsequent experiments. After 48 hours, the grape skin fermentation solution was applied to human liver cancer HepG2 cells (Fig. 3B) and compared with the blank control group. Cell growth was significantly inhibited over time in both periods. The increase was extended and time-dependent. When the CF concentration was 150 μmol L−1, the action time was 48 hours, and the cell viability was 55.42 ± 1.2%. When the BF concentration was 200 μmol L−1, the action time was 48 hours, and the cell viability was 53.20 ± 2.6%. When the WE concentration was 300 μmol L−1, the action time was 48 hours, and the cell viability was 44.48 ± 1.5%.3.4 Effect of grape skin fermentation solution on cell morphology
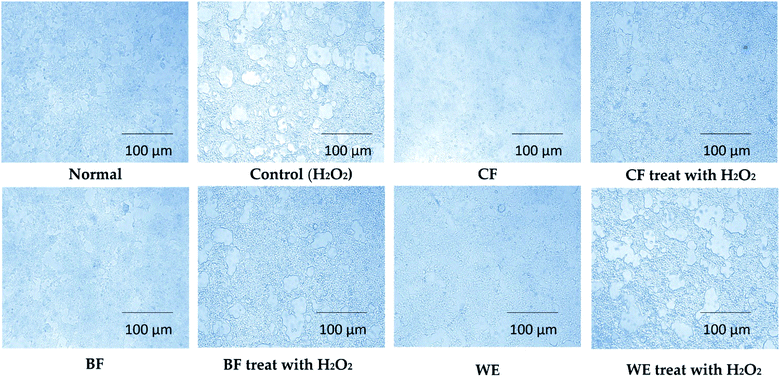
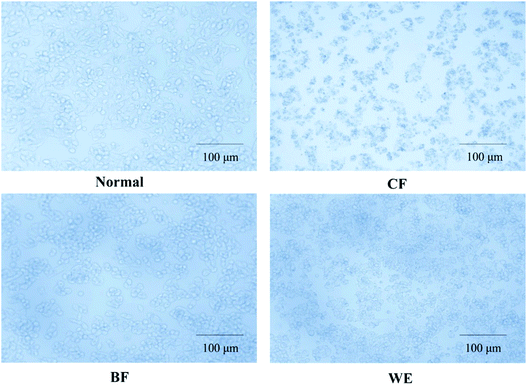
Cell morphology was observed under an inverted microscope (Olympus, Tokyo, Japan). The normal 293T cells were numerous, full, and polygonal, with rich cytoplasm and pseudo-like feet staggered around them (Fig. 4). Cells in the H2O2 induction model group were severely shrunken, reduced in number, and severely damaged. In the CF treatment group, the cells increased in number and were in a good state; after H2O2 induced oxidation, the CF appeared to be better protected cells from shrinkage, the cell numbers increased, and the degree of damage was reduced. The BF and WE also protected cells from oxidative damage but were less effective than the CF. In the control group, the HepG2 cells were irregularly polygonal or long fusiform, and the cytoplasm was full and aggregated (Fig. 5). After CF treatment, the cells shrunk in size; the nuclear chromatin broke into different sized fragments, and some organelles, such as the mitochondria and ribosomes, were aggregated, appearing as particles in the cytoplasm, with enhanced refraction, and apoptosis. The BF and WE treatment groups also showed apoptosis that was less severe than that of the CF group.3.5 LDH, GSH, GSSG, GSH-Px, CAT, MDA, SOD, T-AOC, and NO contents in human embryonic kidney (293T) cells
GSH, GSH-Px, CAT, SOD, and T-AOC were the highest in the normal cell group, and the GSH, GSH-Px, and CAT contents were significantly higher in the CF group than in the WE group (Table 2) (P < 0.05). However, LDH, MDA and NO were the lowest in the normal cell group, and the NO content in the CF group was significantly lower than that in the control and WE groups (P < 0.05). The content of LDH was also significantly lower than BF group and WE group, similar with normal group. The content of MDA was not significantly differ in the CF, BF and WE groups, but the MDA content was significantly higher than that in the control group (P < 0.05). The relative expression of glutathione oxidized (GSSG) was up-regulated in oxidative damage model, total-GSH + GSSG was lower in the control group than normal and other experiment treatment group, the rate of GSH/GSSG was shown down-regulated in control (Table 3) (p < 0.05).| Group | LDH (U/104) | GSH-Px (U per mg prot.) | CAT (U/104) | MDA (nmol/104) | SOD (U/104) | T-AOC (U/104) | NO (μmol/104) |
|---|---|---|---|---|---|---|---|
| a a–cMean values with different letters in the same column differ significantly (P < 0.05) by Duncan's multiple range test. Values presented are the means ± standard deviation (N = 3/group) (CF: the fermentation solution fermented by LF-CQPC04; BF: the fermentation solution fermented by Lactobacillus delbrueckii subsp. Bulgaricus; and WE: the solution extracted by ethanol). | |||||||
| Normal | 5.44 ± 0.16a | 2.50 ± 0.20d | 2.77 ± 0.21b | 1.42 ± 0.04a | 18.12 ± 0.61c | 18.32 ± 0.79c | 4.20 ± 0.39a |
| Control | 8.90 ± 0.33c | 0.91 ± 0.11a | 1.43 ± 0.10a | 2.72 ± 0.17c | 10.46 ± 0.57a | 11.42 ± 0.16a | 8.43 ± 0.49b |
| CF | 6.06 ± 0.28a | 1.98 ± 0.06c | 2.48 ± 0.22c | 1.65 ± 0.07b | 16.61 ± 0.68b | 14.94 ± 0.97b | 4.92 ± 0.41a |
| BF | 7.40 ± 0.45b | 1.62 ± 0.08b | 1.95 ± 0.11b | 1.75 ± 0.09b | 16.63 ± 0.32b | 14.62 ± 1.22b | 4.38 ± 0.66a |
| WE | 7.41 ± 0.40b | 1.72 ± 0.03b | 1.88 ± 0.05b | 1.79 ± 0.08b | 15.73 ± 0.47b | 13.40 ± 0.31b | 5.29 ± 0.25a |
| Group | GSH (μg/104) | GSSG | GSH/GSSG |
|---|---|---|---|
| a a–cMean values with different letters in the same column differ significantly (P < 0.05) by Duncan's multiple range test. Values presented are the means ± standard deviation (N = 3/group) (CF: the fermentation solution fermented by LF-CQPC04; BF: the fermentation solution fermented by Lactobacillus delbrueckii subsp. Bulgaricus; and WE: the solution extracted by ethanol). | |||
| Normal | 3.13 ± 0.14c | 0.47 ± 0.13b | 6.69 ± 0.83b |
| Control | 1.89 ± 0.07a | 0.40 ± 0.22a | 4.97 ± 1.33a |
| CF | 2.86 ± 0.12bc | 0.44 ± 0.14b | 6.60 ± 0.92a |
| BF | 2.76 ± 0.27bc | 0.44 ± 0.17b | 6.25 ± 0.87a |
| WE | 2.67 ± 0.24b | 0.42 ± 0.09a | 6.33 ± 0.39a |
3.6 SOD, GSH, CAT, and GSH-Px mRNA and protein expressions in human embryonic kidney (293T) cells
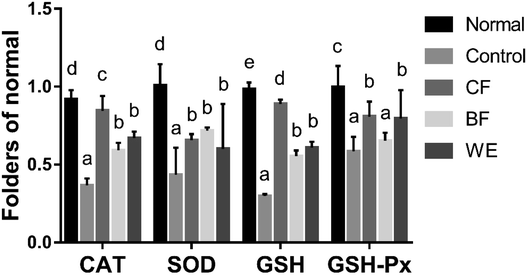
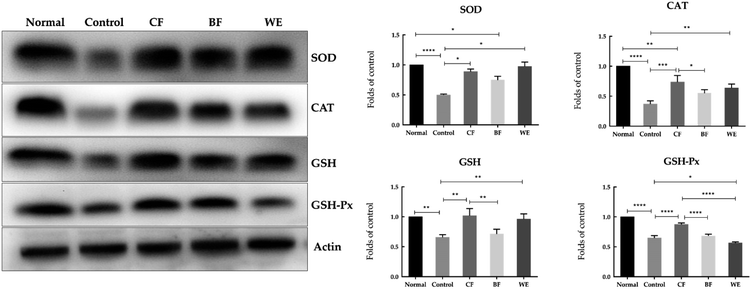
The mRNA expressions of SOD, GSH, CAT, and GSH-Px were highest in the normal group and lowest in the control group (Fig. 6). However, after CF and WE antioxidant protection, the mRNA expression levels were significantly higher than those of the control group. The mRNA expressions of SOD, GSH, CAT and GSH-Px in the CF group were higher than those in the WE and BF groups. Fig. 7 shows the SOD, CAT, GSH, and GSH-Px protein levels as determined by western blot analysis. Compared with the normal group, the protein levels of SOD, CAT, GSH, and GSH-Px in the model group were significantly reduced. However, compared with the model group, the protein levels of SOD, CAT, GSH, and GSH-Px increased significantly after grape fermentation by LF-CQPC04 treatment. BF and WE also significantly increased the SOD, CAT, GSH, and GSH-Px protein levels.3.7 Effect of grape skin fermentation solution on human hepatoma (HepG2) cells cycle and apoptosis
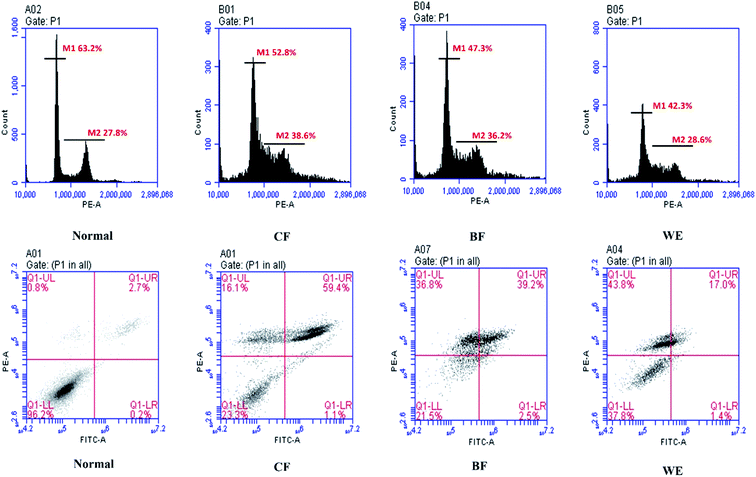
As shown in Fig. 8, the normal HepG2 cells are in the G0/G1 phase reach to 63.2%, which can be transformed into the G2 phase (27.8%), and the cell proliferation is normal. After 48 hours of treatment of HepG2 cells with CF, the G1/S phase was prolonged (52.8%), and most of the cells remained in the S phase and could not be converted to the G2 phase (S/G2:38.6%). The same result is shown in WE and BF. Apoptosis results indicated that the number of apoptosis and cell debris in the cells treated with the fermentation broth increased. Compared with the normal group, the cell viability of CF, BF, WE was 23.3%, 21.5%, and 37.8%. The number of late apoptosis of cells after CF treatment accounted for 59.4%, and BF and WE were 39.2% and 17.0%, respectively.3.8 Human hepatoma (HepG2) cell-associated mRNA and protein expressions
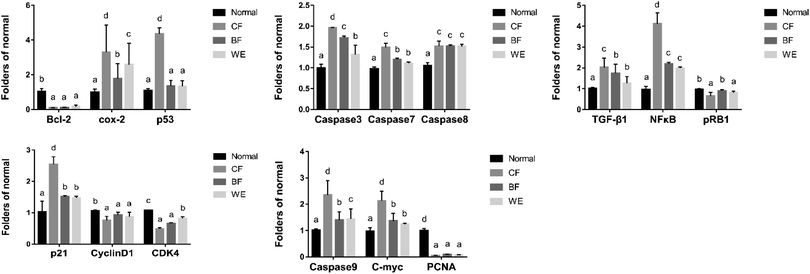
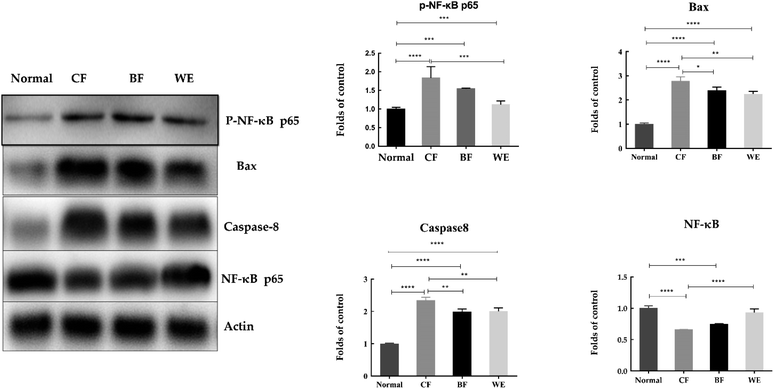
As shown in Fig. 9. Compared with the HepG2 cells in the control group, the mRNA expression levels of Bcl-2, cox-2, PCNA, CD1, C-meyc, CDK4, NF-κB and pRb1 in the CF group were significantly lower (P < 0.05). The expression levels of Caspase-3, Caspase-7, Caspase-8, Caspase-9, p53, TGF-β, and p21 were higher than those in the normal group. The WE and BF groups also showed downregulated mRNA expression levels of Bcl-2, cox-2, PCNA, CD1, C-meyc, CDK4, NF-κB and pRb1 compared with the control group and upregulated mRNA expression levels of Caspase-3, Caspase-7, Caspase-8, Caspase-9, p53, TGF-β and p21. Fig. 10 shows the levels of phospho-p65, Bax, Caspase-8, and NF-κB (p65) proteins determined via western blot analysis. Compared with those of the normal group, the phospho-p65, Bax and Caspase-8 protein levels in the CF treatment group were significantly increased, and the NF-κB (p65) protein levels were decreased. The BF and WE treatment groups yielded the same results, with significantly increased protein levels of phosphor-p65, Bax and Caspase8 and decreased protein expression levels of the inflammatory factor NF-κB (p65).3.9 HPLC analysis
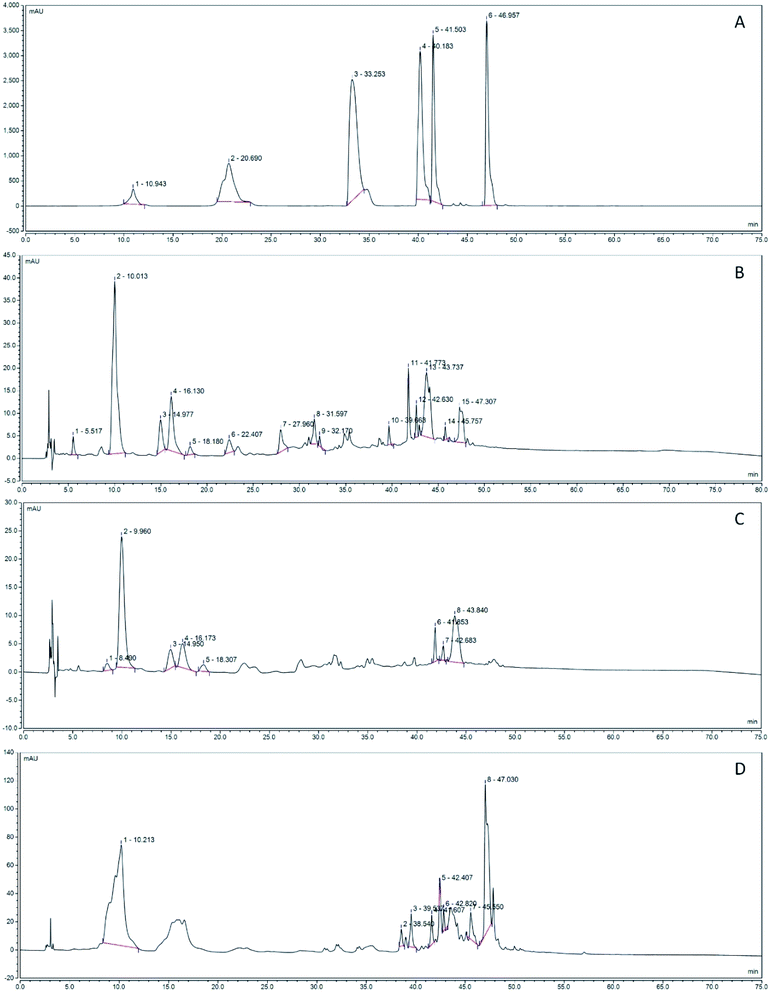
Fig. 11 shows the polyphenol component isolated by HPLC counting in the grape fermentation solution. As shown in Fig. 11B, the content of epicatechin gallate, resveratrol and chlorogenic acid in CF was the highest, reaching 24.62, 15.15, 18.14 mA V min, and the reed extracted from ethanol. The highest content of rutin is 37.73 mA V min (Fig. 11D). From the separation results, the total peak area of the fermentation solution fermented by LF-CQPC04 was lower than the total peak area of the grape skin extract obtained from ethanol, the effective peak of the separation of the CF fermentation solution was 74, and the effective peak of the ethanol extract was 83. The active ingredient was less than ethanol extraction, and the fermentation results of BF accumulated only 59 effective peaks (Fig. 11C). The fermentation solutions included ECG, coumarin, neochlorogenic acid, rutin, resveratrol, chlorogenic acid and rosmarinic acid (Fig. 11A) by standard reference comparison.4. Discussion
Polyphenols are complex phenolic secondary metabolites in plants and are natural antioxidants that protect against chronic inflammation, cardiovascular disease, cancer and diabetes.23 Grapes contain a high polyphenol content, and the phenolic substances are mainly derived from grape stems, peels and fruit granules.24 Terao, J. et al. research shown that the protective effect of epicatechin, epicatechin gallate, and quercetin on lipid peroxidation in phospholipid bilayers.25 Chlorogenic acid has a wide range of biological activities. Modern scientific research on the biological activity of chlorogenic acid has penetrated into many fields such as food, health care, medicine and daily chemical industry. Chlorogenic acid is an important biologically active substance, which has antibacterial, antiviral, antitumor, blood pressure, lipid lowering, free radical scavenging, and central nervous system stimulation functions. Flavonoids are a class of natural products that are widely found in the plant kingdom. They have anti-oxidant and anti-free radical effects and can be used in the treatment of cardiovascular and cerebrovascular diseases, tumors, inflammation, etc.26 Resveratrol is a polyphenolic compound mainly derived from peanuts, grapes (red wine), Polygonum cuspidatum, mulberry and other plants. Resveratrol is a highly biological natural polyphenolic substance that is a chemopreventive agent for tumors and a chemopreventive agent for reducing platelet aggregation, preventing and treating atherosclerosis and cardiovascular and cerebrovascular diseases.27–29 Most phenolic substances exist in a bound state and in a polymerized form, and their contents differ. Lactobacillus fermentum is a lactic acid-producing bacterium. Previous studies have shown that lactic acid-producing bacteria can exert antitumor activity through their immunomodulatory effects, such as reducing carcinogen formation from intestinal spoilage bacteria and competing for receptors of DNA-damaging agents to reduce cell aberrations.30 CQPC04 is a Lactobacillus fermentum strain isolated from kimchi (Sichuan, China). Previous studies have confirmed that this strain has a survival rate of 84.14% in artificial gastric juice at pH 3.0 and a growth rate of 0.3% in bile salts; at 66.38%, the experimental strain remains active when it reaches the intestines. Therefore, we used Lactobacillus CQPC04 to ferment grape skin. Separating the fermentation solution components via HPLC showed that the polyphenol structure and contents changed greatly during the fermentation process, as did the antioxidant activity in vitro.Oxidative stress is a source of many diseases.31 It can damage various macromolecules (e.g., sugars, proteins, lipids, and DNA) in cells, participate in apoptosis and inflammation, and stimulate a series of signaling pathways which can alter cell's function and cause pathological changes into various diseases. Human renal epithelial 293T cells grow fast and have high protein expression. We used 293T cells to explore the antioxidative protective effect of the grape skin fermentation solution. We used H2O2 as an oxidant to induce oxidative damage in 293T cells, which is the most commonly used model for inducing oxidative damage in cells. We found that the degree of H2O2-induced oxidative damage increased as the concentration increased, the oxidation-damaged cells shrank, and the cell proliferation rate was significantly decreased. However, within a certain concentration range (100–400 μmol L−1) after CF, BF or WE protection, the cell morphology was normal, and the low CF concentration extract promoted cell growth.
In addition, the GSH, GSH-Px, CAT, SOD, and T-AOC levels in the cells were significantly decreased after inducing oxidative damage, while the MDA, LDH, and NO levels were significantly increased. Changes in intracellular peroxide activities can alter cell function and gene expression and can even lead to apoptosis and necrosis. GSH, GSH-Px, CAT, SOD, and T-AOC are oxidized. GSH is a strong reducing agent that reduces part of the thiol form, thereby preventing damage from thiol-containing proteins and enzymes from peroxides.32 The superoxide anion reacts33 with hydrogen ions under the action of SOD to form hydrogen peroxide, which in turn reacts with hydrogen ions under the action of CAT and GSH-Px to finally form harmless substances such as water and oxygen. LDH is a glycolytic enzyme widely distributed in the liver and kidneys.34 Increased LDH content indicates inflammation. MDA is one of the end-products of membrane lipid peroxide, which can be used as an index of oxidative stress degree in cells study. NO can directly oxidize endogenous antioxidants, destroy nonenzymatic antioxidant defense systems, and inhibit the activity of antioxidant enzymes, such as CAT and GSH-Px, leading to increased intracellular peroxide content and causing oxidative damage to cells. A part of the peroxide is generated in normal cell life activities, which needs to be digested and removed by GSH, so the balance level of GSH and GSSG will be maintained. Usually, GSH/GSSG will have a constant ratio, but if the cell function changes abnormally, it will occur. Oxidative stress. At this time, the amount of peroxide increases and the total GSH decreases. At the same time, the balance between GSH and GSSG is broken, so the ratio of GSH/GSSG changes (usually, the ratio of GSSG increases and the ratio decreases). In our research, we found that after CF, BF or WE protective treatments, the GSH, GSH-Px, CAT, SOD, and T-AOC level were significantly increased, decreased the level of MDA, LDH and NO compared with oxidative damage model group caused by H2O2, and the CF treatment group was more effective than were the BF or WE treatment groups. Our results also found that the ratio of GSH/GSSG was down-regulated in the oxidatively damaged group, and the ratio was up-regulated after CF treatment. Therefore Lactobacillus CQPC04 fermented the grape skin, and the fermentation solution had an antioxidative protective effect on the cells.
In addition to the cell biochemical levels, the SOD, CAT, GSH and GSH-Px mRNA levels in the oxidative model group were decreased at the gene and protein levels, and CF, BF and WE increased these genes levels. Compared with those of the WE and BF groups, the CF-induced gene expression levels were significantly upregulated. The model group had the lowest protein expression level, which was upregulated after CF treatment compared with that of the WE and BF treatment groups and was similar to previous results. This indicates that CF treatment can protect cells from antioxidative damage.
The cell cycle state can determine the fate of a cell, and cells in different cell cycle states have different molecular characteristics and functions.35 Malignant tumors, also known as cell cycle diseases, are a characteristic of tumor growth and metastasis in abnormal cell cycles. Cyclin-dependent kinase plays a crucial role in regulating the cell cycle.36 The p53 gene is closely related to occurrence, development and clinical treatment of tumors.37 p53 is involved in cell cycle regulation, DNA repair, cell differentiation, apoptosis, and other anticancer biological functions and is upregulated by the expression of p21 and other genes. p21 gene expression plays an important role in G1/S phase arrest caused by DNA damage.38 The expression product of the p21 gene is the cell cycle inhibitor protein with the most extensive kinase inhibitory activity. p21 can inhibit cyclin D1-CDK4 activity, so that the qRb1 protein cannot be phosphorylated and the cell cycle arrests in G1 phase. DNA replication is thus inhibited, and p21 can reduce PCNA expression and arrest cells in S phase. CDK4 is a member of the kinase family and a key regulator of cell transformation from the G1 to S phase; its content and activity level are closely related to the G1/S phase transformation rate of the cell cycle. Elevated CDK4 expression promotes cell cycle progression and enhances cell proliferation, leading to tumorigenesis. After 48 hours of treating HepG2 cells with CF, the apoptotic and periodic changes were measured via flow cytometry. Cells in the CF treatment group showed increased apoptosis and significantly increased numbers of late apoptotic cells compared with those of normal HepG2 cells. The effect of the CF treatment group was significantly higher than that of the BF and WE treatment groups. The cycle change results also showed that most cells in the CF treatment group were arrested in the S phase and could not be transformed into the G2 phase, and the BF and WE groups were in a state of S-phase retention. Thus, the grape skin fermentation solution significantly affected the cell cycle, resulting in irreparable damage to the cellular DNA so that the cells could not continue to divide in the S phase, thus promoting apoptosis.
TGF-β regulates cell proliferation and differentiation, participates in regulating embryonic development, promotes extracellular matrix formation and inhibits immunity.39 TGF-β plays an important regulatory role in the cell's normal self-renewal by maintaining a balance between activators and inhibitors in the microenvironment, and stops cells in the G1 phase or prolongs the G1 phase. The Smad7 gene is an inhibitory factor that inhibits the TGF-β signaling pathway, and the inactivation of any component in this pathway induces canceration in cells. Inactivating any component in this pathway induces carcinogenesis. NF-κB is a widespread nuclear transcription factor that regulates cell functions. NF-κB is a mobile gene that controls apoptosis, the cell cycle, cell differentiation and cell transfer, thereby regulating tumorigenesis and development.40 Phosphorylation of P65 can activate the enzyme and activate the NF-κB signaling pathway, after the cell is stimulated, p65 can be phosphorylated with the transmission of the signal, and phosphorylated p65 is more likely to bind to CBP/p300, thereby promoting gene expression. c-myc is a malignant transformational cancer. c-myc is an oncogene with malignant transformation. The expression of c-myc gene can be expressed after the cells are stimulated by external stimuli. Its overexpression can induce apoptosis.41 qRb is a tumor suppressor gene that regulates the cell cycle, programmed cell death, and autophagy.42 The TGF-β/Smads signaling pathway is closely related to tumor occurrence and development.43 Under normal conditions, TGF-β can control c-myc gene expression and RB phosphorylation, induce apoptosis, and upregulate TGF-β-mediated Smad7 expression, thus activating antiapoptotic factor NF-κB signaling pathway components The change makes cells tolerant to TGF-β, c-myc overexpression, and RB inhibition, thereby infinitely increasing the cells, leading to tumorigenesis. In our study, compared with the liver cancer group, TGF-β mRNA expression in the CF-treated group increased, the mRNA expressions of c-myc, NF-κB, and pRb1 decreased, and the mRNA expression in the WE group appeared differentially expressed. CF can promote cell apoptosis by inhibiting the TGF-β/Smads pathway and affecting the cell cycle.
Bax is one of the most proapoptotic proteins in the human body and belongs to the bcl-2 family.44 Bax can induce the release of Cyt-c, activate caspase, and cause bubble formation, nuclear fragmentation and apoptosis. Caspase-8 and -9 are involved in the initial stage of apoptosis, while Caspase-3 and -7 are involved in apoptosis, leading to inhibition of DNA repair and degradation.45 When the cells are subjected to external persecution, it will cause irreversible DNA damage. By stimulating the death receptor pathway, the death receptor is activated by binding to the corresponding ligand. After the downstream series of signal cascades, the initial Caspase-8 is activated step by step. The death protein Bax activates, acts on IκB, dissociates the expression of NF-κB, and inhibits the normal transcription of DNA.46–48 Protein studies also showed that compared with a liver cancer control group, phospho-NF-κB, Caspase-8 and Bax protein expressions were increased in the CF and WE treatment groups, while that of NF-κB was decreased.
Studies have shown that probiotics and their polyphenolic compound metabolites can have antioxidant effects. Lactobacillus fermentum CQPC04 can ferment grape skin extract, and ultrasonically disrupting grape skin extract played an antioxidant role in human renal epithelial 293T cells and had a proapoptotic effect on HepG2 cells. The results of this study also showed that the antioxidative protective effect and apoptosis-promoting effect of the CF-treated group were better than those of the WE group, especially for the cell cycle. The same two extracts had different chemical components. The influence of the differences between the internal organelles should be explored, and we will conduct further research on this in the future.
5. Conclusion
In this study, we used Lactobacillus fermentum CQPC04 to ferment grape skins and analyze the potential bioactive substances in these extracts. The results showed that the fermentation solution fermented by Lactobacillus fermentum CQPC04 alleviated the H2O2-induced oxidative damage by stimulating the SOD, T-AOC, CAT, GSH, GSH-Px indices and the ratio of GSH/GSSG in the cells and inhibiting the LDH, MAD and NO indices. The mRNA and protein levels also showed upregulated SOD, CAT, GSH, and GSH-Px expressions. The fermentation solution also reduced the Bcl-2, cox-2, PCNA, CD1, C-myc, CDK4, NF-κB and pRb1 expressions at the mRNA level and upregulated the Caspase-3, Caspase-7, Caspase-8, Caspase-9, p53, TGF-β1 and p21 expression levels in liver cancer. Phospho-p65, Bax and Caspase-8 protein expression increased, while NF-κB (p65) protein expression decreased to promote apoptosis of liver cancer cells. Our results indicate that grape skin fermentation broth is bioavailable in vitro and may prevent oxidation and cancer cell proliferation.Author contributions
J. L. performed the majority of the experiments and wrote the manuscript; X.-H. L. and R.-K. Y. contributed to the data analysis; F. T. and X. Z. designed and supervised the study, and checked the final manuscript.Funding
This research was funded by Research Project of Chongqing University of Education [KY2015TBZC] and the Program for Innovation Team Building at Institutions of Higher Education in Chongqing (CXTDX201601040), China.Conflicts of interest
The authors declare that the research was conducted in the absence of any commercial or financial relationships that could be construed as a potential conflict of interest.Acknowledgements
This is a short text to acknowledge the contributions of specific colleagues, institutions, or agencies that aided the efforts of the authors.References
- M. Inoue, E. F. Sato, A. M. Park, M. Nishikawa, E. Kasahara and M. Miyoshi, Free Radical Res., 2000, 33, 757–770 CrossRef CAS PubMed.
- J. Jaswal and J. Ussher, Clin. Lipidol., 2009, 4, 379–389 CrossRef CAS.
- T. Ide, H. Tsutsui, S. Hayashidani, D. Kang, N. Suematsu and K. Nakamura, Circ. Res., 2001, 10, 529–535 CrossRef.
- S. I. Liochev and I. Stefan, Free Radical Biol. Med., 2013, 60, 1–4 CrossRef CAS.
- K. J. Davies and J. A. Kelvin, IUBMB Life, 2010, 50, 279–289 CrossRef PubMed.
- P. Domenico, Trends Pharmacol. Sci., 2008, 12, 609–615 Search PubMed.
- D. Vera, E. Junn and M. M. Mouradian, J. Parkinson's Dis., 2013, 4, 461–491 Search PubMed.
- N. R. Madamanchi, S. K. Moon, Z. S. Hakim, S. Clark, A. Mehrizi, C. Patterson and M. S. Runge, Arterioscler., Thromb., Vasc. Biol., 2005, 25, 950–956 CrossRef CAS.
- X. S. Fang, P. Zhou and Y. H. Wang, Chongqing Med., 2009, 12, 79–81 Search PubMed.
- W. Phrueksanan, S. Yibchok-Anun and S. Adisakwattana, Res. Vet. Sci., 2014, 97, 357–363 CrossRef PubMed.
- A. Ataie, M. Sabetkasaei, A. Haghparast, A. H. Moghaddam and B. Kazeminejad, Pharmacol., Biochem. Behav., 2010, 96, 378–385 CrossRef CAS PubMed.
- C. Bréchot, D. Gozuacik, Y. Murakami and B. P. Paterlini, Semin. Cancer Biol., 2000, 10, 211–231 CrossRef.
- S. M. Rafael, H. Marín Alvaro, E. Saavedra and I. P. Pardo, Int. J. Biochem. Cell Biol., 2014, 50, 10–23 CrossRef.
- D. Mélody, J. M. Warnet, C. Baudouin and P. Rat, Eur. J. Pharm. Sci., 2008, 33, 138–145 CrossRef.
- B. Romier, J. V. D. Walle, A. During, Y. Larondelle and Y. J. Schneider, Toxicol. Lett., 2007, 172, S92 CrossRef.
- R. D. Duan, Food Chem., 2010, 120, 1004–1010 CrossRef.
- R. L. Thangapazham, A. K. Singh, A. Sharma, J. Warren, J. P. Gaddipati and R. K. Maheshwari, Cancer Lett., 2007, 245, 232–241 CrossRef CAS PubMed.
- C. J. Weng, C. F. Wu, H. W. Huang, C. H. Wu, C. T. Ho and G. C. Yen, J. Agric. Food Chem., 2010, 58, 2886–2894 CrossRef CAS PubMed.
- E. Garcíabeneytez, F. Cabello and E. Revilla, J. Agric. Food Chem., 2003, 51, 5622–5629 CrossRef PubMed.
- M. Zhu, I. Xia, Z. W. Zhang, Y. F. Cheng and L. I. Hua, Agric. Sci. China, 2010, 9, 448 Search PubMed.
- K. Thaipong, U. Boonprakob, K. Crosby, Z. L. Cisneros and D. H. Byrne, J. Food Compos. Anal., 2006, 19, 669–675 CrossRef CAS.
- B. Roberta, B. Maurizio, C. Valentina, C. Isabella, T. Daniela and C. Rosa, Molecules, 2018, 23, 208–221 CrossRef.
- Y. Yilmaz and R. T. Toledo, J. Agric. Food Chem., 2004, 52, 255–260 CrossRef CAS PubMed.
- D. Kammerer, A. Claus, R. Carle and A. Schieber, J. Agric. Food Chem., 2004, 52, 4360–4367 CrossRef CAS PubMed.
- J. Terao, M. Piskula and Q. Yao, Arch. Biochem. Biophys., 1997, 308, 278–284 CrossRef PubMed.
- J. Yang, J. Guo and J. Yuan, LWT--Food Sci. Technol., 2008, 41, 1060–1066 CrossRef CAS.
- B. Aggarwal, Anticancer Res., 2004, 24 CAS.
- M. Javier and J. Juan, Biochem. Pharmacol., 2000, 59, 865–870 CrossRef.
- S. TSAI, Br. J. Pharmacol., 1999, 126, 673–680 CrossRef CAS PubMed.
- J. Zhang, R. K. Yi, Y. Qian and X. Zhao, J. Food Sci., 2018, 83, 2653–2661 CrossRef CAS PubMed.
- B. H. Liu, J. Zhang, R. K. Yi, X. R. Zhou, X. Y. Long and X. Zhao, Foods, 2018, 8, 93–107 CrossRef PubMed.
- R. Mittler, Trends Plant Sci., 2002, 7, 405–410 CrossRef CAS PubMed.
- J. P. E. Spencer, P. Jenner, S. E. Daniel, A. J. Lees, D. C. Marsden and B. Halliwell, J. Neurochem., 2010, 71, 2112–2122 CrossRef PubMed.
- K. M. Ten, D. W. J. B. S. Van, W. Sluiter, L. J. Hofland, J. Jeekel and P. Sonneveld, Br. J. Cancer, 2006, 95, 1497–1503 CrossRef PubMed.
- V. Rives and M. A. Ulibarri, Cheminform, 2010, 181, 61–120 Search PubMed.
- G. I. Evan, Nature, 2001, 411, 342–348 CrossRef CAS PubMed.
- R. S. Moussa, K. C. Park, Z. Kovacevic and D. R. Richardson, Free Radicals Biol. Med., 2018, 133, 276–294 CrossRef PubMed.
- A. J. Levine, Cell, 1997, 88, 323–331 CrossRef CAS PubMed.
- C. S. Chung, Mol. Carcinog., 2015, 28, 102–110 Search PubMed.
- L. Chen, T. Yang, D. W. Lu, H. Zhao, Y. L. Feng and H. Chen, Biomed. Pharmacother., 2018, 101, 670–681 CrossRef CAS.
- K. Taniguchi and M. Karin, Nat. Rev. Immunol., 2018, 18, 309–324 CrossRef CAS.
- N. Murai, Y. Murakami, A. Tajima and S. Matsufuji, Sci. Rep., 2018, 8, 3005–3016 CrossRef PubMed.
- J. Kato, H. Matsushime and S. W. Hiebert, Genes Dev., 1993, 7, 331–342 CrossRef CAS.
- Q. Ji, X. Liu, Z. Han, L. Zhou, H. Sui and L. Yan, BMC Cancer, 2015, 15, 97–108 CrossRef PubMed.
- Z. Zhang, Z. Liang, H. Li, C. Li, Z. Yang and Y. Li, PLoS One, 2017, 12, e0173884 CrossRef PubMed.
- Q. L. Deveraux, N. Roy, H. R. Stennicke, T. V. Arsdale, Q. Zhou and S. M. Srinivasula, EMBO J., 2014, 17, 2215–2223 CrossRef PubMed.
- A. Tubbs and A. Nussenzweig, Cell, 2017, 168, 644–656 CrossRef CAS PubMed.
- B. Stefano, N. Fabio, R. Dante, B. Enrica and L. Amedeo, Adv. Ther., 2016, 33, 291–319 CrossRef PubMed.
| This journal is © The Royal Society of Chemistry 2020 |


