 Open Access Article
Robust and recyclable sodium carboxymethyl cellulose–ammonium phosphomolybdate composites for cesium removal from wastewater†
Ningluo Zhang,
Shangqing Chen,
Jiayin Hu *,
Jian Shi,
Yafei Guo and
Tianlong Deng
 *
*
Tianjin Key Laboratory of Marine Resources and Chemistry, College of Chemical Engineering and Materials Science, Tianjin University of Science and Technology, Tianjin, 300457, China. E-mail: hujiayin@tust.edu.cn; tldeng@tust.edu.cn
First published on 7th February 2020
Abstract
A novel, facilely prepared, recyclable sodium carboxymethyl cellulose–ammonium phosphomolybdate composite (CMC–AMP) was synthesized by chemical cross-linking and used for Cs+ removal. The effects of adsorbent dosage, pH value, initial Cs+ concentration, contact time, temperature and competitive ions on adsorption were investigated. The results showed that CMC–AMP with good mechanical properties could effectively adsorb Cs+ in a wide pH range. In addition, the adsorption process of CMC–AMP was better fitted with the Lagergren first-second model and Langmuir isotherm model. Furthermore, CMC–AMP can be reused five times using ammonium chloride as the eluent without an obvious decrease in absorption activity. The results reveal that CMC–AMP can be used as a low cost and recyclable Cs+ adsorbent.
Introduction
Radioactive cesium (137Cs) with a long half-life of 30.1 years and serious gamma radiation is generally caused by nuclear power generation, nuclear wastewater and nuclear accidents, and is an easily diffused pollutant that can accumulate in wildlife and humans, resulting in increasing morbidity of cancer and genetic disordered.1,2 In particular, after the Fukushima nuclear accident, there was a certain degree of diffusion of 137Cs into the soil and seawater nearby, resulting in a severe impact on the surrounding environment.3 Therefore, it is urgent to develop techniques for removing 137Cs from nuclear wastewater.At present, there are many developed methods for cesium removal. In view of the characteristics of nuclear wastewater and the concentration of cesium in solution, the adsorption method is more suitable because of its low cost and easy operation.4 Currently, many adsorbents for cesium removal have been explored, such as Prussian blue (PB),3,5–7 montmorillonite,8,9 modified carbon nanotubes,10,11 zeolites and ammonium phosphomolybdate (AMP).12–14 Among the previously developed inorganic ion adsorbents, ammonium phosphomolybdate (AMP) is widely used as an ion exchanger because of its excellent selectivity towards cesium ions.15 More importantly, AMP can be eluted with ammonium salt after adsorbing Cs+,16 which is beneficial for multiple recycling of the adsorbents. However, due to its microcrystalline structure and fine powder morphology, it is not suitable for direct adsorption.17 Therefore, many researchers are working on developing supporter materials for immobilizing AMP powders, such as aluminum,18 polyacrylonitrile,19 mesoporous silica.20 Although gratifying progress have been made, there are still some problems in the preparation of these immobilizing materials, such as inferior stability, cumbersome preparation processes and so on. Therefore, the development of robust AMP-based adsorbents with favorable adsorption performance and facile preparation process is still desirable.
Sodium carboxymethyl cellulose (CMC) is a water-soluble cellulose extracted from raw cellulose materials by alkalization or acidification which has been widely used in chemical, light industry, petroleum, food, medicine, and many other fields.21,22 CMC can form insoluble gel spheres in the presence of multivalent metal ions such as Fe3+, Cu2+ and Al3+.23–25 Recently, Zong et al. synthesized CMC–KCuFC composite microspheres with Cu2+ as a crosslinking agent, and the particles were able to maintain high stability after separation.26 However, the secondary pollution caused by the release of trace Prussian blue would lead to serious threat to the water body.27 In addition, because of the excessive affinity of PB towards Cs+, the Cs+-laden PB-based adsorbents were difficult to be regenerated and reused, which were not benign in view of economical benefit.
In this study, a robust and recyclable CMC–AMP composite was prepared by immobilizing ammonium phosphomolybdate (AMP) onto sodium carboxymethyl cellulose (CMC) for cesium removal from wastewater. The robust CMC–AMP composite could adsorb Cs+ at a wide pH range with a maximum adsorption capacity of 65.42 mg g−1. More importantly, CMC–AMP can be facilely reused and recycled using ammonium chloride as eluent for five times without significant loss in absorption activity and selectivity. Thus, CMC–AMP could be regarded as a potential material for 137Cs removal from wastewater.
Experiment
Materials
All reagents used in the experiments were of analytical grade without further purification. Sodium carboxymethyl cellulose (CMC) was purchased from Tokyo Chemical Industry Co., Ltd. Cesium chloride was obtained from Tianjin Jinke Fine Chemical Research Institute. Ammonium phosphomolybdate (AMP), potassium chloride, sodium hydroxide, ammonium chloride, ferric chloride and hydrochloric acid were supplied by Sinopharm Reagent Co. Ltd.For safety reasons, CsCl, a non-radioactive Cs (133Cs), was used in this experiment. 0.1267 g of cesium chloride was dissolved in 1000 mL of deionized water to prepare a 100 mg L−1 Cs+ solution. The original solution was diluted into different concentration gradients of cesium chloride solution. The pH values of the solutions were adjusted using 0.1 mol L−1 NaOH and 0.1 mol L−1 HCl and they were measured by a high precision pH meter (PH-7310, WTW Co., Ltd, Germany).
Preparation of CMC–AMP microspheres
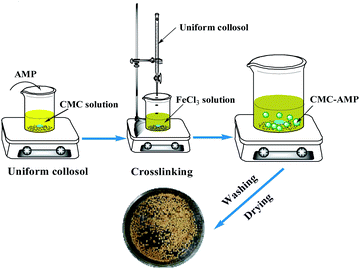
CMC–AMP microspheres were prepared as shown in Fig. 1. First, 1.5 g of AMP powder was weighed and added into 100 mL of deionized water, and 1.5 g of CMC was added to form a uniform yellow sol through mechanical stirring. Then, the mixed sol was gradually dropped into a 2 wt% FeCl3 clear solution using a syringe, and yellow microspheres were formed under stirring. The stirring was continued for 12 hours for sufficient crosslinking. Thereafter, the microspheres were washed with deionized water for several times. Finally, the microspheres were dried at 45 °C for 12 hours for further use.Characterization
FT-IR spectra were analyzed at a range of 4000–400 cm−1, and the cumulative scan was performed 16 times (Tensor27, Germany). Surface SEM image analysis was performed on the samples before and after desorption of CMC–AMP microspheres to determine the changes in the morphology of the samples (SEM, JSM-IT300LV, Japan). The elemental composition of the sample was measured by an energy dispersive X-ray spectrometer (EDX, X-Max20, Oxford Instruments).Adsorption tests
Batch adsorption tests were conducted in conical flasks containing 100 mL Cs+ solution and a certain mass of adsorbent. All adsorption tests were oscillated on an adjustable temperature water bath shaker at a constant speed of 200 rpm. At a specific time, 2 mL of the solution sample was taken from the flasks and the concentration of Cs+ was detected by inductively coupled plasma optical emission spectrometer (ICP-OES, Prodigy, Leeman Corporation, America).The equilibrium adsorption rate (E) and adsorption capacity (qe) of Cs+ are calculated using eqn (1) and (2), respectively:
 | (1) |
 | (2) |
In order to estimate the affinity and selectivity of the adsorbent for Cs+, the distribution coefficient (Kd) was used, and its formula can be expressed as follows:
 | (3) |
Desorption and reusability
In this study, adsorption–desorption cycles of CMC–AMP was performed to test the reusability of the adsorbent. The adsorption experiment was carried out by using 100 mL of 50 mg L−1 Cs+ solution and a certain amount of adsorbent for 12 h. Then the Cs-containing CMC–AMP was eluted using ammonium chloride. After this, the adsorbent was washed several times with deionized water for the next adsorption–desorption experiment.Results and discussion
Characterization
The FT-IR spectrum of CMC–AMP microspheres is shown in Fig. 2A. It can be found that the broad and strong absorption peaks at 3430–3435 cm−1 corresponded to the stretching vibration peak of O–H. The weak absorption peak located near 2921 to 2922 cm−1 was the stretching vibration peak of the C–H skeleton (mainly including –CH and –CH2) on the CMC.28 The four sharp and strong absorption peaks at 1064.5 cm−1, 964.7 cm−1, 866.7 cm−1, 788.2 cm−1 were characteristic peaks of [PMo12O40]3− skeleton of Keggin structure of ammonium phosphomolybdate,16 This indicated that the AMP was successfully loaded on the CMC substrate. The surface features of the CMC–AMP microspheres were explored using SEM (Fig. 2B). As can be seen from the image, the surface of the CMC–AMP microsphere was wrinkled, which was favorable for adsorption. In addition, energy dispersive X-ray spectroscopy (EDX) was used to analyze the elemental composition of the microspheres. The result is shown in Fig. 2C indicated that the elements of dispersion in CMC–AMP microspheres are C, N, O, P, Mo and Fe, which further verified the successful immobilization of AMP in CMC matrix.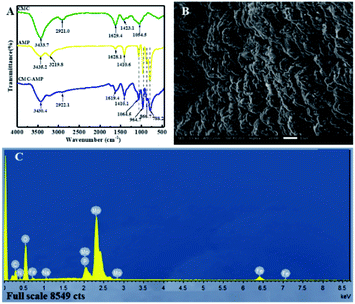 | ||
| Fig. 2 Characterizations of synthesized CMC–AMP: the FT-IR spectrum (A), representative SEM image (B) and EDX spectrum (C). | ||
Effect of CMC–AMP dosage on Cs+ adsorption
In the adsorption process, it is important to determine the optimum amount of adsorbent. Then, the effect of CMC–AMP dosage on Cs+ adsorption were investigated, and the result are shown in Fig. 3. It could be seen that the adsorption efficiency (E) increased with the increasing of CMC–AMP dosage. Meanwhile, the adsorption capacity (qe) decreased with the increasing of CMC–AMP dosage, which may be caused by the slower adsorption rate and limited adsorption time. Considering the E and qe, the solid–liquid ratio of the subsequent adsorption experiments was set as 1 g L−1.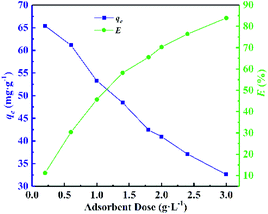 | ||
| Fig. 3 Effect of adsorbent dosage on Cs+ adsorption by CMC–AMP. Adsorption conditions: 100 mg L−1 Cs+ concentration, 24 h and 298.15 K. | ||
Effect of solution pH on adsorption
Considering that the pH of the solution has an important effect on adsorption. Therefore, the adsorption experiments with pH value ranging from 2 to 10 were carried out in this experiment, and the results are shown in Fig. 4. CMC–AMP exhibited good stability in the range of pH 2–10. When the pH was lower than 3, the amount of adsorption was obviously low. When pH was larger than 4, the adsorption slightly increased with increasing pH and then decreased after pH exceeded 8. At low pH, the charge of the CMC–AMP surface was positive, and H+ and Cs+ were highly competitive for the occupancy of the active sites. Whereas at higher pH values, the charge on the surface of CMC–AMP will become negative, resulting in more active adsorption for Cs+. The decrease in the adsorption capacity after pH 8 attributed to the stronger ion strength.11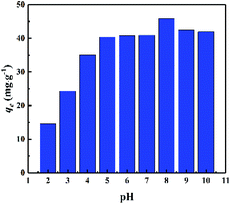 | ||
| Fig. 4 Effect of pH value on adsorption of Cs+. Adsorption conditions: 100 mg L−1 Cs+ concentration, adsorbent dose 1 g L−1, 24 h and 298.15 K. | ||
Effects of initial concentration of Cs+ on adsorption and adsorption isotherm
The effects of different initial Cs+ concentrations on adsorption capacity at different temperatures were investigated and the results are shown in Fig. 5A. It could be found that the adsorption capacity of Cs+ increased with the initial concentration. The reason was that at a lower initial Cs+ concentration, the amount of Cs+ was insufficient, and many adsorption sites remained unsaturated, so the adsorption capacity was low. When the initial Cs+ concentration increased, the adsorption sites became saturated gradually and the adsorption capacity obviously increased. In addition, at different initial Cs+ concentrations, the temperature had a positive effect on the adsorption capacity of CMC–AMP, and the maximum adsorption capacity of Cs+ at 323.15 K in 24 h was 64.20 mg g−1. | ||
| Fig. 5 Effect of initial Cs+ concentration on adsorption (A) and adsorption isotherm model: Langmuir model (B); Freundlich model (C). Adsorption conditions: adsorbent dose 1 g L−1, pH = 7 and 24 h. | ||
In the adsorption process, the equilibrium isotherm is important for providing the information about adsorption mechanism. In this study, the experimental data were processed using the Langmuir and Freundlich models to describe the adsorption of Cs+ by CMC–AMP in equilibrium state. The linear expressions of the Langmuir and Freundlich models are as follows:29,30
Langmuir adsorption isotherm equation
 | (4) |
Freundlich adsorption isotherm equation
| qe = KFCe1/n | (5) |
 | (6) |
The Langmuir and Freundlich constants are obtained from the slope and intercept calculated in Fig. 5 and the calculated data is shown in Table S5.† As shown in Table S5,† the adsorption is more likely to follow the Langmuir model (R2 > 0.9522), and the calculated maximum adsorption capacity is 72.89 mg g−1 at 323.15 K. The above results indicate that the adsorption process is a monolayer adsorption, that is, adsorption mainly occurs on the surface of the adsorbent. For the Freundlich model, the value of n is 3.286, indicating the favorable adsorption process.
Effects of contact time on adsorption and adsorption kinetics
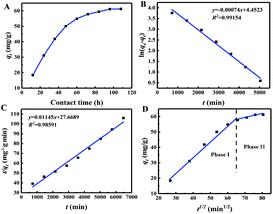
The effect of contact time on adsorption of Cs+ is shown in Fig. 6A. In general, the adsorption capacity of Cs+ by CMC–AMP increased with increasing adsorption time, and the adsorption capacity reached 61.21 mg g−1 when the equilibrium state was reached. During the first 60 hours, the adsorption of Cs+ increased markedly. Then the adsorption rate decreases slightly and finally reached equilibrium. At early stages, there are many available adsorption sites, resulting in a fast adsorption rate. As time increased, the free adsorption sites and the Cs+ concentration decreased and the adsorption rate became slower.To further investigate the properties of kinetic adsorption and mechanism, the most widely used kinetic model Lagergren pseudo-first-order and pseudo-second-order was used to evaluate the experimental data.
Lagergren pseudo-first-order kinetic model31
ln(qe − qt) = ln![[thin space (1/6-em)]](https://www.rsc.org/images/entities/char_2009.gif) qe − k1t qe − k1t
| (7) |
Lagergren pseudo-second-order kinetic model32
 | (8) |
Intra-particle diffusion model33
| qt = kdift1/2 + C | (9) |
The calculation shows that the correlation coefficient of the pseudo first-order model is higher than that of the pseudo second-order model. Furthermore, it was found that the qt of CMC–AMP is multi-linear for the intra-particle diffusion model of t1/2 and can be divided into two phases (Fig. 6D). Stage I refers to diffusion from the bulk solution to the surface of the adsorbent. Stage II represents the diffusion of ions within the microporous crystals of CMC–AMP. For the intra-particle rate constant, kdif1 is much higher than kdif2, and surface diffusion is an instantaneous diffusion phase.34 Due to the larger correlation coefficient, the adsorption process is more in line with pseudo first-order model, indicating that the main adsorption mechanism of Cs+ on CMC–AMP is chemisorption.
Effects of temperature on adsorption and adsorption thermodynamics
During the adsorption process, temperature has an important effect on the adsorption effect by affects the diffusion rate of ions in the solution. Thus, the adsorption of Cs+ at a solution temperature of 293.15 K to 323.15 K were carried out. As shown in Fig. 7A, at the different initial concentration, when the temperature increased from 293.15 K to 323.15 K, the adsorption of Cs+ by CMC–AMP microspheres increased with the increasing temperature, indicating that the adsorption process was an endothermic reaction. However, in order to reduce energy consumption, the other experiments were carried out at room temperature.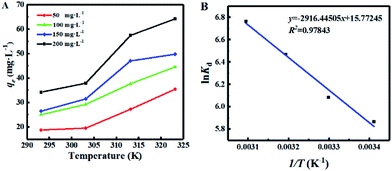 | ||
| Fig. 7 Effect of temperature on adsorption (A) and thermodynamic fitting (B). Adsorption conditions: adsorbent dose 1 g L−1, pH = 7 and 24 h. | ||
In order to further explore the thermodynamic properties of the adsorption process, enthalpy (ΔH0, kJ mol−1), entropy (ΔS0, J mol−1 K−1), and Gibbs free energy (ΔG0, kJ mol−1) were studied in this experiment. And they are calculated by the following equations:16
 | (10) |
| ΔG0 = ΔH0 − TΔS0 | (11) |
The values of ln![[thin space (1/6-em)]](https://www.rsc.org/images/entities/char_2009.gif) Kd were obtained at different temperatures. According to the results shown in Fig. 7B, the values of ΔH0 and ΔS0 are calculated as 24.25 kJ mol−1 and 131.13 J mol−1 K−1, respectively. The values of ΔG0 at different temperatures were calculated by eqn (11), and the thermodynamic parameters were shown in Table S1 (see ESI).†
Kd were obtained at different temperatures. According to the results shown in Fig. 7B, the values of ΔH0 and ΔS0 are calculated as 24.25 kJ mol−1 and 131.13 J mol−1 K−1, respectively. The values of ΔG0 at different temperatures were calculated by eqn (11), and the thermodynamic parameters were shown in Table S1 (see ESI).†
The value of ΔH0 was positive in the adsorption of Cs+ by CMC–AMP, indicating that the adsorption was an endothermic process, which was consistent with the experimental results of Fig. 7. In addition, all ΔG0 values were negative at temperatures from 293.15 to 323.15 K, so the adsorption process of Cs+ by CMC–AMP was thermodynamically feasible and spontaneous in nature.
Effects of competing ions on adsorption
In nuclear wastewater, the presence of alkali and alkaline earth metal ions (e.g. Li+, Na+, K+, Mg2+ and Ca2+) affects the absorption of Cs+. Among them, K+ has the greatest effect on the adsorption of Cs+ since there is a close radius between K+ and Cs+.35 Therefore, in this experiment, K+ was selected as the competitive ion of Cs+ to explore the adsorption selectivity of CMC–AMP. In the test of selective adsorption, the concentrations of K+ were ranged from 20 to 200 mg L−1 and the concentration of Cs+ was kept at 100 mg L−1. The result in Fig. 8 showed that as the concentration of K+ increased, the adsorption efficiency and distribution coefficient Kd of Cs+ decreased. However, the distribution coefficients of Cs+ were always above 4 × 10², indicating the good selectivity of CMC–AMP for Cs+. Moreover, the adsorption in ground water (Table S7†) further suggest the potential application of CMC–AMP in Cs+ adsorption in real water.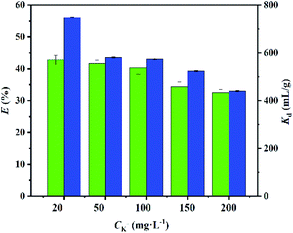 | ||
| Fig. 8 Effect of competing ions on Cs+ adsorption by CMC–AMP. Adsorption conditions: Cs+ concentration 100 mg L−1, adsorbent dose 1 g L−1, pH = 7, 24 h and 298.15 K. | ||
Desorption and reusability
After adsorption, the cesium-laden CMC–AMP (CMC–AMP-Cs) was eluted using NH4Cl as a desorption solution. Firstly, the effect of NH4Cl concentrations on the desorption performance was studied. It can be seen from Fig. 9A that as the concentration of NH4Cl solution increased, the desorption rate of Cs+ firstly increased and then decreased. When the concentration of NH4Cl solution was 1 mol L−1, the desorption rate of Cs+ was the highest, which was 93.27%. Therefore, 1 mol L−1 NH4Cl solution was selected as the eluent.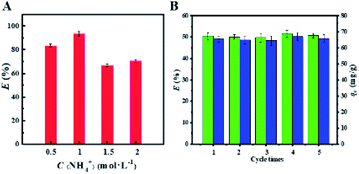 | ||
| Fig. 9 Effect of different concentrations of NH4Cl on the elution of cesium from CMC–AMP (A); regeneration performance of CMC–AMP for five consecutive times (B). | ||
After desorption, the adsorbent was washed for several times with deionized water for the next use. A total of 5 adsorption–desorption cycles were performed to test the reusability and stability of the adsorbent. Fig. 9B shows that there was almost no decrease in adsorption capacity over multiple cycles, and CMC–AMP remained stable during this process. This indicates that CMC–AMP composites have good reusability in cycle experiments, which helps to reduce the cost in application.
The CMC–AMP after five-times reused were characterized by FT-IR, SEM and EDX to further determine their stability. The FT-IR spectra in Fig. S1A† showed that there was no significant change in the CMC–AMP stretching vibration peak before (a) and after (b) desorption, indicating that the chemical structure of the adsorbent did not change obviously after the desorption experiment. The SEM image (Fig. S1B†) shows that the surface of CMC–AMP was slightly rougher than that before absorption. EDX analysis showed that the signal of element cesium was clearly observed on the surface of CMC–AMP-Cs (Fig. S1C and Table S6†), which further suggest the affinity of CMC–AMP toward Cs+.
Comparison of various adsorbents for Cs+
The adsorbents synthesized in this work were compared with the reported materials to evaluate the performance of CMC–AMP and the results are shown in Table 1. It was found that the CMC–AMP developed in this study had lower reaction temperature and mild reaction conditions than other reported AMP composites, indicating that the method was cost effective and easy to be popularized. In addition, the adsorption capacity of CMC–AMP was comparable and much larger than some AMP-based composites. In summary, CMC–AMP could be accepted as a promising adsorbent with potential application in cesium removal from wastewater.| Materials | Synthesis mechanism | Synthesis conditions | Adsorption capacity (mg g−1) | Ref. |
|---|---|---|---|---|
| Pure AMP | — | — | 87.7–135.6 | 36 |
| AMP/alumina | Gel entrapment | Heated to 95 °C | 10–12 | 18 |
| AMP/zirconium phosphate | Precipitation | Digested at 50 °C under stirring | 7.7 | 37 |
| AMP/silica | Cross-linked | Heated to 90 °C and sol–gel for 3 days | 37.63 ± 0.38 | 38 |
| SM-AMP20 | Sequential annealing | Heated to 90 °C and sequential cooling | 15.48 | 39 |
| AMP/silica gel | Coagulation | Heated to 90 °C and washed with trichloroethylene | 47.84 | 40 |
| CMC–AMP | Cross-linked | Room temperature | 65.4 | This work |
Conclusions
In this study, a robust and recyclable CMC–AMP composite adsorbent was prepared for Cs+ removal from aqueous solution. Under the optimal adsorption conditions, the maximum adsorption capacity of the CMC–AMP could reach 64.20 mg g−1. The composite could effectively adsorb Cs+ at a wide range of pH value and the adsorption process was found to be spontaneous and endothermic. The investigated adsorption processes fit pseudo first-order model and Langmuir isotherms respectively. In the presence of K+, the distribution coefficients of Cs+ were always relatively high, indicating that CMC–AMP was highly selective for Cs+. More importantly, CMC–AMP had high reusability and stability and could be efficiently eluted and recovered by ammonium chloride solution, and reused for five times without significant loss in adsorption properties. Therefore, the CMC–AMP composite are expected to be with potential applications in the treatment of Cs+ from nuclear wastewater.Conflicts of interest
There are no conflicts to declare.Acknowledgements
The authors gratefully acknowledge partial financial support from the National Natural Science Foundation of China (U1607123 and 21773170), the Open Foundation of Tianjin Key Laboratory of Marine Resources and Chemistry (201701), the Yangtze Scholars and Innovative Research Team of the Chinese University (IRT_17R81) and the Key Projects of Natural Science Foundation of Tianjin (18JCZDJC10040).Notes and references
- S. M. Park, J. Lee, E. K. Jeon, S. Kang, M. S. Alam, D. C. W. Tsang, D. S. Alessi and K. Baek, Geoderma, 2019, 340, 49–54 CrossRef.
- J. C. Leaphart, K. C. Wilms, A. L. Bryan and J. C. Beasley, J. Environ. Radioact., 2019, 203, 25–29 CrossRef PubMed.
- M. Kotomi, A. A. Mariko, M. Takeshi and K. Jun, J. Environ. Radioact., 2019, 208–209, 106040 Search PubMed.
- J. F. Zhang, L. R. Yang, T. T. Dong, F. Pan, H. F. Xing and H. Z. Liu, Ind. Eng. Chem. Res., 2018, 57, 4399–4406 CrossRef.
- A. Nilchi, B. Malek, M. G. Maragheh and A. Khanchi, J. Radioanal. Nucl. Chem., 2003, 258, 457–462 CrossRef.
- Y. C. Lai, Y. R. Chang, M. L. Chen, Y. K. Lo, J. Y. Lai and D. J. Lee, Bioresour. Technol., 2016, 214, 192–198 CrossRef PubMed.
- G. R. Chen, Y. R. Chang, X. Liu, T. Kawamoto, H. Tanaka, D. Parajuli, M. L. Chen, Y. K. Lo, Z. F. Lei and D. J. Lee, Sep. Purif. Technol., 2015, 153, 37–42 CrossRef.
- B. Ma, S. Oh, W. S. Shin and S. J. Choi, Desalination, 2011, 276, 336–346 CrossRef.
- H. A. Alamudy and K. Cho, Chem. Eng. J., 2018, 349, 595–602 CrossRef.
- R. Yavari, Y. D. Huang and S. J. Ahmadi, J. Radioanal. Nucl. Chem., 2011, 287, 393–401 CrossRef.
- I. M. Abdelmonem, E. Metwally, T. E. Siyam, F. A. El-Nour and A. R. M. Mousa, J. Radioanal. Nucl. Chem., 2019, 319, 1145–1157 CrossRef.
- W. Baek, S. Ha, S. Hong, S. Kim and Y. K. Kim, Microporous Mesoporous Mater., 2018, 264, 159–166 CrossRef.
- S. Q. Chen, J. Y. Hu, J. Shi, M. X. Wang, Y. F. Guo, M. L. Li, J. Duo and T. L. Deng, J. Hazard. Mater., 2019, 371, 694–704 CrossRef.
- X. S. Ye, Z. J. Wu, W. Li, H. N. Liu, Q. Li, B. J. Qing, M. Guo and F. Ge, Colloids Surf., A, 2009, 342, 76–83 CrossRef.
- J. Van and R. Smit, Nature, 1958, 181, 1530–1531 CrossRef.
- H. J. Yang, H. W. Yu, J. K. Sun, J. T. Liu, J. B. Xia, J. D. Fang, Y. Li, F. Z. Qu, A. Y. Song and T. Wu, Chem. Eng. J., 2017, 317, 533–543 CrossRef.
- J. Krtil, J. Inorg. Nucl. Chem., 1962, 24, 1139–1144 CrossRef.
- R. Chakravarty, R. Ram, K. T. Pillai, Y. Pamale, R. V. Kamat and A. Dash, J. Chromatogr. A, 2012, 1220, 82–91 CrossRef.
- Y. Park, Y. C. Lee, W. S. Shin and S. J. Choi, Chem. Eng. J., 2010, 162, 685–695 CrossRef.
- Y. Park, W. S. Shin and S. J. Choi, Chem. Eng. J., 2013, 220, 204–213 CrossRef.
- M. Hashem, S. Sharaf, M. M. A. El-Hady and A. Hebeish, Carbohydr. Polym., 2013, 95, 421–427 CrossRef.
- X. J. Wang, Li Liu, S. Q. Xia, B. Muhoza, J. B. Cai, X. M. Zhang, E. Duhoranimana and J. k. Su, Food Hydrocolloids, 2019, 93, 10–18 CrossRef.
- J. Y. Hu, S. Q. Chen, N. L. Zhang, Z. Wang, J. Shi, Y. F. Guo and T. L. Deng, New J. Chem., 2019, 43, 9658 RSC.
- Y. L. Zong, Y. D. Zhang, X. Y. Lin, D. Ye, D. Qiao and S. N. Zeng, RSC Adv., 2017, 7, 31352–31364 RSC.
- S. Barkhordari and M. Yadollahi, Appl. Clay Sci., 2016, 121–122, 77–85 CrossRef CAS.
- Y. L. Zong, Y. D. Zhang and X. Y. Lin, et al., RSC Adv., 2017, 7, 31352–31364 RSC.
- Y. C. Lai, Y. R. Chang and M. L. Chen, et al., Bioresour. Technol., 2016, 214, 192–198 CrossRef CAS.
- M. Anna, C. Ewa, K. Anna and Z. Marian, Food Chem., 2014, 156, 353–361 CrossRef PubMed.
- I. Langmuir, J. Am. Chem. Soc., 1918, 40, 1361–1403 CrossRef CAS.
- O. Nakahara, Soil Sci. Plant Nutr., 1996, 42, 41–49 CrossRef CAS.
- Y. H. Liu, L. Guo, L. L. Zhu, X. Q. Sun and J. Chen, Chem. Eng. J., 2009, 158, 108–114 CrossRef.
- P. A. Kumar, M. Ray and S. Chakraborty, Chem. Eng. J., 2008, 149, 340–347 CrossRef.
- Q. Li, J. Zhai and W. Zhang, et al., J. Hazard. Mater., 2007, 141, 163–167 CrossRef CAS.
- S. M. Robinson, W. D. Arnold and C. H. Byers, AIChE J., 2010, 40, 2045–2054 CrossRef.
- X. F. Yi, F. L. Sun, Z. H. Han, F. H. Han, J. R. He, M. R. Ou, J. J. Gu and X. P. Xu, Ecotoxicol. Environ. Saf., 2018, 158, 209–318 CrossRef PubMed.
- D. Alby, C. Charnay and M. Héran, et al., J. Hazard. Mater., 2017, 344, 511 CrossRef.
- G. Murthy, M. Sivaiah and S. Kumar, et al., J. Radioanal. Nucl. Chem., 2004, 260, 109–114 CrossRef CAS.
- H. Deng, Y. Li and Y. Huang, et al., Chem. Eng. J., 2016, 286, 25–35 CrossRef CAS.
- H. Deng, Y. Li and L. Wu, J. Hazard. Mater., 2016, 324, 348 CrossRef.
- J. Doležal, J. Stejskal, M. Tympl and V. Kouřím, J. Radioanal. Chem., 1974, 21, 381–387 CrossRef.
Footnote |
| † Electronic supplementary information (ESI) available. See DOI: 10.1039/c9ra09803h |
| This journal is © The Royal Society of Chemistry 2020 |

