 Open Access Article
Synthesis of a GaOOH/ZnBiTaO5 heterojunction photocatalyst with enhanced photocatalytic performance toward enrofloxacin
Panqi Huang b and
Jingfei Luan*ab
aSchool of Physics, Changchun Normal University, Changchun, Jilin 130032, China
bState Key Laboratory of Pollution Control and Resource Reuse, School of the Environment, Nanjing University, Nanjing, 210023, China. E-mail: jfluan@nju.edu.cn
First published on 27th January 2020
Abstract
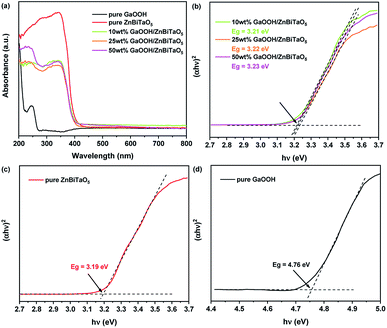
In this work, a GaOOH/ZnBiTaO5 heterojunction photocatalyst was synthesized innovatively and characterization techniques including XRD, SEM-EDS, XPS, FT-IR, PL and UV-Vis DRS were carried out to analyse the structural and morphological properties of the GaOOH/ZnBiTaO5 heterojunction photocatalyst. The GaOOH is dispersed on the surface of ZnBiTaO5 to form a heterojunction structure according to the SEM image. The band gaps of 10 wt%, 25 wt% and 50 wt% GaOOH/ZnBiTaO5 heterojunction photocatalysts were calculated to be 3.21 eV, 3.22 eV and 3.23 eV, respectively, which were between the band gaps of pure ZnBiTaO5 (3.19 eV) and pure GaOOH (4.76 eV). The photocatalytic performance of the GaOOH/ZnBiTaO5 heterojunction photocatalyst was investigated by degrading enrofloxacin under ultraviolet light. The results showed that the as-prepared 25 wt% GaOOH/ZnBiTaO5 presented optimal photocatalytic performance and could remove 58.27% of enrofloxacin in 60 min, which was higher than that of pure ZnBiTaO5 (53.7%) and pure GaOOH (35.4%). In addition, it was confirmed that ˙O2−, h+ and ˙OH were all the active radicals during the degradation process. Finally, the possible degradation mechanism of enrofloxacin was discussed in detail. This work provided a viable strategy for improving the photocatalytic performance of wide band gap semiconductors.
Introduction
Recently, water pollution caused by the extensive use of antibiotics has become one of the most urgent problems to solve. In many advanced oxidation methods, photocatalysis technology is an effective, environmentally friendly and low-cost method for treating environmental pollutants.1–8 Up to now, a large number of semiconductor materials, such as metal oxides (Bi12TiO20, K6Nb10.8O30, BiVO4),9–11 have been identified as active photocatalysts. However, there are still some shortcomings that hinder the practical application of photocatalytic technology, which makes it necessary to design new photocatalysts to increase their potential for practical applications.12,13Among many types of metal oxides, mixed oxides, have been found to have good photocatalytic properties.14–19 According to the previous reports, many polymetallic compounds that had a pyrochlore-type structure, such as Bi2InTaO7,20 Ca2Nb2O7,21 Y2GdSbO7 (ref. 22) and ZnFe2O4,23 showed good photocatalytic properties toward organic contaminants. Carta et al. prepared CoAl2O4 films and verified their high photocatalytic activity.24 Cui et al. also successfully synthesized ZnCo2O4 nanoparticles which could degrade the methyl blue dye solution with high efficiency under light irradiation.25
However, a single photocatalyst had some inherent properties and its practical application was limited. Therefore, the construction of a heterojunction photocatalyst became an effective method for improving the efficiency and stability of the photocatalyst.26–29 For example, Yang et al. synthesized a novel hierarchical Co3O4/Bi2O2CO3 heterojunction composite photocatalyst, which had enhanced photocatalytic activity for degrading methyl orange dye solution under visible light irradiation.30
Furthermore, GaOOH was a wide band gap metal hydroxide semiconductor and commonly was used as a precursor for the preparation of Ga2O3.31 According to previous reports, GaOOH nanorods had significant photocatalytic activity for the degradation of aromatic compounds.32 On the one hand, the original unit cell of GaOOH was composed of twisted octahedral GaO6, which could generate a strong dipole moment, thereby promoting the separation of photogenerated electrons and photogenerated holes.33,34 On the other hand, the low potential of the valence band gave GaOOH a high oxidizing power for various photocatalytic reactions.35
Therefore, ZnBiTaO5 with a pyrochlore-type structure was prepared by solid-state reaction method for the first time in this paper. At the same time, the GaOOH/ZnBiTaO5 heterojunction photocatalyst was constructed by solvothermal method in this paper. The characterizations including X-ray diffraction (XRD), scanning electron microscopy-X-ray energy dispersion spectroscopy (SEM-EDS), X-ray photoelectron spectroscopy (XPS), Fourier transform infrared spectroscopy (FT-IR), UV-visible diffuse reflectance spectroscopy (UV-Vis DRS) were used to analyse the morphology, chemical state, band gap and structure of GaOOH/ZnBiTaO5 heterojunction photocatalyst. Moreover, the enrofloxacin was used to test the photocatalytic performance of GaOOH/ZnBiTaO5 heterojunction photocatalyst. The three-dimensional fluorescence was used to visualize the changes of enrofloxacin in degradation process. The hydroxyl radicals and superoxide radicals which generated in photocatalytic process were determined by the electron paramagnetic resonance spectrometer (EPR). Finally, three possible degradation pathways of enrofloxacin were analysed in detail.
Experimental
The pure ZnBiTaO5 was synthesised by solid-state reaction method. The raw materials, ZnO, Bi2O3 and Ta2O5 with purity of 99.99% (Sinopharm Group Chemical Reagent Co., Ltd., Shanghai, China), were weighed according to an atomic ratio of 1![[thin space (1/6-em)]](https://www.rsc.org/images/entities/char_2009.gif) :
:![[thin space (1/6-em)]](https://www.rsc.org/images/entities/char_2009.gif) 1
1![[thin space (1/6-em)]](https://www.rsc.org/images/entities/char_2009.gif) :
:![[thin space (1/6-em)]](https://www.rsc.org/images/entities/char_2009.gif) 1 (Zn
1 (Zn![[thin space (1/6-em)]](https://www.rsc.org/images/entities/char_2009.gif) :
:![[thin space (1/6-em)]](https://www.rsc.org/images/entities/char_2009.gif) Bi
Bi![[thin space (1/6-em)]](https://www.rsc.org/images/entities/char_2009.gif) :
:![[thin space (1/6-em)]](https://www.rsc.org/images/entities/char_2009.gif) Ta). The calcination was carried out at 900 °C for 25 h in an electric furnace (KSL 1700X, Hefei Kejing Materials Technology Co., Ltd., Hefei, China).
Ta). The calcination was carried out at 900 °C for 25 h in an electric furnace (KSL 1700X, Hefei Kejing Materials Technology Co., Ltd., Hefei, China).
GaOOH/ZnBiTaO5 heterojunction photocatalyst was synthesised by solvothermal method. 1.1296 g Ga2O3 powder with a purity of 99.99% (Aladdin Biochemical Technology Co., Ltd., Shanghai, China) was weighed accurately and the pure ZnBiTaO5 powder was weighed according to demand, then they were placed in a beaker and 80 mL of deionized water and 80 mL of absolute ethanol were added. The mass percentages of GaOOH to ZnBiTaO5 were set to be 10%, 25%, and 50%, respectively. Then the solution was transferred into a 200 mL tetrafluoro-lined reactor and heated at 200 °C for 12 h. In addition, the pure GaOOH was synthesised as a control sample according to the above procedures with no ZnBiTaO5 powder added.
The crystal structure of sample was analysed by the powder X-ray diffractometer (XRD, D/MAX-RB, Rigaku Corporation, Japan) with CuKα radiation (λ = 1.54056). The data was collected using Step-scan program at 295 K and the scan range was 10–80°. The morphological feature of sample was analysed by scanning electron microscopy-X-ray energy dispersion spectroscopy (SEM-EDS, LEO 1530VP, LEO Corporation, Dresden, Germany). The morphology and the diffraction lattice of sample were analysed by the transmission electron microscopy (TEM, Tecnal F20 S-Twin, FEI Corporation, Hillsboro, OR, USA). The element contents of sample were analysed by the X-ray photoelectron spectroscopy (XPS, ESCALABMK-2, VG Scientific Ltd., London, UK). The main chemical vibrational specie of sample was analysed by the fourier transform infrared spectrometer (Nexus, Nicolet Corporation, Madison, WI, USA) with an attenuated total reflectance (ATR) mode. The UV-visible diffuse reflectance spectra of samples were analysed by UV-Vis spectrophotometer (UV-2450, Shimadzu Corporation, Kyoto, Japan) and the background material was pure BaSO4 powder. The superoxide radicals (˙O2−) and hydroxyl radicals (˙OH) generated during photocatalytic degradation of enrofloxacin were determined by electron paramagnetic resonance spectrometer (EPR, EMX-10/12, Bruker, Germany).
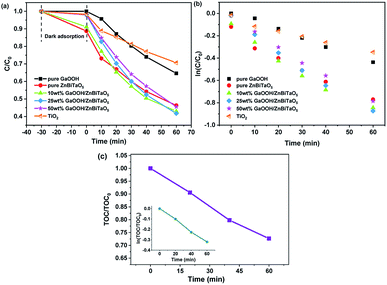
Enrofloxacin was selected to evaluate the photocatalytic performance of GaOOH/ZnBiTaO5. The photocatalytic experiments were carried out in a photocatalytic reactor (Xujiang Machine, Nanjing, China) which contained a mercury lamp (500 W) with major emission wavelength of 365 nm, optical filters (λ < 400 nm) and a magnetic stirring device. The photocatalyst dosage was set to be 1 g L−1 and the initial concentration of enrofloxacin was set to be 10 mg L−1. In the procedure of photocatalytic degradation, 2 mL of the solution was taken under ultraviolet light for 10 min, 20 min, 30 min, 40 min, and 60 min, and the absorbance of enrofloxacin was measured at 276 nm using the UV-visible spectrophotometer (UV-2550, Shimadzu Corporation, Kyoto, Japan). The total organic carbon (TOC) concentration was determined by the TOC analyser (TOC-5000, Shimadzu Corporation). The three-dimensional fluorescence of enrofloxacin was determined by the full-function fluorescence spectrometer (Fluoromax-4, Horiba Scientific). According to our previous report, the relationship between the absorbance and the concentration for enrofloxacin matched the eqn (1).36 In addition, the removal rate of enrofloxacin (D%) was counted by the eqn (2).
| A = 0.10632 × C + 0.01381 | (1) |
| D% = (C0 − Ct)/C0 × 100% | (2) |
Results and discussion
Structure and morphology analysis
The crystal structures of as-prepared samples were analysed by XRD, as shown in Fig. 1. Fig. 1(a) shows the Pawley refinements of the as-prepared ZnBiTaO5. The raw XRD data of the as-prepared ZnBiTaO5 was refined in this paper by using the Materials Studio software, which was based on Pawley analysis. There was a good agreement between the observed and calculated data for the as-prepared ZnBiTaO5, indicating that the as-prepared ZnBiTaO5 was a single phase and had high crystallinity. According to the refinements results, the as-prepared ZnBiTaO5 crystallized with a pyrochlore-type structure, a cubic crystal system and a space group Fm![[3 with combining macron]](https://www.rsc.org/images/entities/char_0033_0304.gif) m (O atom was included in the model). The lattice parameter of the as-prepared ZnBiTaO5 was calculated to be 5.268012 Å. In addition, the diffraction peaks at 29.51°, 34.18°, 49.03°, 58.18°, 61.03°, 71.75° and 79.34° were corresponding with the (111), (200), (220), (311), (222), (400) and (331) planes of pure ZnBiTaO5, respectively, which were all marked in the Fig. 1(a). Fig. 1(b) shows the XRD patterns of pure ZnBiTaO5, pure GaOOH and 10 wt%, 25 wt% and 50 wt% GaOOH/ZnBiTaO5 heterojunction photocatalysts. According to the Fig. 1(b), it could be observed that there were both strong diffraction peaks of pure ZnBiTaO5 and weak diffraction peaks of pure GaOOH in the XRD data of 10 wt%, 25 wt% and 50 wt% GaOOH/ZnBiTaO5 heterojunction photocatalysts, indicating that the 10 wt%, 25 wt% and 50 wt% GaOOH/ZnBiTaO5 heterojunction photocatalysts were prepared successfully.
m (O atom was included in the model). The lattice parameter of the as-prepared ZnBiTaO5 was calculated to be 5.268012 Å. In addition, the diffraction peaks at 29.51°, 34.18°, 49.03°, 58.18°, 61.03°, 71.75° and 79.34° were corresponding with the (111), (200), (220), (311), (222), (400) and (331) planes of pure ZnBiTaO5, respectively, which were all marked in the Fig. 1(a). Fig. 1(b) shows the XRD patterns of pure ZnBiTaO5, pure GaOOH and 10 wt%, 25 wt% and 50 wt% GaOOH/ZnBiTaO5 heterojunction photocatalysts. According to the Fig. 1(b), it could be observed that there were both strong diffraction peaks of pure ZnBiTaO5 and weak diffraction peaks of pure GaOOH in the XRD data of 10 wt%, 25 wt% and 50 wt% GaOOH/ZnBiTaO5 heterojunction photocatalysts, indicating that the 10 wt%, 25 wt% and 50 wt% GaOOH/ZnBiTaO5 heterojunction photocatalysts were prepared successfully.
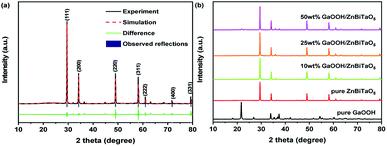 | ||
| Fig. 1 The Pawley refinements of pure ZnBiTaO5 (a); the XRD patterns of pure ZnBiTaO5, pure GaOOH and 10 wt%, 25 wt% and 50 wt% GaOOH/ZnBiTaO5 heterojunction photocatalysts (b). | ||
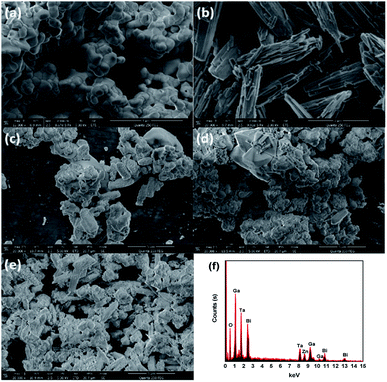
The morphology and elemental composition of samples were analysed by SEM-EDS. Fig. 2 shows the SEM pictures of pure ZnBiTaO5, pure GaOOH, 10 wt%, 25 wt% and 50 wt% GaOOH/ZnBiTaO5 heterojunction photocatalysts and the EDS data of 25 wt% GaOOH/ZnBiTaO5 heterojunction photocatalyst. It could be confirmed that 10 wt%, 25 wt% and 50 wt% GaOOH/ZnBiTaO5 heterojunction photocatalysts were prepared successfully because both ZnBiTaO5 and GaOOH were observed in Fig. 2(c, d and e). According to the Fig. 2(c, d and e), GaOOH covered the surface of ZnBiTaO5 to form a heterojunction structure. In Fig. 2(f), the EDS results of GaOOH/ZnBiTaO5 heterojunction photocatalyst showed that there were no impure elements in GaOOH/ZnBiTaO5 heterojunction photocatalyst.
Band structure and chemical state analysis
Fig. 3 shows the UV-vis DRS spectra and band gaps of pure ZnBiTaO5, pure GaOOH and 10 wt%, 25 wt% and 50 wt% GaOOH/ZnBiTaO5 heterojunction photocatalysts. As shown in Fig. 3(a), compared with the pure GaOOH, the absorption edges of 10 wt%, 25 wt% and 50 wt% GaOOH/ZnBiTaO5 heterojunction photocatalysts all presented apparent red-shift phenomenon. The absorbance was counted by using the Kubelka–Munk transformation method in this paper. The optical absorption near the band edge of the crystalline semiconductors follows the eqn (3).37,38| αhν = A(hν − Eg)n | (3) |
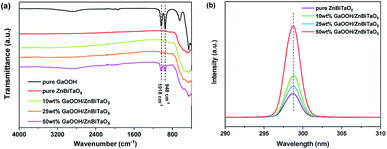
Fig. 4(a) shows the FT-IR spectra of GaOOH/ZnBiTaO5. According to the Fig. 4(a), the peaks that belonged to GaOOH were observed in the FT-IR spectra of 10 wt%, 25 wt% and 50 wt% GaOOH/ZnBiTaO5 heterojunction photocatalysts. It could be seen from Fig. 4(a) that with the increasing composite amount of GaOOH, the peak intensity at 1018 cm−1 and 948 cm−1 became more and more stronger and the two peaks were attributed to the constitutional Ga–OH bending mode and its overtones in GaOOH.40,41 The FT-IR results revealed indirectly the successful preparation of GaOOH/ZnBiTaO5 heterojunction photocatalyst. Fig. 4(b) shows the PL spectra of GaOOH/ZnBiTaO5. In general, the higher intensity of emission peak in PL spectra revealed the higher recombination rate of electrons–holes pairs in photocatalyst. The construction of GaOOH/ZnBiTaO5 heterojunction increased the recombination rate of electrons–holes pairs for ZnBiTaO5, according to the Fig. 4(b). In addition, the intensity of emission peaks for 25 wt% GaOOH/ZnBiTaO5 heterojunction was lowest. Thus, the optimum composite amount of GaOOH in GaOOH/ZnBiTaO5 heterojunction was considered to 25 wt%, according to the results of PL spectra.
The XPS spectra was obtained to analyse the oxidation state and the surface chemical composition of samples. Fig. 5 shows XPS spectra of Zn2p, Bi4f, Ta4f and Ga3d for 25 wt% GaOOH/ZnBiTaO5 heterojunction photocatalyst. The peaks at the binding energies of 1022.0 eV and 1045.0 eV in Fig. 5(a) were corresponding to Zn2p3/2 and Zn2p1/2, respectively, which revealed that the chemical valence of Zn element was +2.42,43 In Fig. 5(b), the binding energies at 159.0 eV and 163.7 eV were attributed to Bi4f7/2 and Bi4f5/2, respectively, and the chemical valence of Bi element was confirmed to be +3.44,45 In Fig. 5(c), the three peaks of Ta4f were appeared at the binding energies of 20.3 eV (Ta4f7/2), 25.1 eV (Ta4f5/2) and 26.5 eV (Ta4f5/2), which indicated that the chemical valence of Ta element was +5.46,47 Moreover, in Fig. 5(d), the binding energies of 19.7 eV and 20.7 eV were all corresponded to Ga3d3/2 and the binding energies of 25.0 eV and 26.5 eV were all corresponded to Ga3d5/2, thus the chemical valence of Ga element was +3.48,49
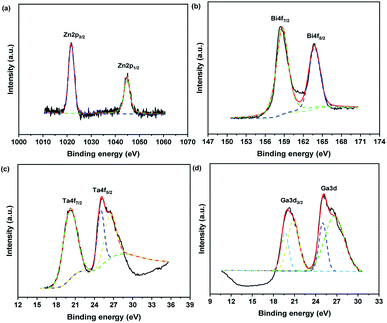 | ||
| Fig. 5 The XPS spectra of Zn2p (a), Bi4f (b), Ta4f (c) and Ga3d (d) for 25 wt% GaOOH/ZnBiTaO5 heterojunction photocatalyst. | ||
Photocatalytic performance test
Fig. 6 shows the removal of enrofloxacin under ultraviolet light irradiation with TiO2, pure ZnBiTaO5, pure GaOOH, 10 wt% GaOOH/ZnBiTaO5, 25 wt% GaOOH/ZnBiTaO5 or 50 wt% GaOOH/ZnBiTaO5 as a photocatalyst. As shown in Fig. 6(a), when the 10 wt%, 25 wt% or 50 wt% GaOOH/ZnBiTaO5 was used as a photocatalyst, after ultraviolet light irradiation for 60 min, the removal rate of enrofloxacin was 57.02%, 58.27% or 54.55%, which was higher than that of pure ZnBiTaO5 (53.7%), pure GaOOH (35.4%), or TiO2 (29.37%). In addition, the photocatalytic kinetics of enrofloxacin degradation in this paper could be analysed using the Langmuir–Hinshelwood (L–H) model (eqn (4)).50 Due to the initial concentration of enrofloxacin in this paper was 10 mg L−1, (1 + Kc) could be assumed to be equal to 1. Thus, eqn (4) could be expressed in the form of eqn (5), where k′ was the pseudo first-order rate constant. After integrating eqn (5) and (6) was obtained.| r = −dc/dt = κθ = κKc/(1 + Kc) | (4) |
| −dc/dt = κKc = k′c | (5) |
| ln(c/c0) = −k′t | (6) |
Moreover, when 25 wt% GaOOH/ZnBiTaO5 was used as a photocatalyst, the three-dimensional fluorescence changes of enrofloxacin during photocatalytic degradation was determined, as shown in Fig. 7. It could be observed that the colour of the three-dimensional fluorescence centre of enrofloxacin became lighter as the photocatalytic reaction time increased, indicating that enrofloxacin was gradually removed during photocatalysis.
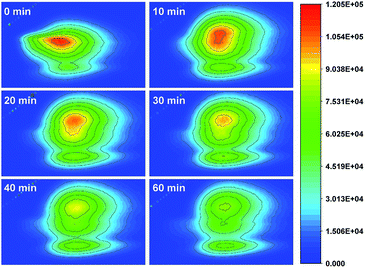 | ||
| Fig. 7 The three-dimensional fluorescence changes of enrofloxacin during photocatalytic degradation with 25 wt% GaOOH/ZnBiTaO5 as a photocatalyst. | ||
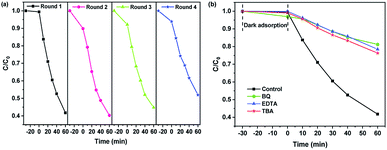
The reusability was one of the important indicators for evaluating photocatalytic activity of photocatalyst. Fig. 8(a) shows the cyclic photocatalytic degradation of enrofloxacin with 25 wt% GaOOH/ZnBiTaO5 heterojunction as a photocatalyst. As shown in Fig. 8(a), the removal rate of enrofloxacin deceased by 10.21% after four cycles. Fig. 8(b) shows the effect of radical scavengers on the degradation of enrofloxacin with 25 wt% GaOOH/ZnBiTaO5 as a photocatalyst. The different radical scavengers were separately added to the enrofloxacin solution at the beginning of the photocatalytic experiment to determine the active species in the process of degrading enrofloxacin. The radical scavengers we used in this paper were ethylenediaminetetraacetic acid (EDTA), tert-butyl alcohol (TBA) and benzoquinone (BQ), which captured holes (h+), hydroxyl radicals (˙OH) and superoxide radicals (˙O2−), respectively.51,52 The formulated EDTA, TBA or BQ concentration was 0.15 mmol L−1, and the amount of EDTA, TBA or BQ added was 1 mL. According to Fig. 8(b), when the EDTA, TBA or BQ was added in enrofloxacin solution, the removal rate of enrofloxacin decreased by 36.73%, 34.57% or 39.46%, respectively, comparing with the control group. Therefore, it could be concluded that ˙O2−, h+ and ˙OH were all the active radicals during degrading enrofloxacin process.
In order to further confirm the presence of ˙O2− and ˙OH in the procedure of photocatalytic degradation, the EPR characterization was performed and the DMPO spin-trapping EPR spectra of 25 wt% GaOOH/ZnBiTaO5 heterojunction photocatalyst was shown in Fig. 9. In the EPR characterization process, the 5,5-dimethyl-1-pyrroline N-oxide (DMPO) was used to spin traps the active radicals in the system for detection. As we could see from Fig. 9, when it was in darkness no EPR signals relevant to DMPO adducts were detected for 25 wt% GaOOH/ZnBiTaO5 heterojunction photocatalyst. However, after ultraviolet light irradiation for 10 min, there were apparent signals in Fig. 9(a) and (b), which were corresponding with DMPO/˙OH adducts and DMPO/˙O2− adducts, respectively.53,54
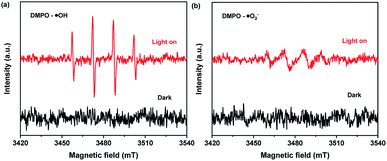 | ||
| Fig. 9 DMPO spin-trapping EPR spectra of 25 wt% GaOOH/ZnBiTaO5 heterojunction photocatalyst in aqueous dispersion for DMPO–˙OH (a) and in methanol dispersion for DMPO–˙O2− (b). | ||
Possible degradation mechanism analysis
The possible photocatalytic degradation mechanism of enrofloxacin under illumination with GaOOH/ZnBiTaO5 heterojunction photocatalyst is shown in Fig. 10. The potentials of the valence band (VB) and conductor band (CB) for semiconductor can be counted according to the eqn (7) and (8):55| ECB = X − Ee − 0.5Eg | (7) |
| EVB = ECB + Eg | (8) |
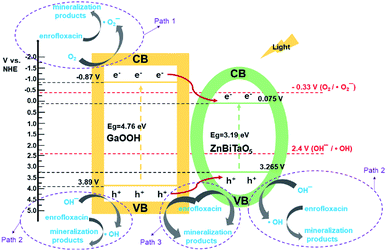 | ||
| Fig. 10 Possible photocatalytic degradation mechanism of enrofloxacin under illumination with GaOOH/ZnBiTaO5 heterojunction photocatalyst. | ||
Conclusions
In this paper, pure ZnBiTaO5 was synthesized by the solid-state reaction method firstly. The pure ZnBiTaO5 crystallized with a pyrochlore-type structure, a cubic crystal system and a space group Fm![[3 with combining macron]](https://www.rsc.org/images/entities/char_0033_0304.gif) m and the lattice parameter of the pure ZnBiTaO5 was calculated to be 5.268012 Å. Then, 10 wt%, 25 wt% and 50 wt% GaOOH/ZnBiTaO5 heterojunction photocatalysts were synthesized by solvothermal method. The diffraction peaks of pure GaOOH and pure ZnBiTaO5 were both observed in XRD results of 10 wt%, 25 wt% and 50 wt% GaOOH/ZnBiTaO5 heterojunction photocatalysts, which meant that the 10 wt%, 25 wt% and 50 wt% GaOOH/ZnBiTaO5 heterojunction photocatalysts were synthesized successfully. In addition, the construction of heterojunction structure increased the band gap of ZnBiTaO5, according to the UV-Vis DRS results. In the experiments of degrading enrofloxacin, the removal rate of enrofloxacin with 10 wt%, 25 wt% or 50 wt% GaOOH/ZnBiTaO5 as a photocatalyst was 57.02%, 58.27% or 54.55%, respectively, which was higher than that of pure ZnBiTaO5 (53.7%), pure GaOOH (35.4%) or TiO2 (29.37%). Therefore, the construction of heterojunction could improve the photocatalytic performance of pure ZnBiTaO5 and pure GaOOH. Besides, it was confirmed that ˙O2−, h+ and ˙OH were all active radicals in degradation process. And the ˙O2− and ˙OH generated during photocatalytic process were determined by EPR. Finally, the possible paths of degradation of enrofloxacin were described in detail.
m and the lattice parameter of the pure ZnBiTaO5 was calculated to be 5.268012 Å. Then, 10 wt%, 25 wt% and 50 wt% GaOOH/ZnBiTaO5 heterojunction photocatalysts were synthesized by solvothermal method. The diffraction peaks of pure GaOOH and pure ZnBiTaO5 were both observed in XRD results of 10 wt%, 25 wt% and 50 wt% GaOOH/ZnBiTaO5 heterojunction photocatalysts, which meant that the 10 wt%, 25 wt% and 50 wt% GaOOH/ZnBiTaO5 heterojunction photocatalysts were synthesized successfully. In addition, the construction of heterojunction structure increased the band gap of ZnBiTaO5, according to the UV-Vis DRS results. In the experiments of degrading enrofloxacin, the removal rate of enrofloxacin with 10 wt%, 25 wt% or 50 wt% GaOOH/ZnBiTaO5 as a photocatalyst was 57.02%, 58.27% or 54.55%, respectively, which was higher than that of pure ZnBiTaO5 (53.7%), pure GaOOH (35.4%) or TiO2 (29.37%). Therefore, the construction of heterojunction could improve the photocatalytic performance of pure ZnBiTaO5 and pure GaOOH. Besides, it was confirmed that ˙O2−, h+ and ˙OH were all active radicals in degradation process. And the ˙O2− and ˙OH generated during photocatalytic process were determined by EPR. Finally, the possible paths of degradation of enrofloxacin were described in detail.
Conflicts of interest
There are no conflicts to declare.Acknowledgements
This study was supported by a grant from the Research Foundation of Innovative Research and Supporting Program of Changchun Normal University in 2019, a grant from the Research Foundation of Science and Technology Bureau of Jilin Province for Middleaged Technological Innovative Scientist and Team Based on Environmental Function Material and Water Pollution Control, a grant from China–Israel Joint Research Program in Water Technology and Renewable Energy (No. 5), the National Natural Science Foundation of China (No. 20877040).References
- A. Fujishima, X. Zhang and D. A. Tryk, Surf. Sci. Rep., 2008, 63(12), 515–582 CrossRef CAS.
- K. Hashimoto, H. Irie and A. Fujishima, Jpn. J. Appl. Phys., 2005, 44(12), 8269–8285 CrossRef CAS.
- A. Mills and S. L. Hunte, J. Photochem. Photobiol., A, 1997, 108(1), 1–35 CrossRef CAS.
- A. L. Linsebigler, L. Guangquan, J. T. Yates and T. John, Chem. Rev., 1995, 95(3), 735–758 CrossRef CAS.
- S. Sakthivel and H. Kisch, Angew. Chem., Int. Ed., 2010, 42(40), 4908–4911 CrossRef PubMed.
- M. R. Hoffmann, S. T. Martin and W. Choi, et al., Chem. Rev., 1995, 95(1), 69–96 CrossRef CAS.
- D. Beydoun, R. Amal and G. Low, et al., J. Nanopart. Res., 1999, 1(4), 439–458 CrossRef CAS.
- X. M. Zhou, G. Liu and J. G. Yu, et al., J. Mater. Chem., 2012, 22(40), 21337–21354 RSC.
- X. Zhang, Z. H. Ai, F. L. Jia, L. Z. Zhang, X. X. Fan and Z. G. Zou, Mater. Chem. Phys., 2007, 103, 162–167 CrossRef CAS.
- J. K. Zhou, Z. G. Zou, A. K. Ray and X. S. Zhao, Ind. Eng. Chem. Res., 2007, 46, 745–749 CrossRef CAS.
- G. K. Zhang, X. Zou, J. Gong, F. S. He, H. Zhang, Q. Zhang, Y. Liu, X. Yang and B. Hu, J. Alloys Compd., 2006, 425, 76–80 CrossRef CAS.
- K. W. Li, Y. Wang, H. Wang, M. K. Zhu and H. Yan, Nanotechnology, 2006, 17, 4863–4867 CrossRef CAS.
- J. F. Luan, B. C. Pan, Y. Paz, Y. M. Li, X. S. Wu and Z. G. Zou, Phys. Chem. Chem. Phys., 2009, 11, 6289–6298 RSC.
- J. Xu, Y. P. Wan, Y. L. Huang, Y. R. Wang, L. Qin and H. J. Seo, Mater. Lett., 2016, 179, 175–178 CrossRef CAS.
- A. A. Alemi, R. Kashfi and B. Shabani, J. Mol. Catal. A: Chem., 2014, 392, 290–298 CrossRef CAS.
- Y. Y. Bu, Z. Y. Chen and C. J. Sun, Appl. Catal., B, 2015, 179, 363–371 CrossRef CAS.
- S. Nazim, T. Kousar, M. Shahid, M. A. Khan, G. Nasar, M. Sher and M. F. Warsi, Ceram. Int., 2016, 42, 7647–7654 CrossRef CAS.
- M. Kiransan, A. Khataee, S. Karaca and M. Sheydaei, Spectrochim. Acta, Part A, 2015, 140, 465–473 CrossRef CAS PubMed.
- I. Ghaffar, M. F. Warsi, M. Shahid and I. Shakir, Phys. E, 2016, 79, 1–7 CrossRef CAS.
- J. F. Luan, W. Zhao, J. W. Feng, H. L. Cai, Z. Zheng, B. C. Pan, X. S. Wu, Z. G. Zou and Y. M. Li, J. Hazard. Mater., 2009, 164, 781 CrossRef CAS PubMed.
- L. W. Zhang, H. B. Fu, C. Zhang and Y. F. Zhu, J. Phys. Chem. C, 2008, 112, 3126–3133 CrossRef CAS.
- J. F. Luan and J. H. Chen, Materials, 2012, 5, 2423–2438 CrossRef CAS.
- X. X. Xu, A. K. Azad and J. T. S. Irvine, Catal. Today, 2013, 199, 22–26 CrossRef CAS.
- G. Carta, M. Casarin, N. El Habra, M. Natali, G. Rossetto, C. Sada, E. Tondello and P. Zanella, Electrochim. Acta, 2005, 50, 4592–4599 CrossRef CAS.
- B. Cui, H. Lin, X. C. Zhao, J. B. Li and W. D. Li, Acta Phys.-Chim. Sin., 2011, 27, 2411–2415 CAS.
- U. Lamdab, K. Wetchakun, S. Phanichphant, W. Kangwansupamonkon and N. Wetchakun, J. Mater. Sci., 2015, 50, 5788–5798 CrossRef CAS.
- S. K. Ray, D. Dhakal and S. W. Lee, Chem. Eng. J., 2018, 347, 836–848 CrossRef CAS.
- J. S. Cheng, L. Frezet, P. Bonnet and C. Wang, Catal. Lett., 2018, 148, 1281–1288 CrossRef CAS.
- L. M. Song, Y. M. Li, H. F. Tian, X. Q. Wu, S. Fang and S. J. Zhang, Mater. Sci. Eng., B, 2014, 189, 70–75 CrossRef CAS.
- C. M. Yang, G. M. Gao, Z. F. Guo, L. T. Song, J. Z. Chi and S. C. Gan, Appl. Surf. Sci., 2017, 400, 365–374 CrossRef CAS.
- X. Liu, G. Qiu, Y. Zhao, N. Zhang and R. Yi, J. Alloys Compd., 2007, 439, 275–278 CrossRef CAS.
- M. Sun, D. Li, W. Zhang, X. Fu, Y. Shao, W. Li, G. Xiao and Y. He, Nanotechnology, 2010, 21, 355601 CrossRef PubMed.
- Y. Inoue, Energy Environ. Sci., 2009, 2, 364–386 RSC.
- J. Sato, H. Kobayyashi and Y. Inoue, J. Phys. Chem. B, 2003, 107, 7970–7975 CrossRef CAS.
- M. Sun, D. Li, W. Zhang, X. Fu, Y. Shao, W. Li, G. Xiao and Y. He, Nanotechnology, 2010, 21, 355601 CrossRef PubMed.
- P. Q. Huang and J. F. Luan, RSC Adv., 2019, 9, 19930–19939 RSC.
- Z. G. Zou, J. H. Ye and H. Arakawa, J. Mater. Sci. Lett., 2000, 19, 1909–1911 CrossRef CAS.
- S. Krehula, M. Ristić, S. Kubuki, Y. Iida, M. Fabián and S. Musić, J. Alloys Compd., 2015, 620, 217–227 CrossRef CAS.
- J. F. Luan, Y. Shen, S. Wang and N. B. Guo, Polymers, 2017, 9, 69 CrossRef PubMed.
- G. G. Li, C. Peng, C. X. Li, P. P. Yang, Z. Y. Hou, Y. Fan, Z. Y. Cheng and J. Lin, Inorg. Chem., 2010, 49, 1449–1457 CrossRef CAS PubMed.
- X. H. Liu, G. Z. Qiu, Y. Zhao, N. Zhang and R. Yi, J. Alloys Compd., 2007, 439, 275–278 CrossRef CAS.
- G. Deroubaix and P. Marcus, Surf. Interface Anal., 1992, 18, 39 CrossRef CAS.
- B. R. Strohmeier, Surf. Sci. Spectra, 1994, 3, 128 CrossRef CAS.
- B. V. R. Chowdari and Z. Rong, Solid State Ionics, 1996, 86, 527 CrossRef.
- P. Kulkarni, S. K. Kulkarni, A. S. Nigavekar, S. K. Agarwal, V. P. S. Awana and A. V. Narlikar, Phys. C, 1990, 166, 530 CrossRef CAS.
- G. R. Gruzalski and D. M. Zehner, Phys. Rev. B: Condens. Matter Mater. Phys., 1986, 34, 3841 CrossRef CAS PubMed.
- A. R. H. F. Ettema and C. Haas, J. Phys.: Condens. Matter, 1993, 5, 3817 CrossRef CAS.
- G. Leonhardt, A. Berndtsson, J. Hedman, M. Klasson and R. Nilsson, Phys. Status Solidi B, 1973, 60, 241 CrossRef CAS.
- B. J. Flinn and N. S. McIntyre, Surf. Interface Anal., 1990, 15, 19 CrossRef CAS.
- X. C. Meng and Z. S. Zhang, Appl. Surf. Sci., 2017, 392, 169–180 CrossRef CAS.
- R. Palominos, J. Freer, M. A. Mondaca and H. D. Mansilla, J. Photochem. Photobiol., A, 2008, 193, 139–145 CrossRef CAS.
- Y. W. Gao, Y. Wang and H. Zhang, Appl. Catal., B, 2015, 178, 29–36 CrossRef CAS.
- Y. Liu, S. Yu, Z. Y. Zhao, F. Dong, X. A. Dong and Y. Zhou, J. Phys. Chem. C, 2017, 121(22), 12168–12177 CrossRef CAS.
- K. Liu, J. L. Li, X. Yan and W. D. Shi, Nano, 2017, 12(10), 1750129 CrossRef CAS.
- L. Jiang, X. Yuan and G. Zeng, et al., Appl. Catal., B, 2018, 227, 376–385 CrossRef CAS.
| This journal is © The Royal Society of Chemistry 2020 |

