 Open Access Article
Surface reduction properties of ceria–zirconia solid solutions: a first-principles study†
Xuesong Cao ,
Chenxi Zhang
 *,
Zehua Wang,
Wen Liu and
Xiaomin Sun*
Environment Research Institute, Shandong University, Qingdao 266200, P. R. China. E-mail: caoxueshine@163.com; sdzhangcx@163.com; zhstart13@foxmail.com; lwen951014@163.com; sxmwch@sdu.edu.cn
First published on 28th January 2020
Abstract
Based on the density functional theory (DFT), the reduction properties of Ce1−xZrxO2 (110) surfaces were systematically calculated using CO as a probe for thermodynamic study, and a large supercell was applied to build the whole composition range (x = 0.125, 0.250, 0.375, 0.500, 0.625, 0.750, 0.875). From the calculated energy barriers of CO oxidation by lattice oxygen, we found that composition Ce0.875Zr0.125O2 exhibited the most promising catalytic effectiveness with the lowest activation energy of 0.899 eV. Moreover, the active surface O3c ions coordinated by two Zr ions and one Ce ion were facilely released from their bulk positions than the O3c ions surrounded by two Ce ions and one Zr ion on Ce0.625Zr0.375O2, Ce0.500Zr0.500O2, and Ce0.375Zr0.625O2 (110) surfaces. This difference could be explained by the binding strength of O3c with different neighboring cations.
1. Introduction
Ceria–zirconia (Ce1−xZrxO2) solid solutions exhibit superior performance as heterogeneous catalytic materials due to its good thermal stability,1,2 excellent oxygen storage/release capacity and reducibility.3–5 In the last few decades, Ce1−xZrxO2 has been extensively used as an active component in three-way catalysts (TWCs) to expand the air-to-fuel ratio operating window, ensuring the effective elimination of carbon monoxide (CO), nitrogen oxides (NOx), and hydrocarbons (HCs) during engine operation.6 Besides, water gas shift reaction,7 NH3 selective catalytic reduction,8 catalytic oxidation of volatile organic compounds (VOCs)9 and various catalytic reactions also can be promoted by Ce1−xZrxO2.Ce1−xZrxO2 solid solutions with different compositions result in different catalytic performance and surface properties. Great efforts have been made to investigate the most promising Ce1−xZrxO2 compositions for OSC,10–13 which is closely related to the reduction behavior. Madier et al.10 observed that Ce0.63Zr0.37O2 had the maximum CO uptake across the whole composition range, with a dynamic OSC of 219 μmol O per g at 400 °C. Boaro et al.11 proposed that Ce1−xZrxO2 with 0.2 < x < 0.5 showed an increased CO oxidation activity under cycling feed-stream conditions. For heterogeneous catalytic reactions, the most important is the surface redox properties.14 To obtain the optimum composition (Ce/Zr ratio), evaluation of the surface reducibility of Ce1−xZrxO2, especially the Ce4+/Ce3+ redox behavior is necessary.
Oxygen vacancy formation energies at surfaces have been calculated using the DFT + U (U = 5.0 eV) method, by comparing the formation energies of CeO2 (110) surface (2.30 eV) and Ce0.75Zr0.25O2 (110) surface (0.94 eV);15 Zr-doping (25% in this work) dramatically improved the reduction properties of ceria. In contrast, Zr-doping in CeO2 (111) surface and ceria bulk only lowered the formation energies by 0.52 eV (ref. 16) and 0.62 eV,17 respectively. To explain the lowering of the surface reduction energy, the electronic structure was obtained via the density of states (DOS) and partial charge density distribution. Yang et al.15 found that for the Ce0.75Zr0.25O2−x (110) slab, the excess electrons localized on a surface of Ce-ion and on a subsurface of Ce-ion were stabilized by the crystal potential and occupied the gap states lower in energy compared to the CeO2−x (110) surface. Balducci et al.18 suggested that the smaller Zr dopants removed the strain caused by the increase in the ionic size when Ce4+ changed to Ce3+, which is responsible for the improvement in the reducibility.
In the present work, we explored the CO oxidation mechanisms and energetics on Ce1−xZrxO2 (110) surfaces, using periodic DFT computation. The catalytic models were built from a 2 × 2 × 2 supercell to cover the whole composition range (x = 0.125, 0.250, 0.375, 0.500, 0.625, 0.750, 0.875). The main focus of this paper is to determine how the Ce/Zr ratio affects the surface reducibility of Ce1−xZrxO2, which has not been systematically calculated. Furthermore, low-temperature oxidation of CO is of practical importance for pollution control in many industrial processes, such as lowering automotive emissions.19,20 Our investigation provides an atomic-scale insight for the design of efficient and economical heterogeneous catalysts.
2. Computational details
2.1. Computational methods
In this study, all geometric optimization and calculations were performed by using the DMol3 software package in Material Studio,21,22 based on the periodic DFT method. The generalized gradient approximation (GGA) with Perdew–Burke–Ernzerhof (PBE)23 was implemented as the exchange–correlation functional. The double numerical plus d-function (DND) basis set was used to optimize all spin unrestricted structures. The Ce (4f1, 5s2, 5p6, 5d1, 6s2) and Zr (4s2, 4p6, 4d2, 5s2) electrons were treated as valence electrons using the effective core potential (ECP) method.24 The electrons of O, C and N atoms were treated using the all electron method. Specifically, a Fermi smearing of 0.005 Ha and an orbital cutoff of 5.0 Å were used to improve the computational performance. A grid of 1 × 1 × 1 Monkhorst–Pack k-points was applied to perform integration in the first Brillouin zone.25 The SCF tolerance was employed to 1.0 × 10⁻⁵ Ha, and then the convergence criteria of maximum energy change, maximum force, and maximum displacement were set as 2.0 × 10⁻⁵ Ha, 0.004 Ha Å−1, and 0.005 Å, respectively.The adsorption energy (Eads) of the adsorbate was defined as follows:
| Eads = E(substrate+adsorbate) − E(substrate) − E(adsorbate) | (1) |
| ΔE = EFS − EIS | (2) |
| Ea = ETS − EIS | (3) |
2.2. Computational models
Ceria is a cubic fluorite structure with a space group Fm![[3 with combining macron]](https://www.rsc.org/images/entities/char_0033_0304.gif) m; the optimized lattice parameter was 5.478 Å, which is in good agreement with the experimental result of 5.411 Å.28 Moreover, cubic zirconia (c-ZrO2, the Fm
m; the optimized lattice parameter was 5.478 Å, which is in good agreement with the experimental result of 5.411 Å.28 Moreover, cubic zirconia (c-ZrO2, the Fm![[3 with combining macron]](https://www.rsc.org/images/entities/char_0033_0304.gif) m space group) is also attributed to fluorite oxides. CeO2 and c-ZrO2 are interesting as the limiting forms of ceria–zirconia. Our calculated lattice constant for c-ZrO2 was 5.112 Å, the corresponding experimental value was 5.090 Å.29
m space group) is also attributed to fluorite oxides. CeO2 and c-ZrO2 are interesting as the limiting forms of ceria–zirconia. Our calculated lattice constant for c-ZrO2 was 5.112 Å, the corresponding experimental value was 5.090 Å.29
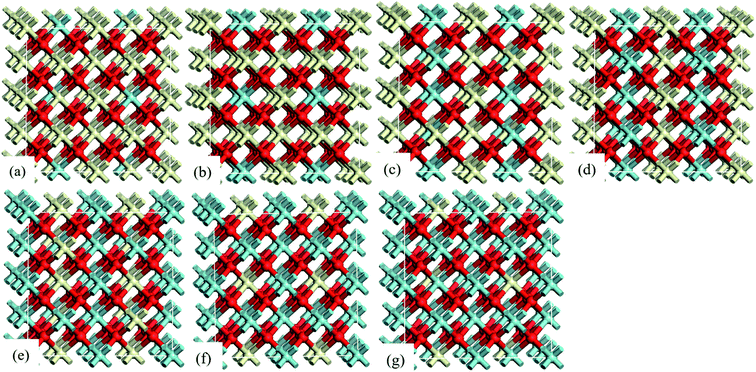
The computational model in this study was a 2 × 2 × 2 supercell with 96-atom built from a conventional 12-atom unit cell of bulk CeO2. To be consistent with the models studied by Wang et al.,12,30 the lattice substituting model was used to model Ce1−xZrxO2. In the supercell, 4, 8, 12, 16, 20, 24 and 28 Zr-doping atoms were introduced to replace Ce atoms to represent stoichiometric Ce0.875Zr0.125O2, Ce0.750Zr0.250O2, Ce0.625Zr0.375O2, Ce0.500Zr0.500O2, Ce0.375Zr0.625O2, Ce0.250Zr0.750O2, and Ce0.125Zr0.875O2 bulk (see Fig. 1), respectively. Besides, Ce1−xZrxO2 (110) surfaces were cleaved due to its lower surface energy and Ce4+/Ce3+ reduction energy.31 A 15 Å vacuum thickness was applied to eliminate slab–slab interactions. The Ce1−xZrxO2 (110) slabs consist of four atomic layers with the bottom two layers kept fixed in their bulk positions and the others were relaxed.
The DFT calculation with a Hubbard U correction (DFT + U) was applied to describe the electronic properties of CeO2 and ZrO2, where U = 5 eV was suggested to be proper for modeling on stoichiometric and reduced CeO2 and ZrO2 surfaces.15,32 However, previous researches indicated that plain DFT calculations could provide a reasonable prediction of reduction energies, even better than that from DFT + U.33,34 To ascertain the importance of the U parameter, we have calculated the oxygen vacancy formation energies on Ce0.875Zr0.125O2 (110) surface with U = 5 eV (0.472 eV) and without incorporating U (0.476 eV). The vacancy formation energy without incorporating U was within 1% of U = 5 eV ones. Hence, the DFT + U method was not considered in the current work.
3. Results
3.1. CO oxidation on Ce0.875Zr0.125O2 (110) surface
Conserving Ce0.875Zr0.125O2 (110) surface stoichiometry with bulk, top surface layer and the subsurface layer of the slab contained sixteen Ce4+, two of the top surface layer Ce4+ were replaced with Zr4+. To better understand the catalytic mechanism, the adsorption behaviors of CO gas molecules on Ce0.875Zr0.125O2 (110) surface were carefully discussed. We identified nine adsorption sites (Fig. S1(a)†): (1) the top site of Zr (ZrT); (2) the top site of Ce (CeT); (3) the top site of O (OT1, OT2); (4) the 4-fold O-hollow site (OH1, OH2); (5) the bridge site between two O atoms (Ob1, Ob2, Ob3). All the optimized configurations were illustrated in Fig. S1† and the calculated adsorption energies of CO on Ce0.875Zr0.125O2 (110) surface were summarized in Table S1.† We found that the adsorption of CO on the top site of Zr (Fig. S1(b)†) was the most stable configuration with an adsorption energy of −0.569 eV. Moreover, Zr-doping could increase the binding energy of CO with an interface, by comparing the calculated binding energy of Zr-doped ceria (≈−0.4 eV) and ceria (≈−0.2 eV).34,35It is widely believed36,37 that the detailed mechanism of CO oxidation on CeO2 surface through the Mars–van Krevelen (MvK) mechanism,38 in which CO extracts a surface lattice oxygen to form CO2 and leaves behind an oxygen vacancy (OV), and then gas phase O2 replenishes the oxygen vacancy site to complete the catalytic cycle. For the reaction mechanism of a single CO interacting with one lattice O of Ce0.875Zr0.125O2 (110) surface, the calculated energy profile and structure models of the reactant, transition state and product were presented in Fig. 2.
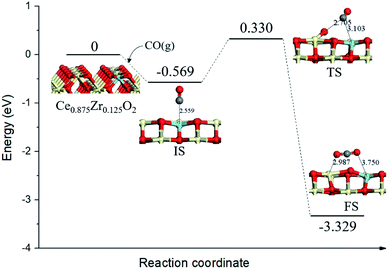 | ||
| Fig. 2 Calculated energy profile and structures of key states of CO oxidation by lattice oxygen on Ce0.875Zr0.125O2 (110) surface. Gray spheres represent the C atoms. | ||
We took the state with CO gas molecule adsorbed at ZrT site (Eads = −0.569 eV) as the initial state (IS), the distance between C atom and surface lattice O was 2.559 Å. Subsequently, the CO molecule directly incorporated a surface O from the gas phase following the so-called Eley–Rideal (ER) mechanism. The energy barrier for this process was 0.899 eV, this result was a little lower than that of CO oxidation on the Pd1/CeO2 (110) surface (0.954 eV),39 indicating that the catalytic activity of ceria–zirconia solid solutions was comparable with traditional ceria-based single-atom catalyst. In the final state (FS), gas phase CO2 formed above the Ce0.875Zr0.125O2 (110) surface containing an oxygen vacancy, meanwhile, the surface oxygen anion neighboring the vacancy moved toward the Ce–Zr bridge site by about 1.281 Å.
3.2. CO oxidation on Ce0.750Zr0.250O2 (110) surface
On the Ce0.750Zr0.250O2 (110) surface, four of the top surface layer Ce atoms were replaced with Zr (Ce0.750Zr0.250O2, see Fig. 3). Based on the adsorption behaviors of CO on Ce0.875Zr0.125O2 (110) surface as discussed above, we also considered CO adsorbtion at the ZrT site as the initial state for CO oxidation on Ce1−xZrxO2 (x = 0.250, 0.375, 0.500, 0.625, 0.750, 0.875) (110) surfaces. As shown in Fig. 3 (IS), CO combined with a Zr atom, the distance was determined to be 2.562 Å and the binding energy was −0.600 eV. In the transition state (TS, Fig. 3), adsorbed CO molecule migrated to a lattice O and the distance decreased to 2.103 Å. This process needed to overcome an activation barrier of 1.555 eV and was exothermic by 2.367 eV. With the formation of CO2 (FS, Fig. 3), the neighboring lattice O moved to the Ce–Zr bridge site, the bond of Ce–O, and Zr–O were 2.485 Å and 2.048 Å, respectively.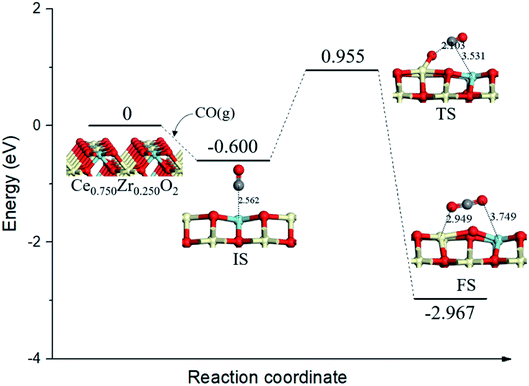 | ||
| Fig. 3 Calculated energy profile and structures of key states of CO oxidation by lattice oxygen on Ce0.750Zr0.250O2 (110) surface. | ||
3.3. CO oxidation on Ce0.625Zr0.375O2 and Ce0.500Zr0.500O2 (110) surfaces
On the Ce0.625Zr0.375O2 (110) surface, four of the top surface layer Ce atoms and two of the subsurface layer Ce atoms were replaced with Zr (Ce0.625Zr0.375O2, see Fig. 4). In this case, four surface lattice oxygen neighboring ZrT sites were not all equivalent: three of these oxygen (OA) bonded with two Ce4+ and one Zr4+, while one of the oxygen (OB) bonded with two Zr4+ and one Ce4+. There are two pathways for CO oxidation with different surface lattice oxygen; the corresponding energy profile and structure models are illustrated in Fig. 4. From the initial state (IS), CO adsorbed at the ZrT site of Ce0.625Zr0.375O2 (110) surface, the adsorption energy was calculated to be −0.607 eV. Then, CO extracted OA via TS1; this process needed a higher energy barrier of 2.239 eV and the reaction energy was −2.216 eV. Alternatively, CO might combine with OB, going through another transition state (TS2) with a smaller energy barrier of 1.175 eV.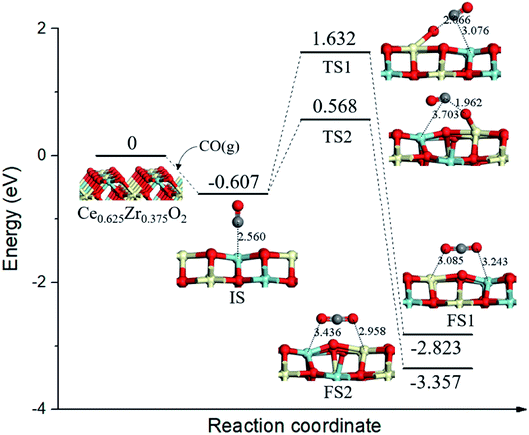 | ||
| Fig. 4 Calculated energy profile and structures of key states of CO oxidation by lattice oxygen on Ce0.625Zr0.375O2 (110) surface. | ||
On the Ce0.500Zr0.500O2 (110) surface, four of the top surface layer Ce atoms and four of the subsurface layer Ce atoms were replaced with Zr (Ce0.500Zr0.500O2, see Fig. S2†). According to our calculations, the detailed mechanisms of CO oxidation on the Ce0.500Zr0.500O2 (110) surface were similar to that on the Ce0.625Zr0.375O2 (110) surface, as shown in Fig. S2.†
3.4. CO oxidation on Ce0.375Zr0.625O2, Ce0.250Zr0.750O2 and Ce0.125Zr0.875O2 (110) surfaces
On the Ce0.375Zr0.625O2 (110) surface, four of the top surface layer Ce atoms and six of the subsurface layer Ce atoms were replaced with Zr (Ce0.375Zr0.625O2, see Fig. 5). Two possible reaction routes were estimated based on the two types of surface lattice oxygens (OA and OB) as mentioned above. For the first route, the migration of adsorbed CO species (−0.521 eV, IS, Fig. 5) toward OA led to the formation of a bent CO2 species (IM1, Fig. 5) via TS1 (Ea = 1.602 eV, Fig. 5); IM1 was calculated to be 0.301 eV, more stable than the IS. Then IM1 evolved to the final state (FS1, Fig. 5) through an almost barrierless process. The second route was determined to be the same as that of the first route.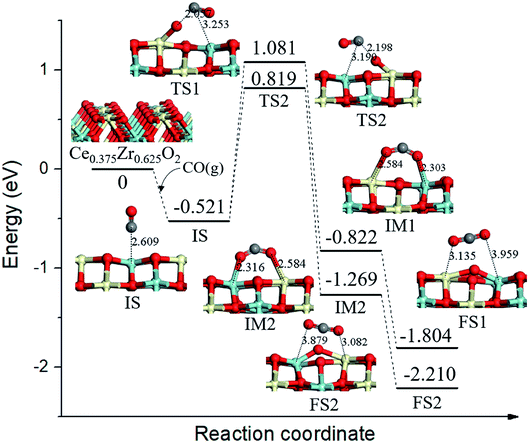 | ||
| Fig. 5 Calculated energy profile and structures of key states of CO oxidation by lattice oxygen on Ce0.375Zr0.625O2 (110) surface. | ||
On the Ce0.250Zr0.750O2 (110) surface, four of the top surface layer Ce atoms and eight of the subsurface layer Ce atoms were replaced with Zr (Ce0.250Zr0.750O2, see Fig. S3†). On the Ce0.125Zr0.875O2 (110) surface, six of the top surface layer Ce atoms and eight of the subsurface layer Ce atoms were replaced with Zr (Ce0.125Zr0.875O2, see Fig. S4†). Calculated energy profile and structure models were presented in Fig. S3 and S4† for CO oxidation on Ce0.250Zr0.750O2 and Ce0.125Zr0.875O2 (110) surfaces, respectively.
4. Discussion
In this work, the adsorption energies and barrier energies of CO oxidation on various Ce1−xZrxO2 (110) surfaces were systematically studied using the DFT method. These calculation results provide some insights into the surface reducibility of Ce1−xZrxO2 toward CO oxidation. From the adsorption behaviors of CO on the Ce0.875Zr0.125O2 (110) surface, we found that ZrT was the most favorable active site owing to the maximum adsorption energy. Besides, according to the adsorption energies of CO on the CeO2 (110) surface (Eads ≈ −0.2 eV)34,35 and ZrO2 (110) surface (Eads ≈ −0.6 eV),40 it also could be concluded that CO preferred to interact with Zr atoms and adsorb on the top site of Zr on Ce1−xZrxO2 (110) surfaces. However, it is noteworthy that CO adsorption on Ce1−xZrxO2 (110) surfaces were still rather weak (Eads ≈ −0.6 eV), indicating that the feasible CO oxidation mechanism was gas-phase CO molecule directly extracting surface lattice oxygen following the so-called Eley–Rideal (ER) mechanism,36,37 exactly as CO oxidation on the CeO2 (110) and (111) surfaces.35As shown in Fig. 4, S2,† and 5, Ce0.625Zr0.375O2, Ce0.500Zr0.500O2, and Ce0.375Zr0.625O2 (110) surfaces contained two types of lattice oxygens, the CO oxidation activity of these oxygens were quite different. In particular, the activation barriers of CO reacted with O3c ions coordinated by two Zr ions and one Ce ion were relatively lower than O3c ions surrounded by two Ce ions and one Zr ion. In the previous work, different types of surface O ions were also found on the Ce0.75Zr0.25O2 (111) surface, and the vacancy formation energy for the surface O3c surrounded by three Ce neighbors was higher than the surface O3c coordinated by two Ce ions and one Zr ion.16 We interpreted that the binding strength of O3c with neighboring cations caused the difference of O3c reactivity. Considering that the size of Ce ion would increase when Ce4+ changed to Ce3+, O3c ions coordinated by smaller Zr ion might promote the reduction process.18
We presented the activation barrier energies of CO oxidation on various Ce1−xZrxO2 (110) surfaces in Fig. 6. As we all know, the occurrence of redox reaction through a low energy barrier process was thermodynamically favorable. Therefore, energy barriers of 1.175 eV, 1.281 eV and 1.340 eV for CO oxidation on Ce0.625Zr0.375O2, Ce0.500Zr0.500O2 and Ce0.375Zr0.625O2 (110) surfaces were used to compare with others. Among all the compositions, the Ce0.875Zr0.125O2 (110) surface exhibited the most remarkable catalytic effectiveness, with the lowest energy barrier of 0.899 eV. This result was consistent with the experimental value reported by Piumetti et al.41 that the Ce0.9Zr0.1O2 catalyst shown the highest CO oxidation activity (Zr-content was in the range of 10–30%). Trovarelli et al.3 observed that dynamic OSC of Ce1−xZrxO2 showed a monotonic increase with increasing Ce-content and the optimum composition was Ce0.9Zr0.1O2. However, these results were at odds with we mentioned above, composition of Ce1−xZrxO2 with 0.2 < x < 0.5 possessed an increased catalytic activity.10,11,42,43 There is still an intense scientific debate on the optimum Ce/Zr composition for catalytic materials.
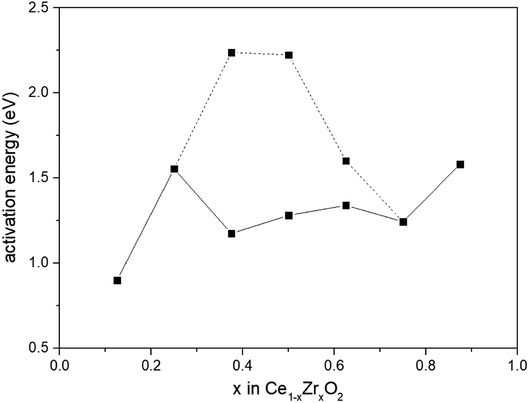 | ||
| Fig. 6 Activation energies for CO oxidation by lattice oxygen on Ce1−xZrxO2 (x = 0.125, 0.250, 0.375, 0.500, 0.625, 0.750, 0.875) (110) surfaces. | ||
Finally, we completed the overall catalytic cycle of CO oxidation on the optimum Ce0.875Zr0.125O2 (110) surface, which focused on the explanation of the gas-phase O2 diffusion through the catalyst instead of oxygen-ion diffusion within the lattice. As shown in Fig. 7, following the first gas-phase CO2 and one OV formation (IM1, Fig. 7) via TS1 (Fig. 7, the same as in Fig. 2), the CO2 desorbed from the surface (IM2, Fig. 7) overcoming 0.480 eV energy. Subsequently, O2 adsorbed on the OV site (IM3, Fig. 7), and then, the second CO molecule bound with the adsorbed O2 to form a coadsorption configuration IM4 (Fig. 7), with the binding energy of −0.819 eV, followed by CO approaching the upper O of the adsorbed O2 to form the second CO2 molecule (IM5, Fig. 7) via TS2 (Fig. 7). The energy barrier for the second CO2 formation was 0.672 eV, dramatically lower than that of the first CO2 formation (0.899 eV). It is obvious that CO oxidation by surface oxygen was the elementary step in the overall catalytic cycle.
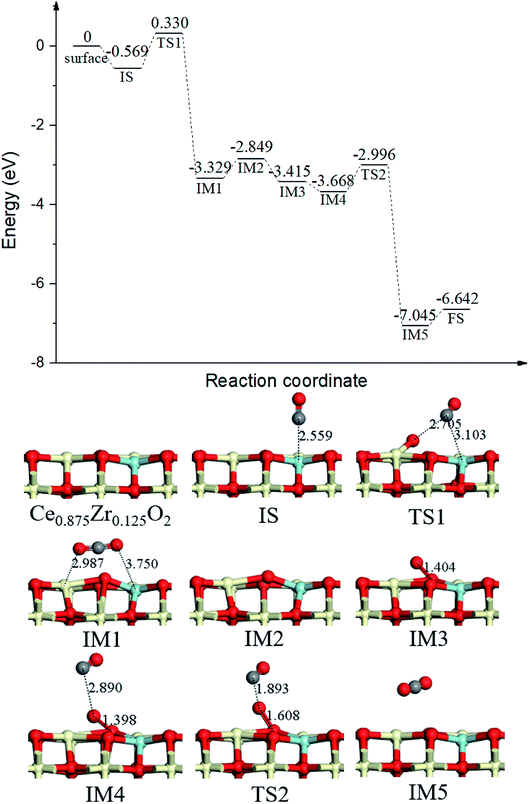 | ||
| Fig. 7 Calculated energy profile and structures of key states for the catalytic cycle of CO oxidation on Ce0.875Zr0.125O2 (110) surface. | ||
5. Conclusions
In the current work, DFT method was performed to investigate the reduction properties of Ce1−xZrxO2 (x = 0.125, 0.250, 0.375, 0.500, 0.625, 0.750, 0.875) (110) surfaces, using CO as a probe for the thermodynamic study. For the details of the reaction mechanism, CO preferred to adsorb on the ZrT site with rather weak binding energies (≈−0.6 eV), thus gas-phase CO directly extracted surface lattice O to form CO2 and surface OV following the Eley–Rideal (ER) mechanism. From the calculated energy barriers, we proposed that Ce0.875Zr0.125O2 was the optimum composition to efficiently release surface lattice O. In addition, the occurrence of surface OV had significant effects on catalytic processes.44,45 Especially, two different types of active O3c (OA and OB) existed on Ce0.625Zr0.375O2, Ce0.500Zr0.500O2 and Ce0.375Zr0.625O2 (110) surface, the CO oxidation activity of OB was significantly higher than that of OA with the energy barriers of 1.175 < 2.239 eV, 1.281 < 2.224 eV and 1.340 < 1.602 eV on Ce0.625Zr0.375O2, Ce0.500Zr0.500O2 and Ce0.375Zr0.625O2 (110) surface, respectively. We explained that the binding strength of active O3c with neighboring cations causes the difference, and since the ionic size increased when Ce4+ changed to Ce3+ and O3c ions coordinated by smaller Zr ions may facilitate the reduction process.Conflicts of interest
There are no conflicts to declare.Acknowledgements
This work is supported by National Natural Science Foundation of China (21607011, 21976109), Key Research and Development Project of Shandong Province (2019GSF109021, 2019GSF109037), Natural Science Foundation of Shandong Province (ZR2018MB043), the Fundamental Research Funds of Shandong University (2018JC027).References
- C. Bozo, F. Gaillard and N. Guilhaume, Appl. Catal., A, 2001, 220, 69–77 CrossRef CAS.
- R. Zhou, X. Zhang, J. Lu, G. Hu and M. Luo, Chem. Res. Chin. Univ., 2015, 31, 288–293 CrossRef CAS.
- A. Trovarelli, F. Zamar, J. Llorca, C. d. Leitenburg, G. Dolcetti and J. T. Kiss, J. Catal., 1997, 169, 490–502 CrossRef CAS.
- M. Sugiura, Catal. Surv. Asia, 2003, 7, 77–87 CrossRef CAS.
- J. Deng, S. Yuan, L. Xiong, S. Li, J. Wang and Y. Chen, Mater. Charact., 2019, 155, 109808 CrossRef.
- Z. Zhang, Y. Fan, Y. Xin, Q. Li, R. Li, J. A. Anderson and Z. Zhang, Environ. Sci. Technol., 2015, 49, 7989–7995 CrossRef CAS PubMed.
- A. Łamacz, K. Matus, B. Liszka, J. Silvestre-Albero, M. Lafjah, T. Dintzer and I. Janowska, Catal. Today, 2018, 301, 172–182 CrossRef.
- J. Liu, X. Shi, Y. Shan, Z. Yan, W. Shan, Y. Yu and H. He, Environ. Sci. Technol., 2018, 52, 11769–11777 CAS.
- P. M. Shah, A. N. Day, T. E. Davies, D. J. Morgan and S. H. Taylor, Appl. Catal., B, 2019, 253, 331–340 CrossRef CAS.
- Y. Madier, C. Descorme, A. M. Le Govic and D. Duprez, J. Phys. Chem. B, 1999, 103, 10999–11006 CrossRef CAS.
- M. Boaro, C. de Leitenburg, G. Dolcetti and A. Trovarelli, J. Catal., 2000, 193, 338–347 CrossRef CAS.
- H. Wang, X. Gong, Y. Guo, Y. Guo, G. Z. Lu and P. Hu, J. Phys. Chem. C, 2009, 113, 10229–10232 CrossRef CAS.
- B. Guo, J. Alloys Compd., 2019, 785, 1121–1125 CrossRef CAS.
- C. E. Hori, H. Permana, K. Y. S. Ng, A. Brenner, K. More, K. M. Rahmoeller and D. Belton, Appl. Catal., B, 1998, 16, 105–117 CrossRef CAS.
- Z. Yang, Z. Fu, Y. Wei and K. Hermansson, Chem. Phys. Lett., 2008, 450, 286–291 CrossRef CAS.
- Z. Yang, Y. Wei, Z. Fu, Z. Lu and K. Hermansson, Surf. Sci., 2008, 602, 1199–1206 CrossRef CAS.
- Z. Yang, T. K. Woo and K. Hermansson, J. Chem. Phys., 2006, 124, 224704 CrossRef PubMed.
- G. Balducci, J. Kašpar, P. Fornasiero, M. Graziani, M. S. Islam and J. D. Gale, J. Phys. Chem. B, 1997, 101, 1750–1753 CrossRef CAS.
- X. Xie, Y. Li, Z.-Q. Liu, M. Haruta and W. Shen, Nature, 2009, 458, 746–749 CrossRef CAS PubMed.
- D. Gerçeker and I. Önal, Appl. Surf. Sci., 2013, 285, 927–936 CrossRef.
- B. Delley, J. Chem. Phys., 1990, 92, 508–517 CrossRef CAS.
- B. Delley, J. Chem. Phys., 2000, 113, 7756–7764 CrossRef CAS.
- J. P. Perdew, K. Burke and M. Ernzerhof, Phys. Rev. Lett., 1996, 77, 3865–3868 CrossRef CAS PubMed.
- A. Bergner, M. Dolg, W. Küchle, H. Stoll and H. Preuß, Mol. Phys., 1993, 80, 1431–1441 CrossRef CAS.
- H. J. Monkhorst and J. D. Pack, Phys. Rev. B: Solid State, 1976, 13, 5188–5192 CrossRef.
- T. A. Halgren and W. N. Lipscomb, Chem. Phys. Lett., 1977, 49, 225–232 CrossRef CAS.
- R. Elber and M. Karplus, Chem. Phys. Lett., 1987, 139, 375–380 CrossRef CAS.
- K. A. Gschneider, L. Eyring and T. A. Roth, J. Electrochem. Soc., 1979, 126, 464C CrossRef.
- C. J. Howard, R. J. Hill and B. E. Reichert, Acta Crystallogr., Sect. B: Struct. Sci., 1988, 44, 116–120 CrossRef.
- H. Wang, Y. Guo, G. Lu and P. Hu, Angew. Chem., Int. Ed., 2009, 48, 8289–8292 CrossRef CAS PubMed.
- G. Balducci, J. Kašpar, P. Fornasiero, M. Graziani and M. S. Islam, J. Phys. Chem. B, 1998, 102, 557–561 CrossRef CAS.
- S. Fabris, S. de Gironcoli, S. Baroni, G. Vicario and G. Balducci, Phys. Rev. B: Condens. Matter Mater. Phys., 2005, 71, 041102 CrossRef.
- M. Fronzi, S. Piccinin, B. Delley, E. Traversa and C. Stampfl, Phys. Chem. Chem. Phys., 2009, 11, 9188–9199 RSC.
- M. Huang and S. Fabris, J. Phys. Chem. C, 2008, 112, 8643–8648 CrossRef CAS.
- F. Chen, D. Liu, J. Zhang, P. Hu, X.-Q. Gong and G. Lu, Phys. Chem. Chem. Phys., 2012, 14, 16573–16580 RSC.
- Z. Wu, M. Li and S. H. Overbury, J. Catal., 2012, 285, 61–73 CrossRef CAS.
- M. Boaro, F. Giordano, S. Recchia, V. D. Santo, M. Giona and A. Trovarelli, Appl. Catal., B, 2004, 52, 225–237 CrossRef CAS.
- P. Mars and D. W. van Krevelen, Chem. Eng. Sci., 1954, 3, 41–59 CrossRef CAS.
- W. Song, Y. Su and E. J. M. Hensen, J. Phys. Chem. C, 2015, 119, 27505–27511 CrossRef CAS.
- X. Cao, C. Zhang, Z. Wang and X. Sun, Int. J. Mol. Sci., 2019, 20, 6129 CrossRef PubMed.
- M. Piumetti, S. Bensaid, D. Fino and N. Russo, Appl. Catal., B, 2016, 197, 35–46 CrossRef CAS.
- J. Kašpar, P. Fornasiero and M. Graziani, Catal. Today, 1999, 50, 285–298 CrossRef.
- J.-P. Cuif, G. Blanchard, O. Touret, M. Marczi and E. Quéméré, 1996.
- Y. Song, L. Yin, J. Zhang, P. Hu, X. Gong and G. Lu, Surf. Sci., 2013, 618, 140–147 CrossRef CAS.
- H. Gao, Appl. Catal., A, 2017, 529, 156–166 CrossRef CAS.
Footnote |
| † Electronic supplementary information (ESI) available. See DOI: 10.1039/c9ra09550k |
| This journal is © The Royal Society of Chemistry 2020 |

