DOI:
10.1039/C9RA09487C
(Paper)
RSC Adv., 2020,
10, 6362-6376
Biochar derived from corn stalk and polyethylene co-pyrolysis: characterization and Pb(II) removal potential
Received
14th November 2019
, Accepted 30th December 2019
First published on 11th February 2020
Abstract
Biochar is widely used as adsorbents for gaseous or liquid pollutants due to its special pore structure. Previous studies have shown that the adsorption performance of untreated biomass pyrolysis crude carbon is poor, which can be improved by optimizing physicochemical properties such as pore structure and surface area. The study focused on the co-pyrolysis of skins, pith, and leaves with polyethylene and potassium hydroxide modification to adjust the quality of the biochar, compared with raw materials of corn stalks without separation. The physical and chemical properties of the biochar were analyzed and the adsorption effect, adsorption isotherms, and kinetics of Pb(II) removal were investigated. Results demonstrated that co-pyrolysis of biomass and polyethylene increase the yield of biochar with an average increase of about 20%. Polyethylene brought high aromaticity, high calorific value and stable material structure to biochar. Potassium hydroxide modification increased its specific surface area and made the pore structure of biochar more uniform, mainly microporous structure. The specific surface areas of the four modified biochar were 521.07 m2 g−1, 581.85 m2 g−1, 304.99 m2 g−1, and 429.97 m2 g−1. The adsorption capacity of biochar for Pb(II) was greatly improved with the increase of the OH functional group of biochar. The stem-pith biochar had the best adsorption effect, with an adsorption amount of 99.95 mg g−1 and a removal efficiency of 50.35%. The Pseudo-second-order model and Langmuir adsorption isotherm model could preferably describe the adsorption process, indicating the adsorption of lead was monolayer accompanied by chemical adsorption. It can be concluded that co-pyrolysis of biomass and polyethylene and modification may be favorable to enhance the properties of biochar. In addition to syngas and bio-oil from co-pyrolysis, biochar may be a valuable by-product for commercial use, which can be used to remove heavy metals in water, especially stem-pith biochar.
1. Introduction
Heavy metals which have a wide range of sources, especially in water exist in the environment universally and hazardous to human health. Adsorption is a low-cost, relatively simple method for removing heavy metals from water, which has been widely used in wastewater treatment plants. Porous solid materials and biosorbents such as activated carbon, silica gel, molecular sieve, activated alumina biofilms, algae and so on as adsorbents are used to remove heavy metals in water.1–4 The low-cost biofilm adsorbents show the great removal of Cr(II) in aqueous solution, with –NH3 and –OH groups dominating.5 However, biofilms have strict temperature requirements. Too high or too low temperatures will affect the activity of biofilms, which are not conducive to the adsorption effect. The coupling agents are used to change the end groups on the surface of the silica gel to –NH2, –Cl, –SH, and then the chelating groups containing N, S, O, such as thiourea,6 thiothiazoline,7 3-aminopropyl triethoxysilane8 are grafted by the end groups to improve the adsorption of silica gel on mercury, lead, nickel, and cadmium. But the silica gel requires acidic conditions for adsorption, which has limitations in the practical application of water treatment. The activated carbon is considered to be an excellent adsorbent material due to its stable physical structures, large specific surface areas, its acid, alkali, heat resistance as well as more oxygen-containing active groups.9 At present, coal and petroleum coke are the main raw materials for the preparation of activated carbon, which not only consume a large amount of non-renewable resources, but also a great quantity of pollutants released during the preparation process. In recent years, biochar, a solid product obtained from clean and environmentally friendly biomass raw materials by thermochemical conversion under anoxic conditions has been actively used as high-efficiency adsorbents for eliminating organic and inorganic pollutants.10 By comparison with traditional fossil carbon adsorbents, biochar can improve the adsorption efficiency of heavy metals in water such as Pb2+, Cu2+, Cr2+, which has developed into a new low-cost carbon material because of its large specific surface area, unique porosity and rich functional groups on pores.11–13 Studies have shown that the biochar prepared by pyrolysis of plant biomass can be loaded with manganese oxide to obtain a manganese oxide/biochar composite, and the adsorption capacity of lead(II) is five times than that before modification.14 After being treated with potassium permanganate, the biochar prepared from pecan has more oxygen-containing functional groups and larger specific surface area, which shows excellent adsorption effect on Pb(II), Cu(II), and Cd(II).15 The peanut shell hydrothermal carbon has a significantly improved adsorption capacity on lead compared with that before modification, with an adsorption capacity of 22.82 mg g−1, which is equivalent to commercial activated carbon and more than 20 times of that of unmodified hydrogen carbon (0.88 mg g−1).16 Therefore, biochar has developed into a new type of low-cost adsorption material.
There are some unpyrolysis products on the surface of biochar. The direct application of biochar in heavy metal adsorption may have a certain impact on water quality, and the adsorption performance of biochar directly prepared is poor. In order to obtain biochar with superior adsorption performance, scholars are committed to exploring the effects of types of raw materials, source conditioning, pyrolysis temperature and modification conditions on the physical and chemical properties of biochar.17,18 The biochar activation is a chemical modification method to prepare high-quality carbon, which is mainly based on the following methods: oxidant activation, metal ion activation, activation of inorganic nanomaterials and acid–base activation.19–22 By increasing the specific surface area, microporous structure and oxygen-containing functional groups, especially phenol hydroxyl and carboxyl, the adsorption active sites and adsorption capacity of heavy metals in water can be improved.23 The source conditioning is to prepare biochar by high-temperature pyrolysis after pretreatment of raw materials by physical or chemical methods, such as the proportion of cellulose, hemicellulose, and lignin adjusted by the mixture of different biomass, the deoxidization group after baking pretreatment and so on.24–27 Nowadays, the problems of plastic waste in China is getting worse. Plastic waste, especially thermoplastics, accounts for a large proportion of municipal solid waste, and polyethylene is one of them. Polyethylene, abbreviated as PE, is a thermoplastic resin obtained by polymerizing ethylene. It has good chemical stability, acid, alkali corrosion resistance, and excellent insulation.28 At present, scholars have studied the effects of biomass and polyethylene co-pyrolysis on the bio-oil and volatile gas. The positive and synergistic interactions occur during co-pyrolysis of biomass and polyethylene, promoting the conversion of biomass and polyethylene. The yield of biomass pyrolysis is affected by the ratio of polyethylene and biomass. With the ratio of polyethylene increasing, the oil yield of the mixture increases.29 In the co-pyrolysis process of rice straw and polyethylene, the addition of polyethylene can reduce the content of oxygenated compounds in volatile substances and increase the yield of H2 and hydrocarbons. The effect of the interaction between rice straw and polyethylene on the evolution of volatile substances is affected by the proportion of rice straw.30 However, the physicochemical properties of the produced biochar by co-pyrolysis of biomass and polyethylene have not been paid attention to.
Based on the above analyses, the main factors affecting the physical and chemical characteristics of biochar are raw material characteristics, pyrolysis temperature, and modification method. The different parts of the corn stalks, such as the skins, pith, and leaves have a different amount of cellulose, hemicellulose, and lignin. In addition, the physical structures of different parts are very different, such as biological structure, chemical composition, and fiber morphology. In this study, the skins, pith, and leaves separated from corn stalks were used as raw materials, and the quality of biochar was adjusted by analyzing the components of different parts compared with the mixed raw materials of corn stalks. Combining source conditioning and chemical modification methods effectively, polyethylene blended with biomass was used to prepare biochar, and then modified by potassium hydroxide. The influence of these methods on the physical and chemical properties of biochar was explored. In this study, the proportion of biomass and polyethylene mixed to pyrolyze was optimized. The adsorption conditions such as adsorption time and initial concentration of lead solutions were investigated, and their adsorption isotherms and adsorption kinetics were evaluated. The aim is to find the best biochar to deal with the heavy metal in water, so as to make rational use of various components of corn stalks.
2. Materials and methods
2.1 Preparation of materials
The biomass materials used in this experiment were stem-skins (SS), stem-pith (SP) and stem-leaves (SL) separated from corn stalks and corn stalks (CS) mixtures. They were taken from the suburbs near Shenbei New District, Shenyang City, Liaoning Province. Polyethylene is a kind of high-density polyethylene powder, abbreviated as PE. Firstly, the corn stalks were separated into stem-skins, stem-pith and stem-leaves, which were crushed by a pulverizer. The stem-skins, stem-pith and stem-leaves powders which meet the conditions were sieved through a 60 mesh sieve, and dried at 105 °C for 24 h to reduce their moisture and obtained the required experimental materials in an oven.
2.2 Preparation of biochar
The schematic draw of the experimental set-up used for pyrolysis is shown in Fig. 1. The stem-skins, stem-pith, stem-leaves, and corn stalks materials and the mixture of polyethylene and them were respectively placed in a perforated quartz boat and placed in the quartz tube of the right half of the self-designed slide tube furnace. The tube furnace was pre-passed with nitrogen for 30 minutes to discharge residual air. Then, the tube furnace was slid to the left half as shown in Fig. 1, and the switch was started to raise the temperature. When the temperature was raised to the optimum reaction condition (reaction temperature of 600 °C, residence time of 30 min) determined by pre-experiment, the tube furnace was slid to the place where the materials were put to have a rapid pyrolysis reaction, and the materials were carbonized. After the reaction was finished (residence time of 30 min), the biochar was cooled and taken out, and the weight was recorded. The biochar produced from stem-skins, stem-pith, stem-leaves, and corn stalks was recorded as SS1, SP1, SL1, and CS1. The biochar produced by co-pyrolysis of corn stalks and polyethylene with the best mass ratio was recorded as SS2, SP2, SL2, and CS2. The biochar yield is calculated by formula (eqn (1)), and the calorific value of biochar (eqn (2)) is calculated according to DIN 51900, as follows:| | |
Yieldbiochar = Mbiochar/Mcs × 100%
| (1) |
| | |
HHV = [(34 × C) + (124.3 × H) + (6.3 × N) + (19.3 × S) − (9.8 × O)]/100
| (2) |
where Mcs is the dry basis quality of the raw materials, Mbiochar is the quality of the biochar, HHV is the calorific value, MJ kg−1.
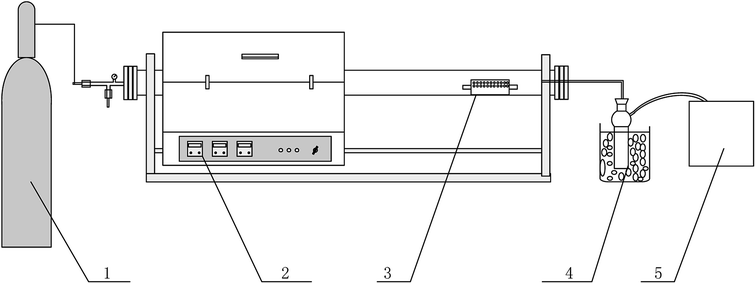 |
| | Fig. 1 Schematic draw of the experimental set-up used for pyrolysis. (1) Nitrogen (2) slide tube furnace (3) perforated quartz boat (4) pyrolysis oil collection (5) gas bag. | |
2.3 Method of biochar modification
The reagents used in the experiment were all analytically pure. KOH solution, deionized water, and HCl solution were purchased from Shenyang Branch of Sinopharm Group. The KOH solution and the biochar were thoroughly mixed at a mass ratio of 1![[thin space (1/6-em)]](https://www.rsc.org/images/entities/char_2009.gif) :1 and immersed at atmospheric temperature for 11 h. The biochar sufficiently impregnated with the KOH activator was separated by filtration, and the obtained biochar precursor was placed in a nitrogen tube atmosphere in a slide tube furnace to repeat the rapid pyrolysis experiment. The cooled biochar was rinsed with HCl solution and deionized water until neutral. And then the biochar was separated and dried at 105 °C for 12 h and cooled to room temperature to obtain activated biochar. The biochar after activation was recorded as SS3, SP3, SL3, and CS3.
:1 and immersed at atmospheric temperature for 11 h. The biochar sufficiently impregnated with the KOH activator was separated by filtration, and the obtained biochar precursor was placed in a nitrogen tube atmosphere in a slide tube furnace to repeat the rapid pyrolysis experiment. The cooled biochar was rinsed with HCl solution and deionized water until neutral. And then the biochar was separated and dried at 105 °C for 12 h and cooled to room temperature to obtain activated biochar. The biochar after activation was recorded as SS3, SP3, SL3, and CS3.
2.4 Method of adsorption experiments
The reagents used in the experiment were excellent grade pure. Pb(II) standard solution and HNO3 solution were purchased from Shenyang Branch of Sinopharm Group. The Pb(II) solution having a concentration of 50–800 mg L−1 was prepared, and the pH of the solution was adjusted to 4.5. The centrifugal tubes were filled with 0.1 g biochar and 50 ml Pb(II) solution and placed in a constant temperature shaker to shake for 5–720 min at 25 °C, 150 rpm. The supernatant was separated by static filtration, and the obtained biochar was dried at 105 °C for 2 h to cool down. The biochar after adsorption of Pb(II) was recorded as SS4, SP4 and SL4.
The formulas of adsorbed capacity qe (eqn (3)) and adsorbed efficiency η (eqn (4)) are as follows:
| | |
η = (C0 − Ce)/C0 × 100%
| (4) |
where
qe is the adsorbed capacity, that is the concentration of Pb(
II) solution on the solid phase at the equilibrium of adsorption, mg g
−1,
C0 is the initial concentration, mg L
−1,
Ce is the concentration of Pb(
II) solution on the aqueous phase at the equilibrium of adsorption, mg L
−1,
V is the volume of the solid–liquid two-phase system, L,
m is the mass of the adsorbent, g,
η is the adsorbed efficiency, %.
The adsorption kinetics of biochar was simulated by pseudo-first-order (eqn (5)), pseudo-second-order (eqn (6)) and Weber–Morris (eqn (7)) models:
| | |
ln(qe − qt) = lnqe − K1t
| (5) |
| | |
t/qt = t/qe + 1/K2qe2
| (6) |
where
qt is the amount of Pb(
II) adsorbed at a time, mg g
−1,
K1 and
K2 are respectively first-order and second-order apparent adsorption rate constants, min
−1, g mg
−1 min
−1,
Kp is intraparticle diffusion rate constant, mg g
−1 t
−1/2,
C is intercept of
Y-axis.
The isothermal adsorption data of biochar were fitted by Langmuir (eqn (8)) and Freundlich (eqn (9)) models. The isotherm models are as follows:
| | |
qe = qmaxKLCe/(1 + KLCe)
| (8) |
where
qmax is maximum adsorption capacity, mg g
−1,
KL is Langmuir constant, L mg
−1,
KF is Freundlich constant, mg g
−1,
n is an empirical parameter of change.
2.5 Characterizations
The proximate analysis was measured by a fully automatic industrial analyzer (Changsha Kaiyuan Instrument Co. Ltd 5E-MAG6600B), and ultimate analysis was measured by an elemental analyzer (Euro Vector, EA300, Italy). The functional groups of biochar were measured by Fourier transform infrared spectroscopy (ATR-FTIR, Thermo Fisher Scientific, Nicolet Scientific 50, USA). The detection wavelength was 4000–500 cm−1, and the resolution was 4 cm−1. The background measurement was performed before the test to remove the background influence. The specific surface areas were measured by a specific surface area and a pore size analyzer (Gold-Spiral Technology V-Sorb 2800). The experiment was tested by nitrogen adsorption–desorption methods. The test used BET formula, t-plot formula and BJH formula to obtain the specific surface areas, pore volumes and pore sizes. The microstructures were measured by an electron microscope (SEM-EDS, S4800) with a magnification of 25–1000000 times. The crystal structures were measured by X-ray diffractometer (XRD, X'Pert PRO MPD) using a Cu target with the incident wavelength of 0.154056 nm, the scanning range of 10–80°, and the rate of 5° min−1. The concentrations of the solution after adsorption were measured by ICP (Optima PE8300, USA), and the concentrations of Pb(II) was determined by the National Environmental Protection Department of the Soil Environmental Quality Standard, 1995, Chapter 5, Section 2, ICP-AES. The potentials before and after adsorption of biochar were measured by a Zeta potential analyzer (Zetasizer nano). The experiment was carried out under neutral conditions, and the dispersant was deionized water.
3. Results and discussion
3.1 Characterization of biochar
Biomass is mainly composed of cellulose, hemicellulose, and lignin. Cellulose is a high molecular weight linear polymer consisting of hundreds to thousands of β(1→4) linked D-glucose units. Unlike the chemical composition of cellulose, hemicellulose is a polymer of various monosaccharides, such as glucose, mannose, galactose and so on. Lignin is a three-dimensional cross-linked macromolecular substance composed of various substituted phenylpropane units. The chemical compositions of stem-skins, stem-pith and stem-leaves derived from the corn stalks are obviously different, and the characteristics of raw materials are shown in Table 1. It could be seen that cellulose was the main component in the biomass of the straw, and the cellulose content of stem-skins accounted for the largest proportion, reaching 49.77%, which was about half of the total chemical compositions, and higher than stem-pith and stem-leaves. The hemicellulose content of stem-leaves was much higher than that of stem-skins and stem-pith, reaching 40.41%. Lignin is the main raw material for the preparation of biochar by biomass pyrolysis. The higher the content of lignin, the greater the conversion rate of biochar is. The ash content of biomass also determines the biochar yield. According to the analysis of Table 1 and Fig. 2, the lignin and ash contents of stem-skins were both the largest, reaching 8.69% and 5.96 wt%, so the biochar yield was correspondingly the largest.
Table 1 Proximate analysis and ultimate analysis of raw materialsa
| Raw materials |
|
SS |
SP |
SL |
CS |
Polyethylene |
| ad is air dried basis; FC and O are obtained by subtraction. |
| Proximate analysis/wt% |
Mad |
3.39 |
3.65 |
3.42 |
3.41 |
0.05 |
| Aad |
5.96 |
2.8 |
5.24 |
5.87 |
0.01 |
| Vad |
79.96 |
91.37 |
81.45 |
80.77 |
99.94 |
| FC |
10.69 |
2.18 |
9.90 |
11.95 |
0 |
| Ultimate analysis/wt% |
C |
45.31 |
45.67 |
44.48 |
43.34 |
85.44 |
| H |
5.83 |
6.20 |
6.08 |
6.12 |
13.49 |
| O |
38.55 |
40.45 |
39.80 |
48.42 |
1.02 |
| N |
0.97 |
1.23 |
0.98 |
2.12 |
0.06 |
| Cellulose% |
|
49.77 |
43.65 |
38.49 |
38.40 |
|
| Hemicellulose% |
|
25.52 |
21.47 |
40.41 |
35.73 |
|
| Lignin% |
|
8.69 |
4.90 |
6.06 |
5.78 |
|
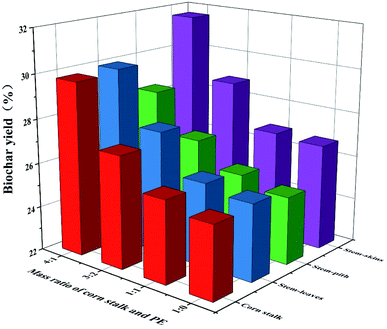 |
| | Fig. 2 Yield of biochar. | |
The yield of biochar was increased after the addition of polyethylene (Fig. 2). However, the more polyethylene was added, the lower the yield of biochar was. As we could see the polyethylene had the highest carbon content, accounting for 85 wt% in Table 1. The hydrogen content was second, about 13 wt%, and most of it was volatile. The yield and quality of products were improved due to that polyethylene could provide hydrogen during the co-pyrolysis process. The biomass with poor thermal stability decomposes and generates free radicals, and the polyethylene with rich hydrocarbons provides a rich source of hydrogen for the free radicals generated by biomass decomposition and promotes free radical polymerization in the free process to form further coke.31 The carbonization yield of stem-skins was higher than that of stem-pith, stem-leaves and corn stalks. Considering the overall yield, the mass ratio of biomass and polyethylene was 4:1 to prepare biochar (SS2, SP2, SL2, and CS2) for further research.
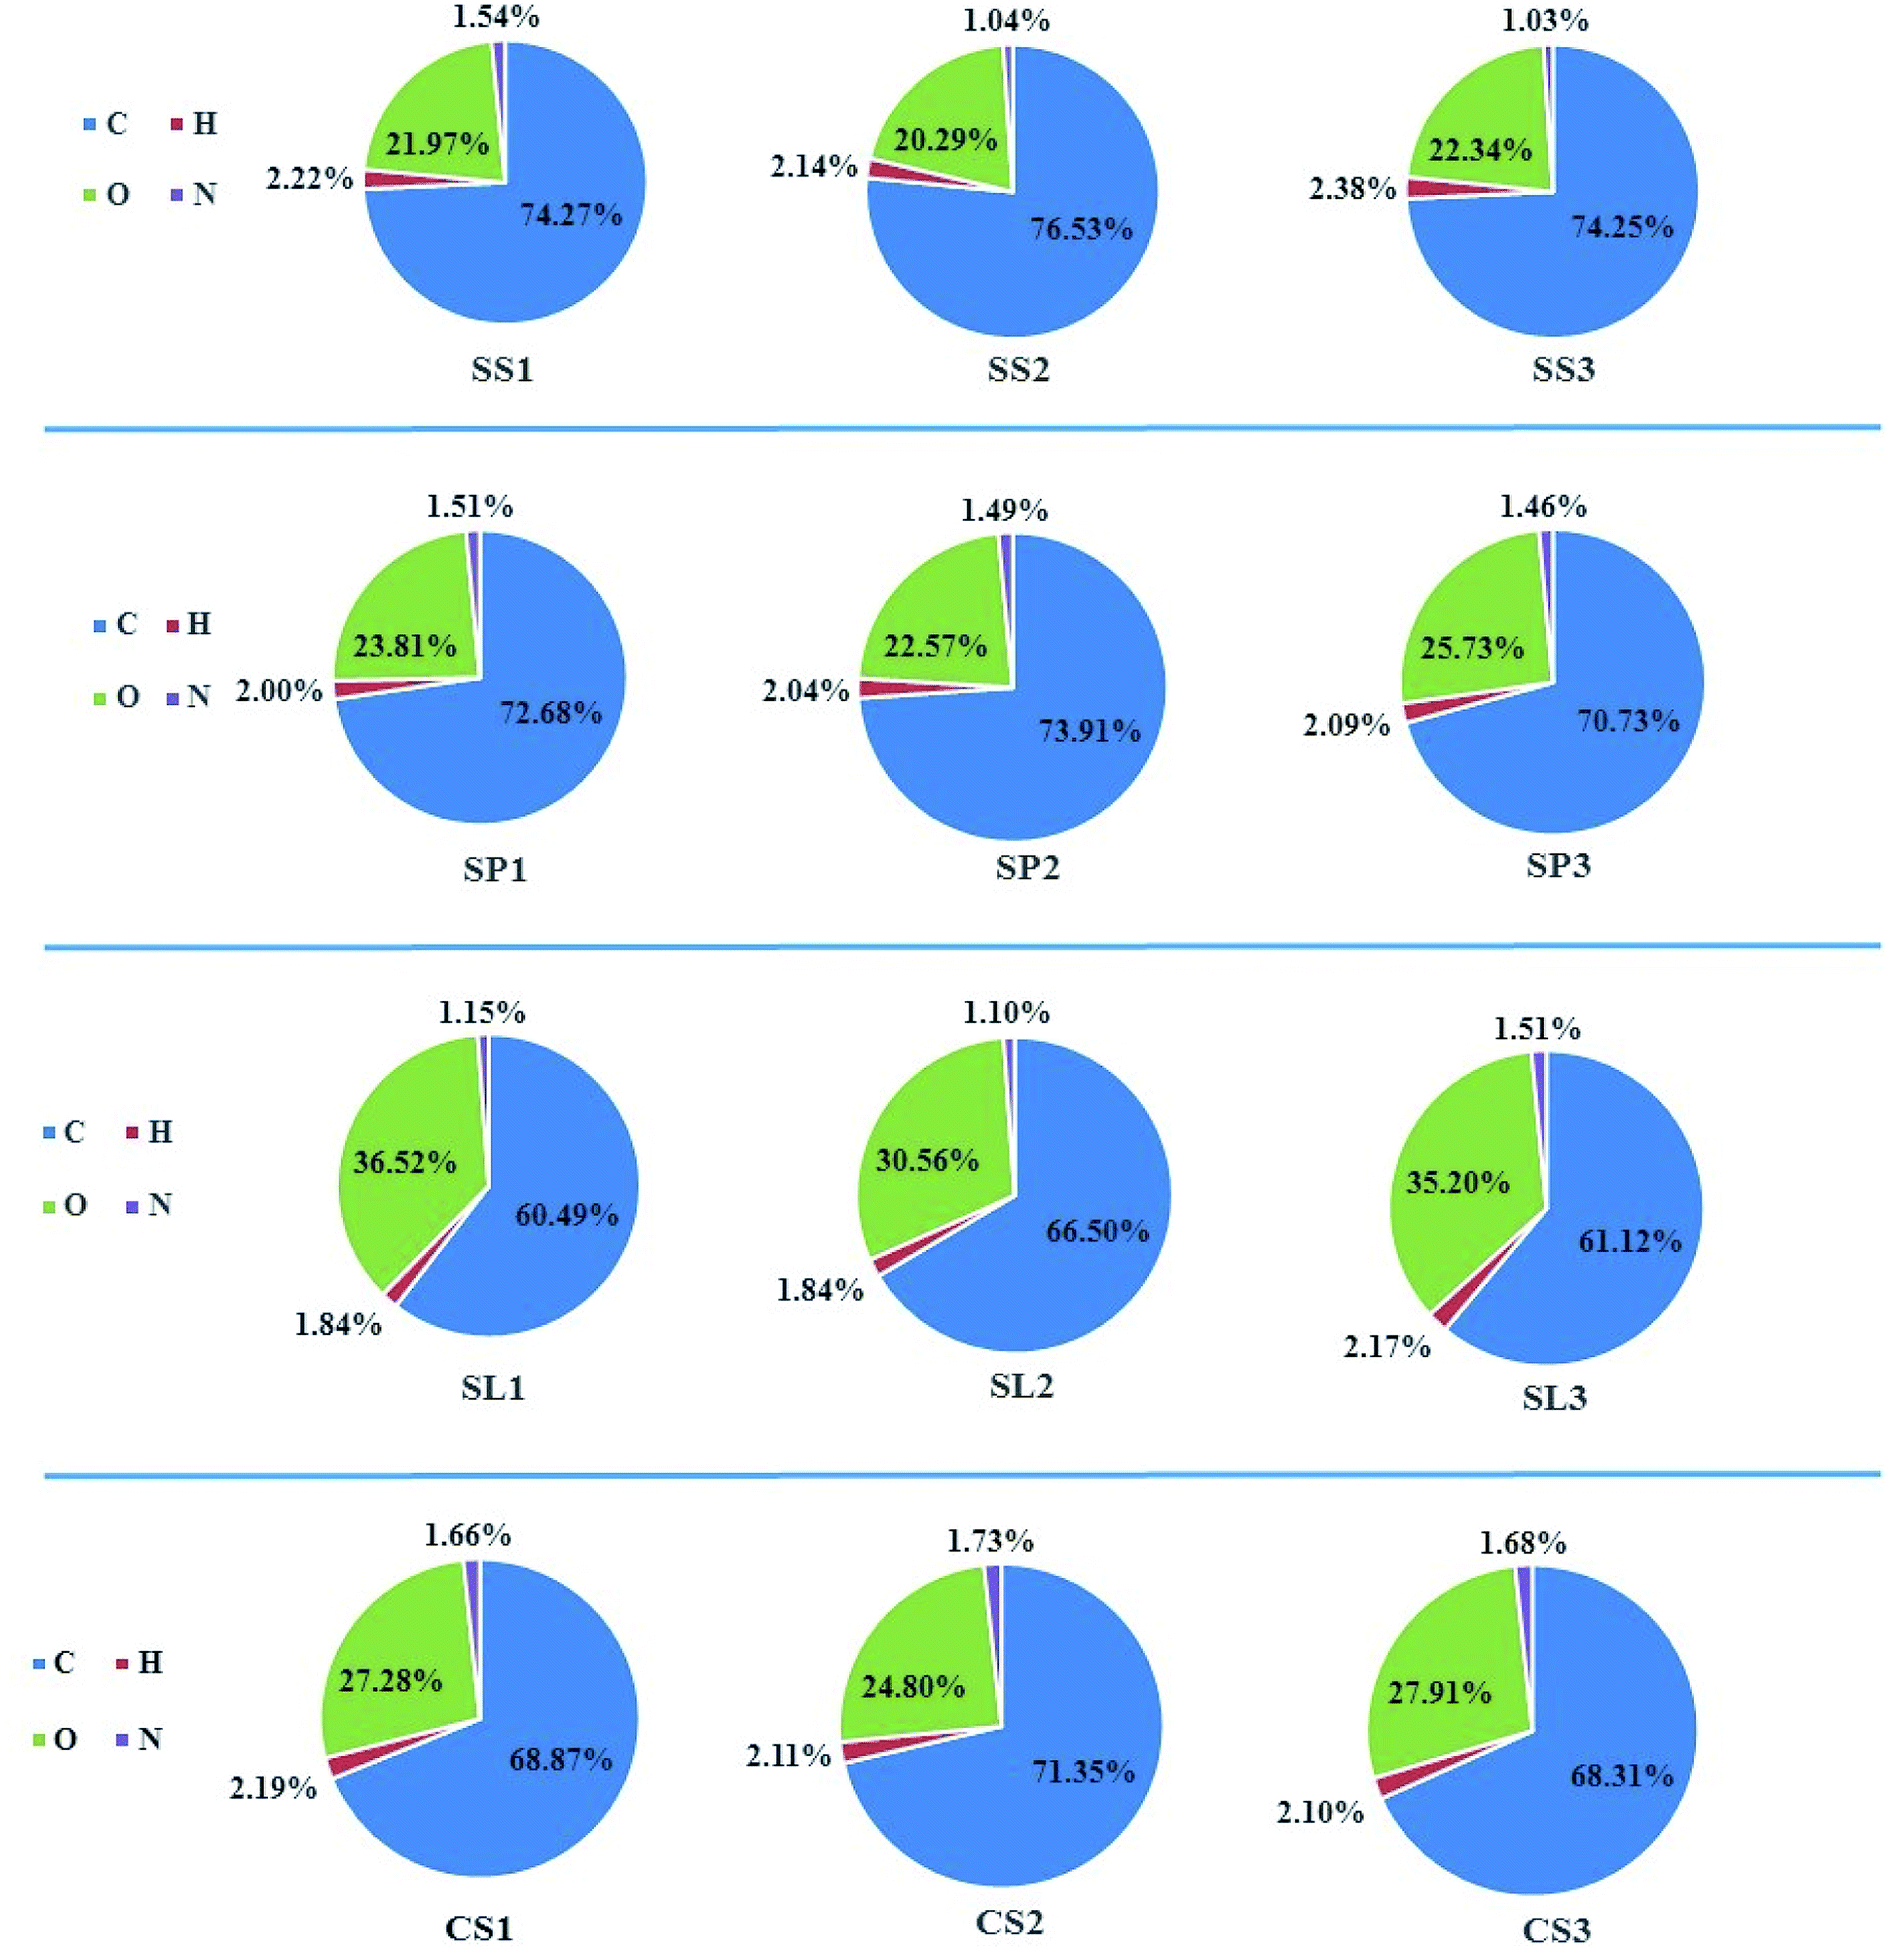
The ultimate analysis and pH of the biochar are shown in Table 2 and Fig. 3. It could be concluded that the content of C was the highest, accounting for 60–77 wt% of the total specific gravity, followed by O. The contents of N and H were relatively low. During the co-pyrolysis of biomass and polyethylene, the gases generated by pyrolysis were mainly CO2, CO, CH4 and some other light hydrocarbons (C2H4, C2H6 and n-C4H10) because of the simple structure (–CH2–) of polyethylene. At the same time, H2 was produced by reacting between C and H2O at high temperatures. Therefore, the content of H and O decreased after adding polyethylene. After potassium hydroxide activation, the oxygen content of biochar increased by an average of 3 wt%, which was due to potassium hydroxide treatment could oxidize the surfaces of biochar and increase oxygen-containing functional groups. The changes of O/C was consistent with the content of O. The doping of polyethylene made H/C decrease, which indicated that the structure of biochar was more stable, the aromaticity was enhanced. Strong aromaticity made the biochar easy to be oxidized, which was beneficial to the improvement of adsorption effect. (N + O)/C represented the polarity of the materials. The greater the ratio was, the stronger the polarity were, which indicated that the dissociation of H ions was gradually easier. Co-pyrolysis of biomass and plastics has been discussed to be effective techniques to upgrade the quality of products (such as polyethylene, polypropylene, and polystyrene), which not only improves the yield but also increases the calorific value of its products. As could be seen from Table 2, the calorific values of SS2, SP2, SL2, and CS2 had higher calorific values than SS1, SP1, SL1, and CS1. Because synthetic plastics are typically organic polymers with high hydrogen, high carbon. They can provide high calorific values comparable to conventional fossil fuels (diesel and gasoline).32 The pH of biochar has major impacts on its environmental applications. The differences in the pH of biochar can make differences in the migration of different heavy metal ions. The corn stalks biochar prepared by pyrolysis was alkaline, which was consistent with the experimental results of X. Liu.33 After adding polyethylene, the alkalinity slightly reduced, and the pH values of stem-skins, stem-leaves, and corn stalks biochar were greater than those of stem-pith biochar.
Table 2 Composition and properties of different corn stalks biochar
| |
H/C |
O/C |
(N + O)/C |
HHV (MJ kg−1) |
pH |
| SS1 |
0.3587 |
0.2219 |
0.2396 |
25.95 |
9.53 |
| SS2 |
0.3356 |
0.1988 |
0.2105 |
26.76 |
9.43 |
| SS3 |
0.3846 |
0.2257 |
0.2375 |
26.07 |
6.70 |
| SP1 |
0.3302 |
0.2457 |
0.2635 |
24.96 |
9.50 |
| SP2 |
0.3312 |
0.2290 |
0.2463 |
25.54 |
9.40 |
| SP3 |
0.3546 |
0.2728 |
0.2905 |
24.21 |
6.60 |
| SL1 |
0.3650 |
0.4528 |
0.4691 |
19.34 |
9.78 |
| SL2 |
0.3320 |
0.3447 |
0.3588 |
21.98 |
9.42 |
| SL3 |
0.4260 |
0.4319 |
0.4531 |
20.12 |
6.76 |
| CS1 |
0.3814 |
0.2970 |
0.3177 |
23.44 |
9.74 |
| CS2 |
0.3557 |
0.2607 |
0.2815 |
24.57 |
9.51 |
| CS3 |
0.3694 |
0.3064 |
0.3275 |
28.77 |
6.00 |
 |
| | Fig. 3 Ultimate analysis of different corn stalks biochar. | |
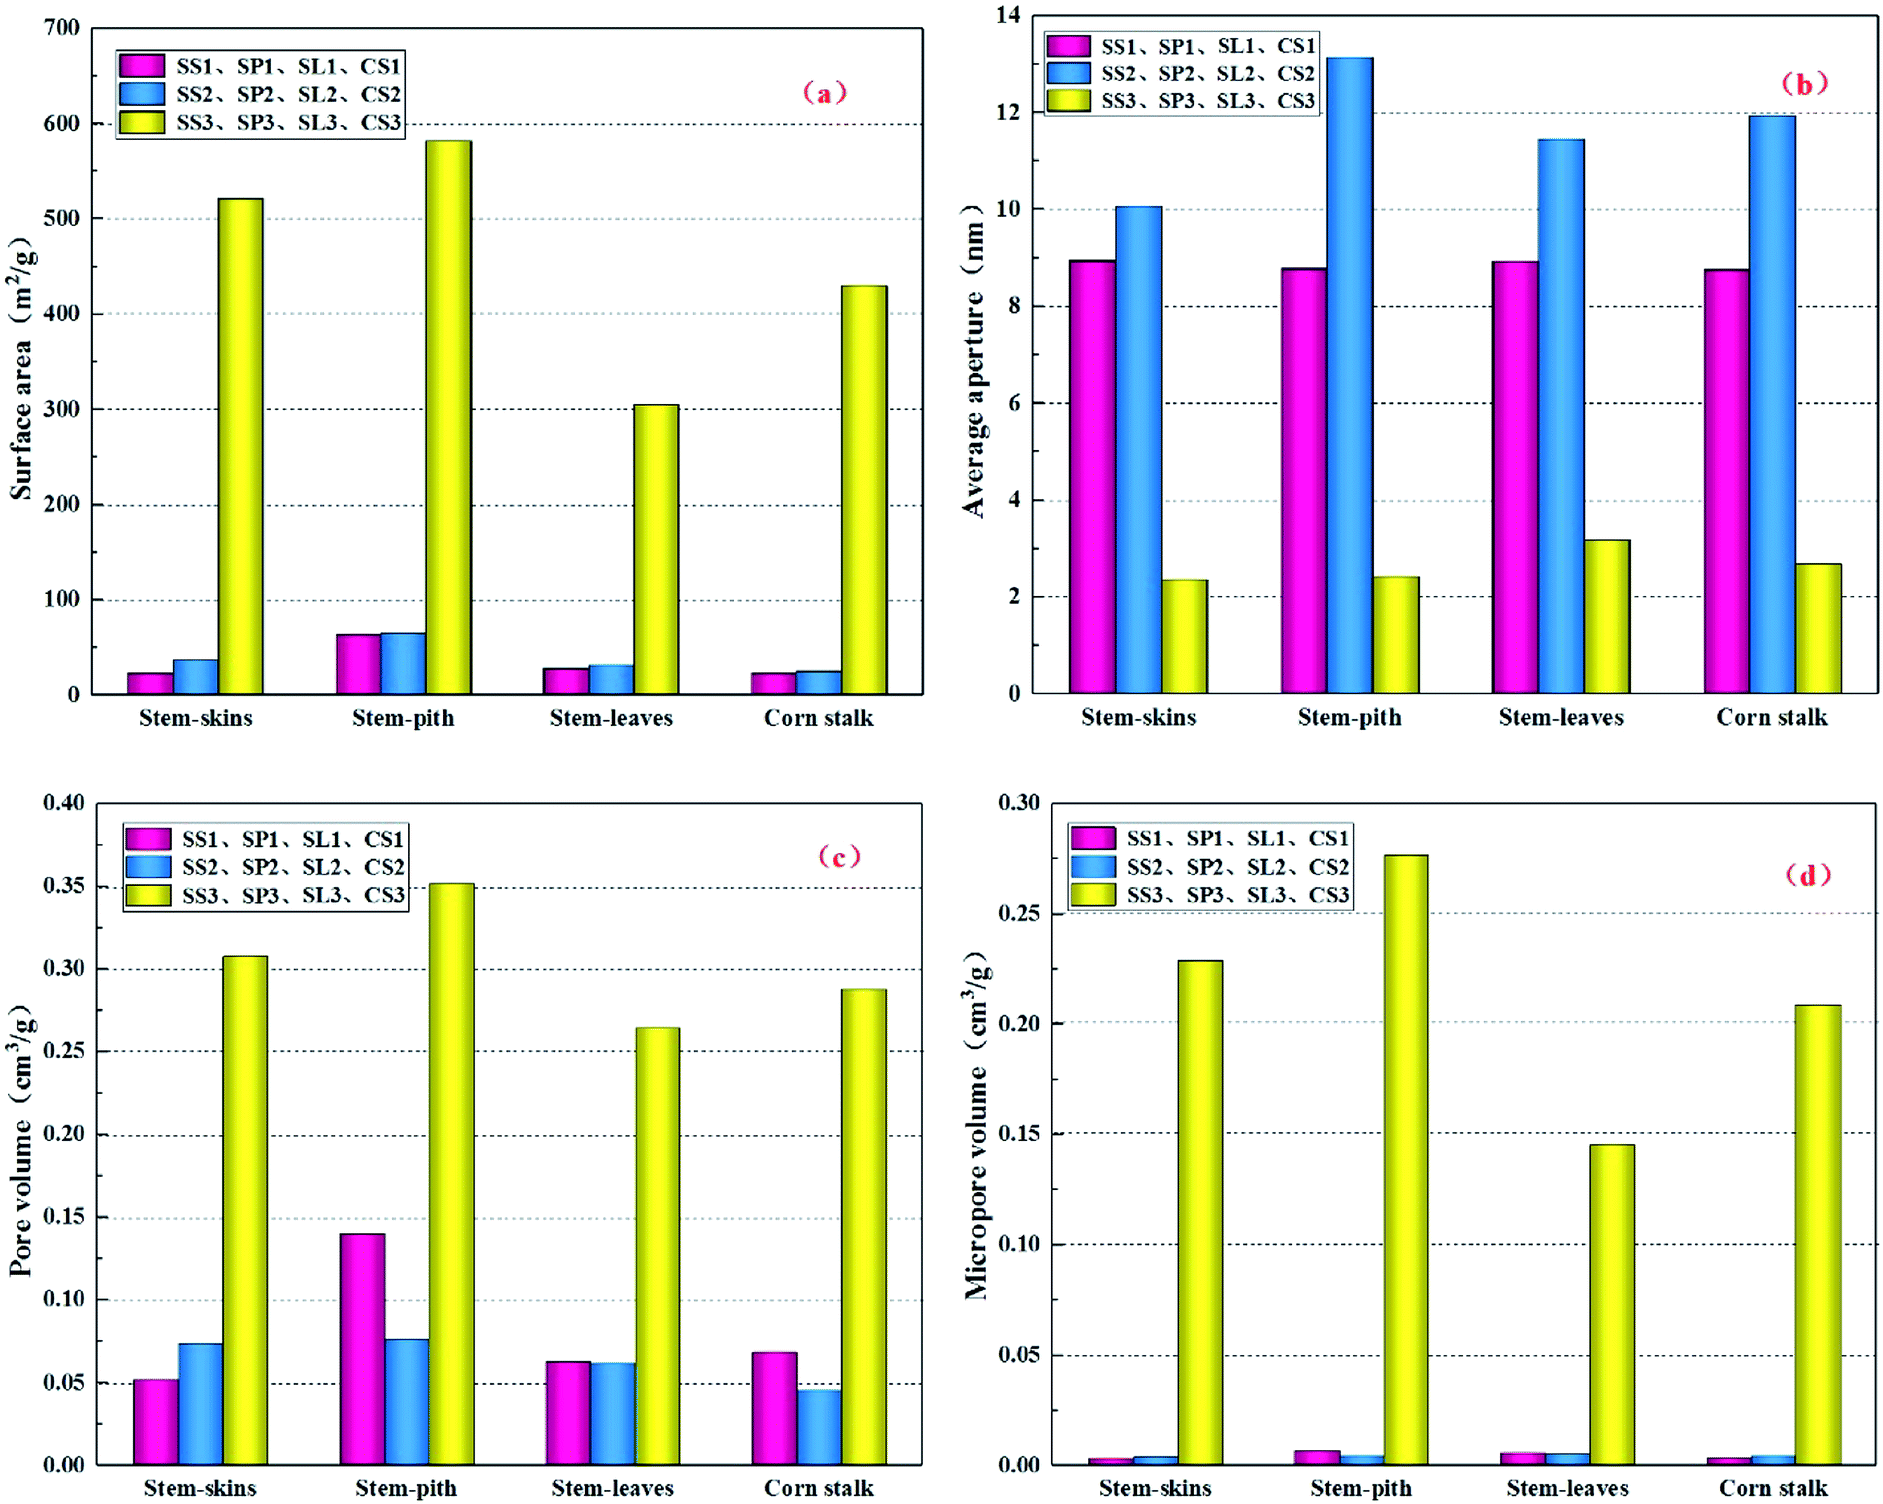
The specific surface areas of SS2, SP2, SL2, and CS2 were higher than those of SS1, SP1, SL1, and CS1 (Fig. 4(a)), but the changes were not obvious. After modification, the specific surface areas of SS3, SP3, SL3, and CS3 significantly increased, which could be due to the changes in the pore distribution. Polyethylene mixed with carbon powders and ceramic powders can be used as a pore-forming additive for the filter materials to bond or form pores. With the increase of pyrolysis temperature, the pyrolysis of polyethylene occurred during the firing process, which endowed the generated biochar with pore structure. After modification by potassium hydroxide, the specific surface areas of stem-skins, stem-pith, stem-leaves and corn stalks biochar all increased more than ten times (23.16 m2 g−1 to 521.07 m2 g−1, 63.74 m2 g−1 to 581.85 m2 g−1, 28.09 m2 g−1 to 304.99 m2 g−1 and 22.94 m2 g−1 to 429.97 m2 g−1). The average pore size (Fig. 4(b)) greatly reduced and the microporous (Fig. 4(d)) size reduced. Similar results were acquired by P. Regmi34 et al., who discovered the switchgrass biochar prepared by alkali solution treatment could improve its porosity and remove blocked pores. In general, denser porous structures were formed on the surface due to the removal of organic matter or ash from surface or small-sized pores.
 |
| | Fig. 4 Structural properties (surface area (a), pore diameter (b), pore volume (c), micropore volume (d)) of different corn stalks biochar. | |
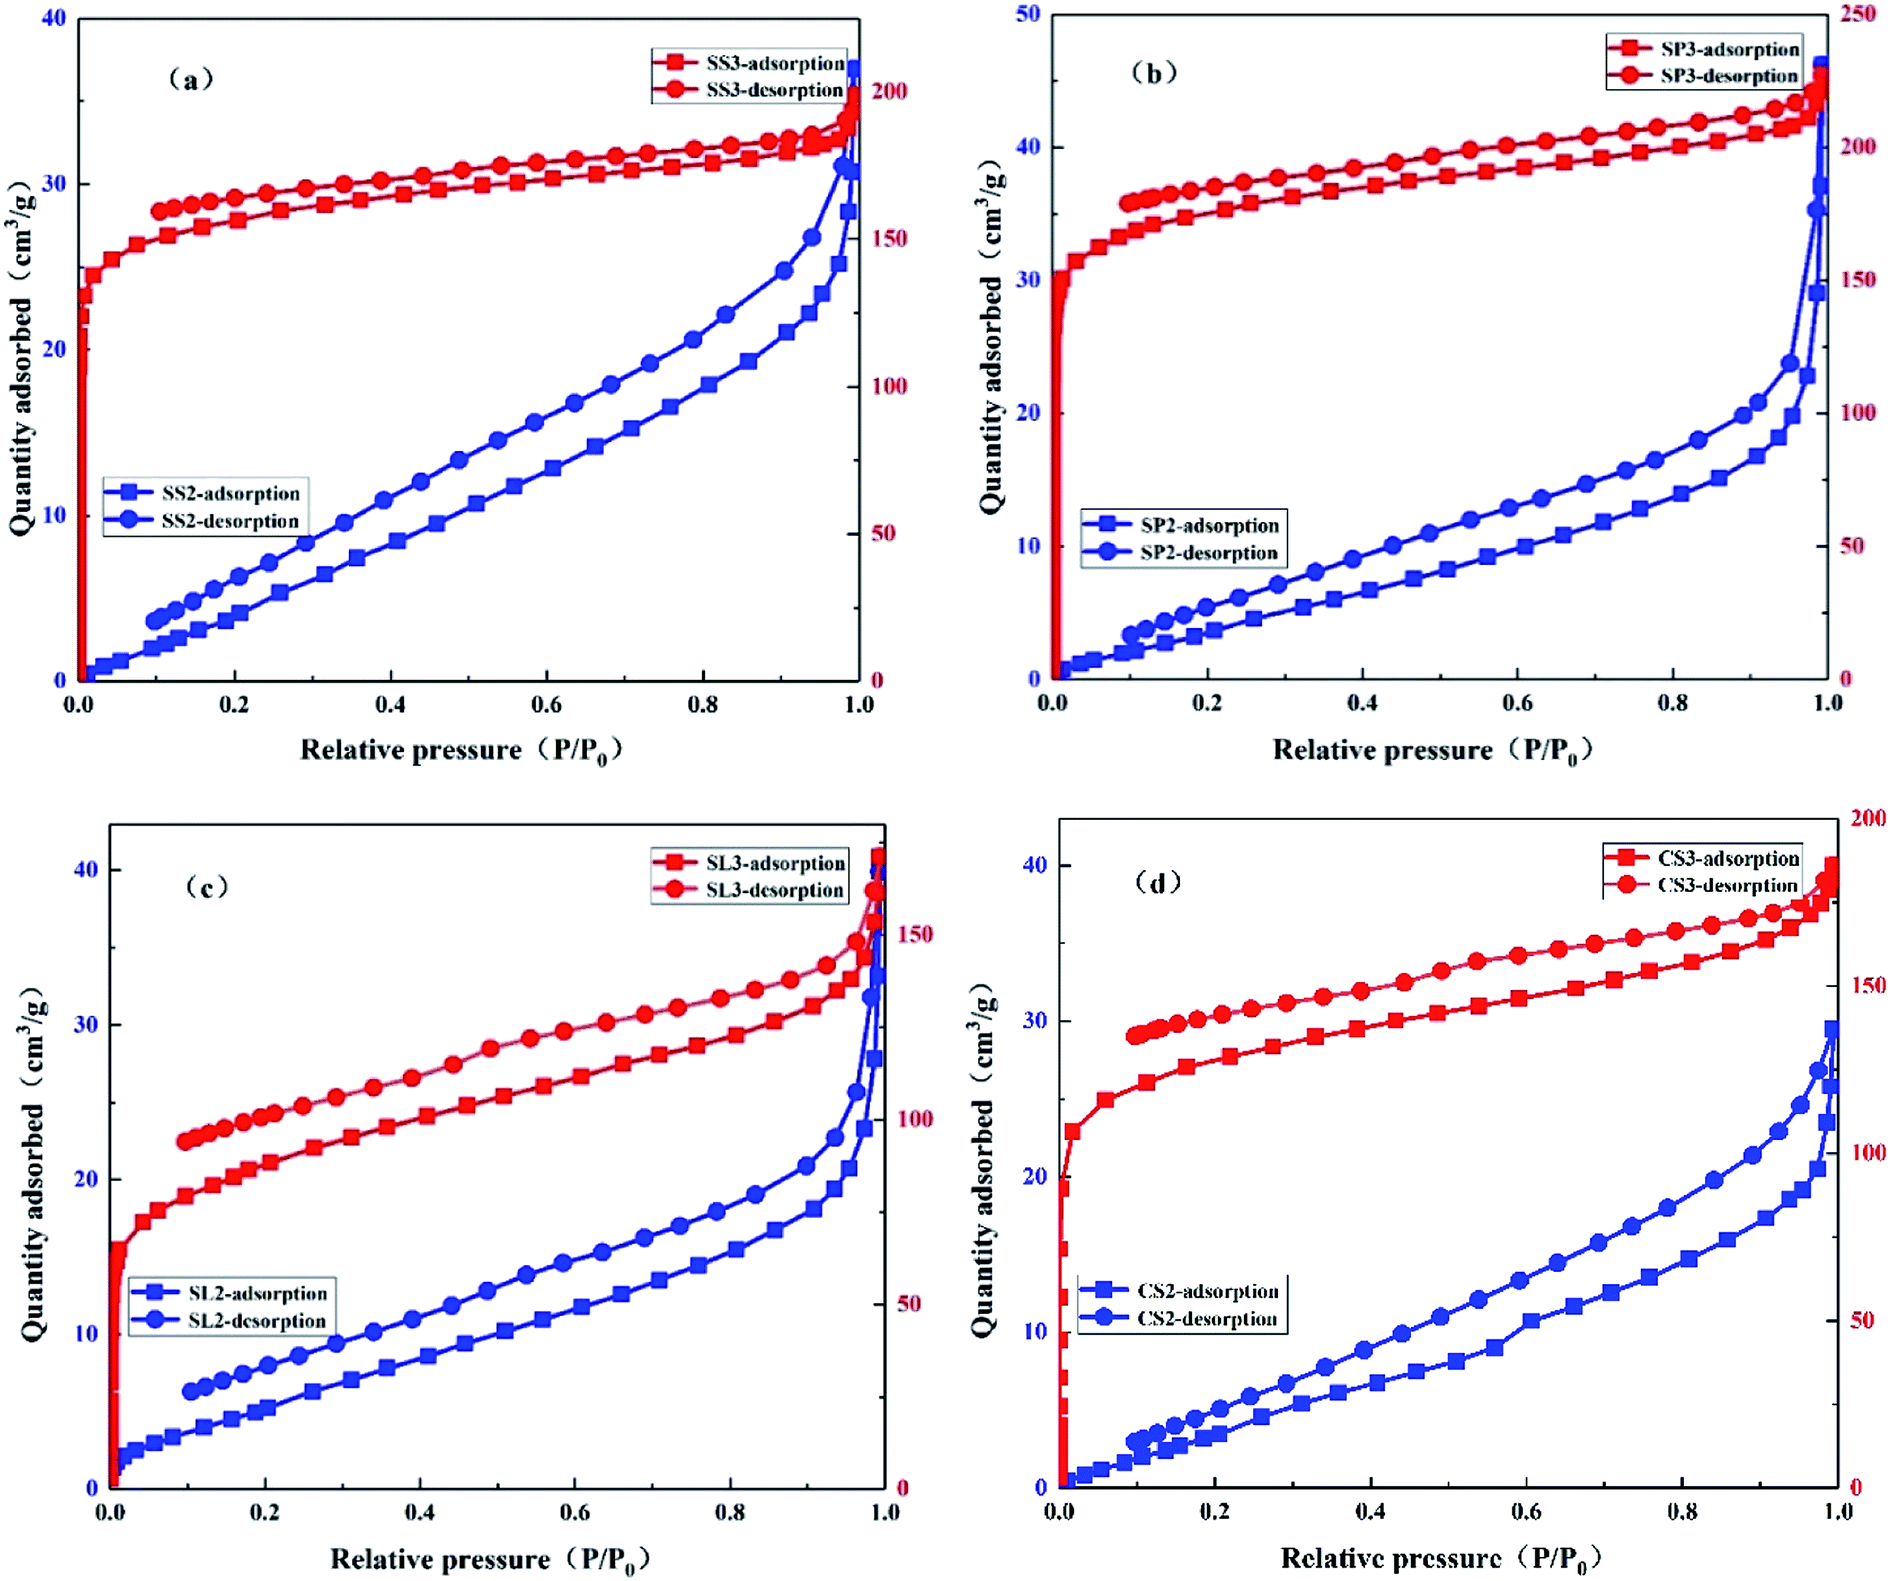
The N2 adsorption–desorption isotherms of SS2, SP2, SL2, CS2, SS3, SP3, SL3, and CS3 are shown in Fig. 5. It could be seen that SS2, SP2, SL2, and CS2 met the type III isotherm of the six gas adsorption isotherms. In the low-pressure zone, the amount of adsorption was small. The relative pressure was higher, and the amount of adsorption was greater, showing pores filling. The N2 adsorption–desorption isotherm of SS3, SP3, SL3, and CS3 conformed to type I isotherm. Type I isotherm was generally considered to be markers of microporous due to strong adsorption. However, the type I isotherm may also be mesoporous materials with pore sizes closing to that of the micropores.35 When closed to the saturated vapor pressure, the adsorption reaction was similar to that of macropores due to the existence of gaps between the particles, and the isotherm raised rapidly. According to comprehensive analysis, the pore structures of biochar became micropores by modification. Both pore volumes and micropore volumes had been expanded to varying degrees. It can be obtained that the potassium hydroxide modification has a strong promoting effect on the pore volume of the biochar and the formation of the micropores.
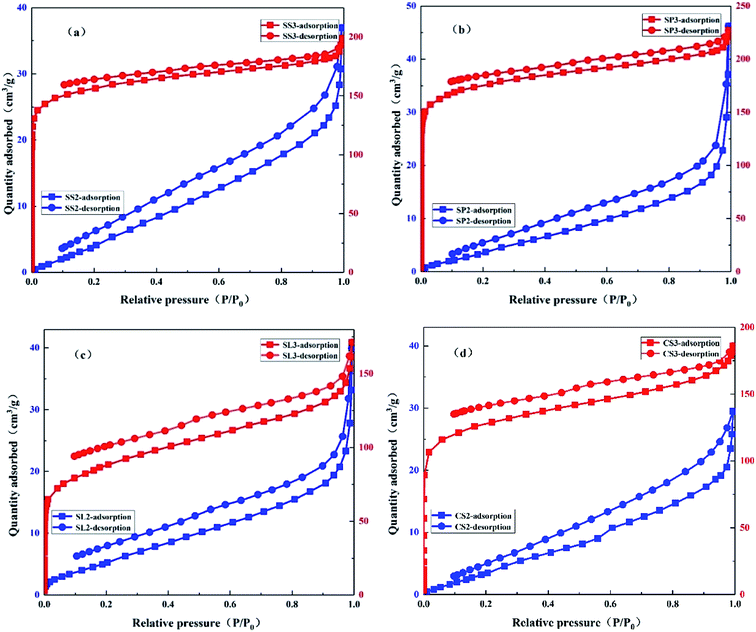 |
| | Fig. 5 N2 adsorption–desorption isotherm of stem-skins biochar (a), stem-pith biochar (b), stem-leaves biochar (c) and corn stalks biochar (d) before and after KOH modification. | |
The FT-IR spectras (Fig. 6) of biochar revealed broad bands between 4000 cm−1 and 3600 cm−1 arising from stretching vibration of the O–H bond between molecules. The stretching vibration of the C–H bond of the alkane ranged from 2900 cm−1 to 2600 cm−1. A small peak appeared at 2400–2250 cm−1 with the deepening of biochar dehydrogenation polymerization, and the acetylene C![[triple bond, length as m-dash]](https://www.rsc.org/images/entities/char_e002.gif) C bond developed stretching vibration. After potassium hydroxide modification, the C–H bond reacted with potassium hydroxide to form C–OH, and the stretching vibration peaks of saturated carbon C–H and unsaturated carbon CC bond gradually weakened, indicating that alkali activation gradually dehydrogenated saturated carbon and unsaturated carbon to crosslink to form macromolecules large molecules. Biochar was more neat and orderly. The bond between 2200 cm−1 and 1900 cm−1 was carboxylic acid C
C bond developed stretching vibration. After potassium hydroxide modification, the C–H bond reacted with potassium hydroxide to form C–OH, and the stretching vibration peaks of saturated carbon C–H and unsaturated carbon CC bond gradually weakened, indicating that alkali activation gradually dehydrogenated saturated carbon and unsaturated carbon to crosslink to form macromolecules large molecules. Biochar was more neat and orderly. The bond between 2200 cm−1 and 1900 cm−1 was carboxylic acid C![[double bond, length as m-dash]](https://www.rsc.org/images/entities/char_e001.gif) O bond stretching vibration, and the strength was gradually weakened due to the action of a strong base. The stretching vibration of the CC bond was expressed at 1569 cm−1, and the strength of the CC bond of the biochar activated by potassium hydroxide was significantly enhanced, which represented an increase in aromatic hydrocarbons. The absorption peaks between 1300 cm−1 and 1000 cm−1 mainly represented fatty ethers, alcohols, and phenols. The absorption peak at 1100 cm−1 belonged to the out-of-plane bending of O–H, and the absorption peak intensity was remarkably enhanced after the addition of potassium hydroxide. It indicated that alcohol and phenolic compounds were mainly produced by the addition of strong alkali because the oxygen-containing functional groups on the surface of the carbonaceous precursors could serve as active sites after the activation of potassium hydroxide.36 Phenolic hydroxyl and carboxyl groups are the main participants in metal adsorption, which implies that biochar activated by potassium hydroxide will effectively adsorb heavy metals in water.
O bond stretching vibration, and the strength was gradually weakened due to the action of a strong base. The stretching vibration of the CC bond was expressed at 1569 cm−1, and the strength of the CC bond of the biochar activated by potassium hydroxide was significantly enhanced, which represented an increase in aromatic hydrocarbons. The absorption peaks between 1300 cm−1 and 1000 cm−1 mainly represented fatty ethers, alcohols, and phenols. The absorption peak at 1100 cm−1 belonged to the out-of-plane bending of O–H, and the absorption peak intensity was remarkably enhanced after the addition of potassium hydroxide. It indicated that alcohol and phenolic compounds were mainly produced by the addition of strong alkali because the oxygen-containing functional groups on the surface of the carbonaceous precursors could serve as active sites after the activation of potassium hydroxide.36 Phenolic hydroxyl and carboxyl groups are the main participants in metal adsorption, which implies that biochar activated by potassium hydroxide will effectively adsorb heavy metals in water.
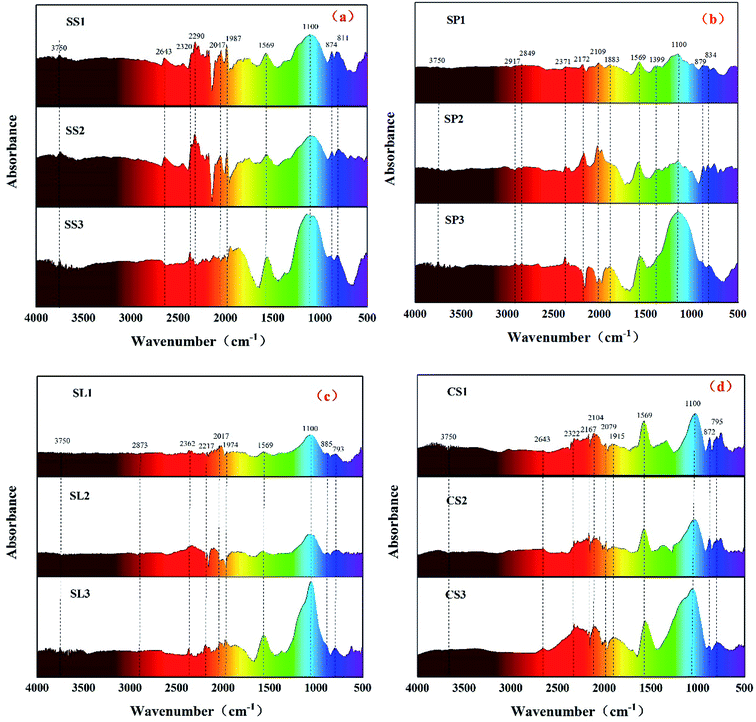 |
| | Fig. 6 FT-IR spectrums of stem-skins biochar (a), stem-pith biochar (b), stem-leaves biochar (c) and corn stalk biochar (d). | |
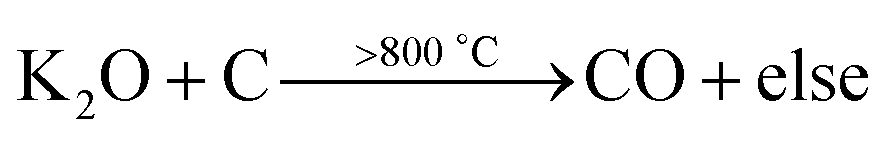
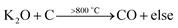
The surface area also gives an indication of the extent of porosity as highly porous structures, especially microporous structures, high surface areas.37 The SEM images (Fig. 7(a1–d1)) showed the surface of SS1, SP1, SL1 and CS1 had distinct tubular structures and a small amount of pore-like structures. After the addition of polyethylene to co-pyrolyze, as shown in Fig. 7(a2–d2), combined with the analysis of specific surface areas, the pore structures of SS2, SP2, SL2 and CS2 slightly increased. Some pores and scattered small particles appeared, and the surface of which non-uniformly distributed. After potassium hydroxide modification, it could be obtained that the pore structures of SS3, SP3, SL3 and CS3 obviously increased and the pores were evenly distributed. Potassium hydroxide was decomposed to form K2O and water vapor. K2O and carbon produced CO, and water vapor and carbon produced CO2. The two gases diffused inside the carbon to form pore structures. At the same time, potassium reached the boiling point and diffused in the form of potassium vapor (eqn (10)–(13)). Therefore, the potassium hydroxide modification can greatly increase the pore structures of the biochar.
| | |
C + H2O↑ → CO2↑ + else
| (11) |
| |
 | (13) |
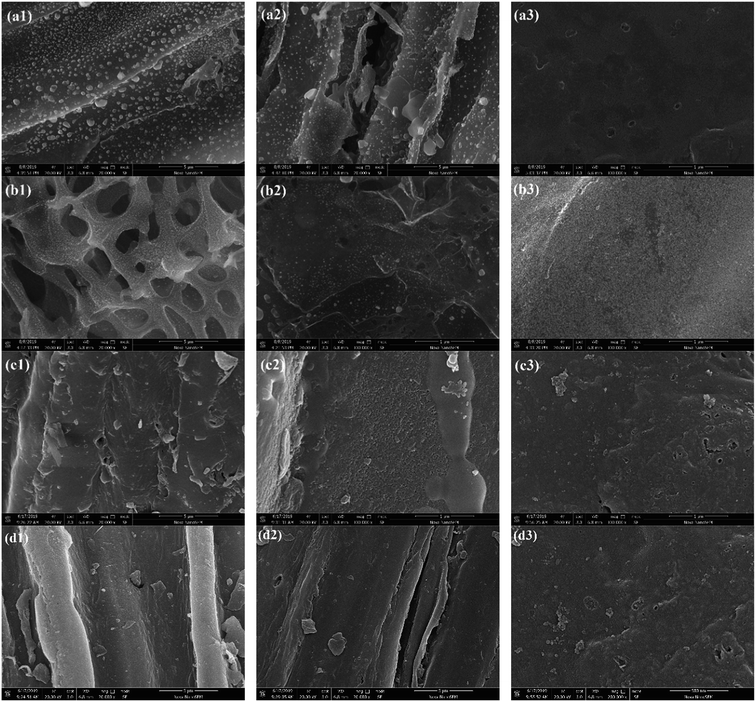 |
| | Fig. 7 SEM spectrums of SS1 (a1), SP1 (b1), SL1 (c1), CS1 (d1), SS2 (a2), SP2 (b2), SL2 (c2), CS2 (d2), SS3 (a3), SP3 (b3), SL3 (c3) and CS3 (d3). | |
3.2 Adsorption properties of biochar
The results of adsorption properties are shown in Fig. 8. After co-pyrolysis by corn stalks and polyethylene, the adsorbed capacity qe and adsorbed efficiency η increased slightly. After potassium hydroxide modification, the adsorbed capacity and adsorbed efficiency reached the maximum, which increased by 30% than before. The stem-pith biochar had the best-adsorbed effect of the four kinds of biochar. The adsorbed capacity qe reached 99.95 mg g−1 and the adsorbed efficiency η reached 50.35%, which corresponded to the previous specific surface areas and pore volume analysis. X. J. Lee38 et al. illuminated that the maximum adsorption capacity of biochar prepared by palm oil sludge for lead was about 29.35 mg g−1. Y. Zhang39 et al. used graphene oxide to load biochar, and the optimal adsorption capacity for lead was 26.10 mg g−1, which was less than the adsorption capacity of lead by stem-pith biochar in this study. It could be obtained that the biochar produced by co-pyrolysis of doped polyethylene affected the adsorption of Pb(II) to a small extent. The biochar after activation by strong alkali greatly enhanced the adsorption of heavy metals. Thence, the biochar with potassium hydroxide modification is an effective method for removing toxic heavy metals in water.
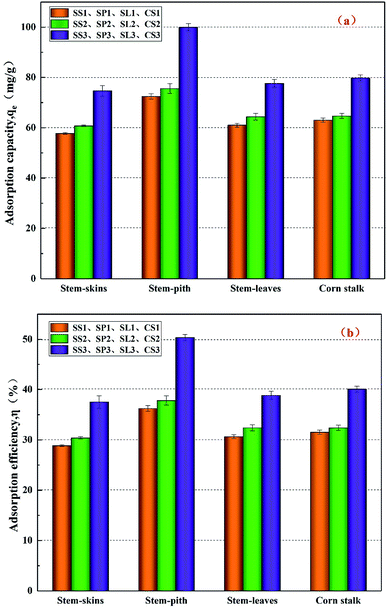 |
| | Fig. 8 Adsorbed capacity (a) and adsorbed efficiency (b) on Pb(II) of different corn stalks biochar. | |
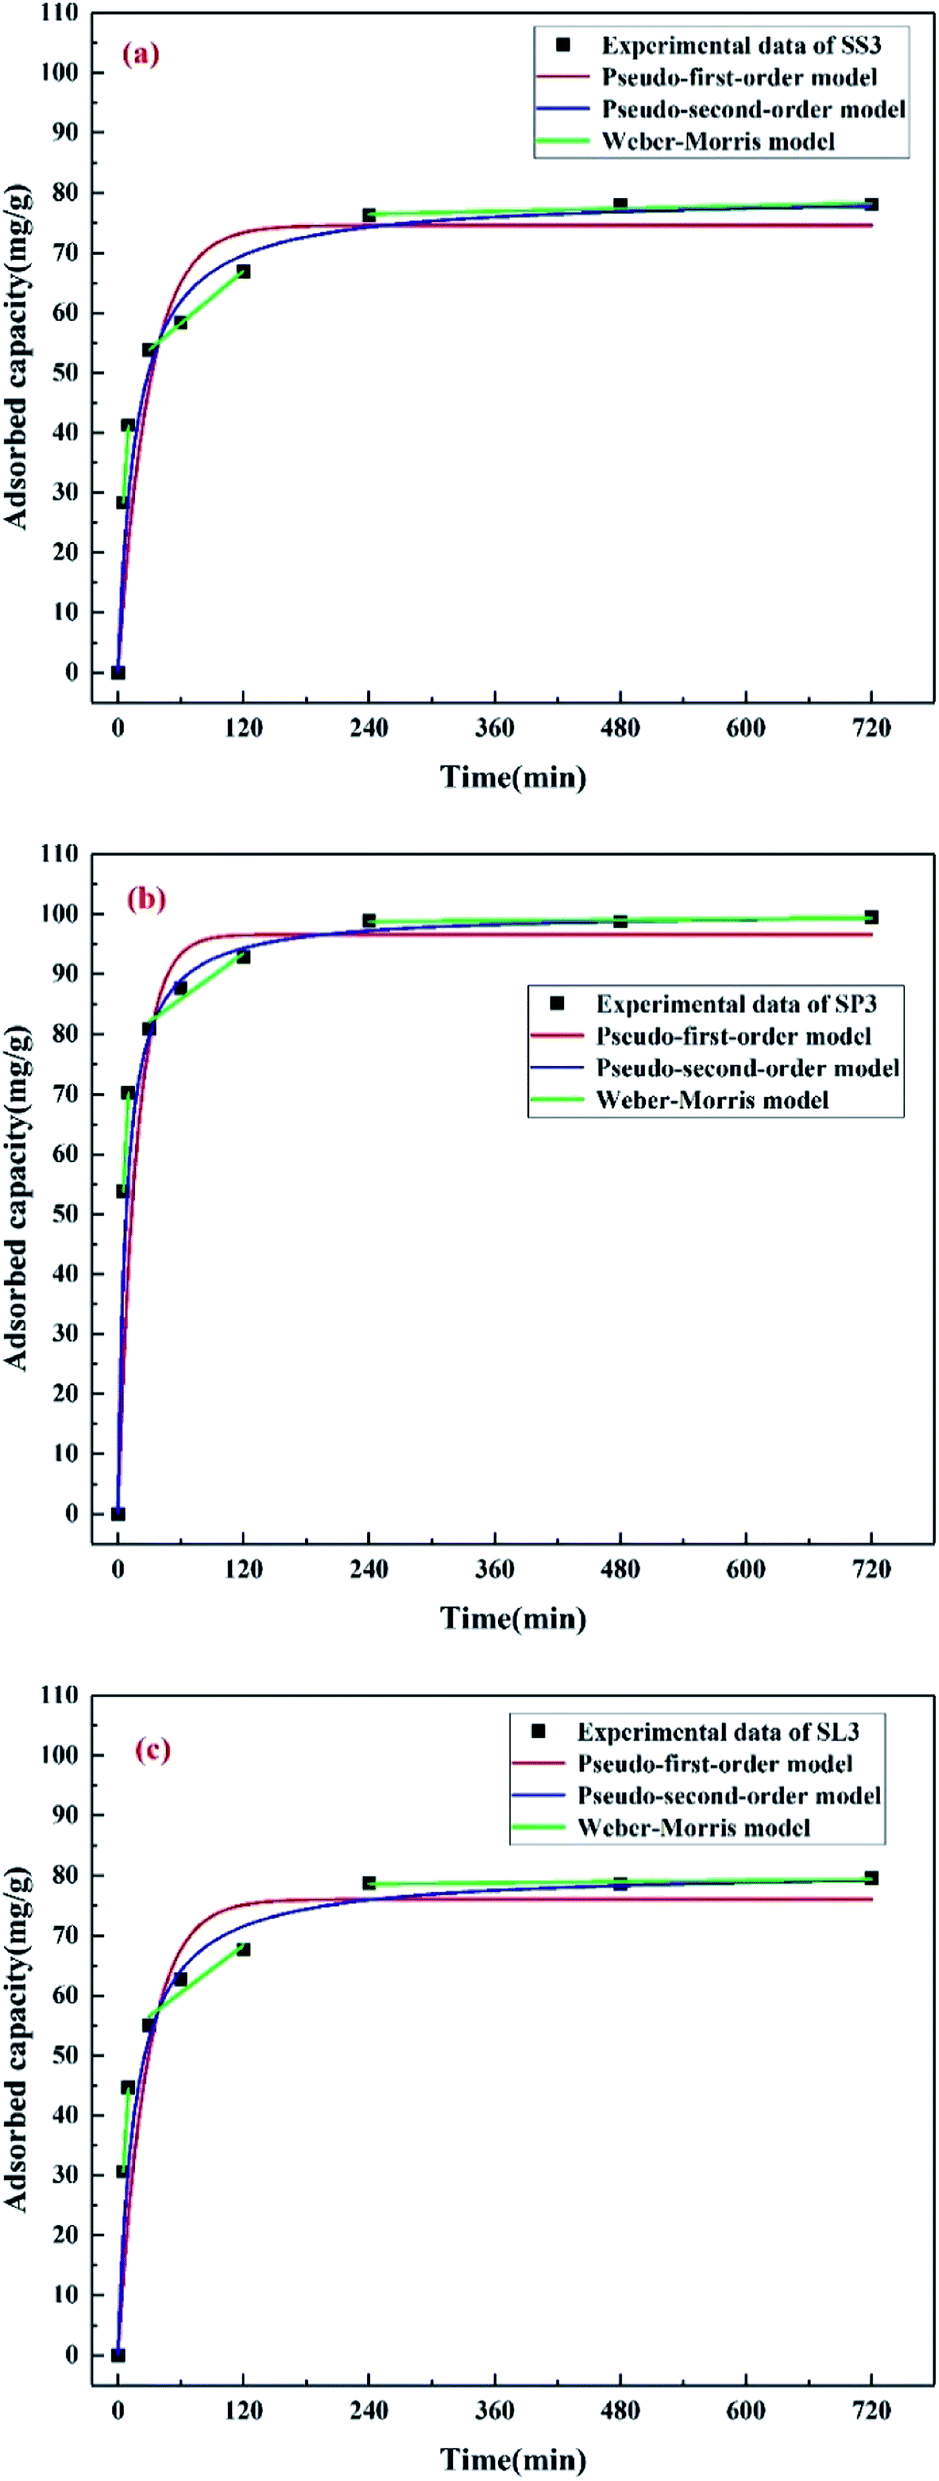
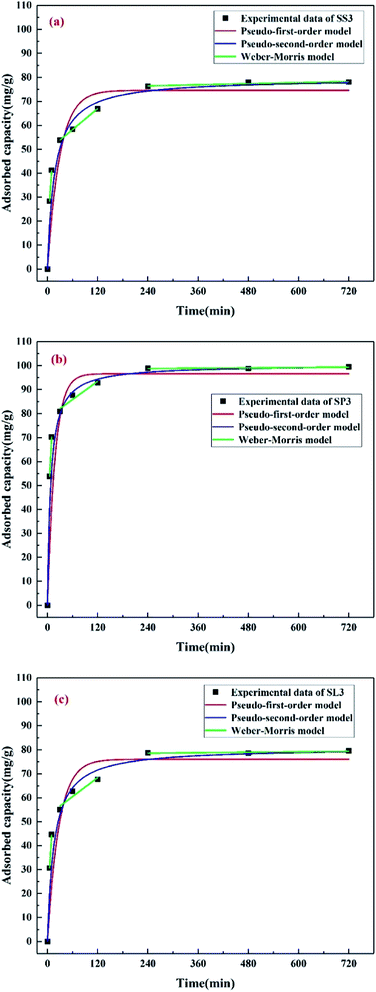
The adsorption kinetics of Pb(II) on SS3, SP3, and SL3 was measured as a function of time (Fig. 9). Three kinetic models, pseudo-first-order, pseudo-second-order, and Weber–Morris model were used to analyze the adsorption process. The calculated values of qe, K1, K2 and correlation coefficient (R2) are shown in Table 3. It could be obtained by Table 3 that the adsorption process of Pb(II) on SS3, SP3, and SL3 conformed to the pseudo-second-order model. As shown in Fig. 9, Pb(II) equilibrium was achieved within 4 hours. The results of Liu and Zhang showed that 95% of Pb(II) removal equilibrium was less than 5 hours.40 The adsorption data fitted by the Weber–Morris model were multi-line segments, and the first stage passed through the origin, indicating that intraparticle diffusion occurred. In the second and third stages, the adsorption of Pb(II) conformed to the theory of diffusion limitation, and the intraparticle diffusion gradually weakened, with chemical reactions such as substance exchanged. The similar phenomena were found in the adsorption of Pb(II) on biochar from digested whole beet residue.41
 |
| | Fig. 9 Kinetics of Pb(II) adsorption onto stem-skins biochar (a), stem-pith biochar (b), stem-leaves biochar (c). | |
Table 3 Dynamics parameters for Pb(II) adsorption onto biochar
| |
Pseudo-first-order |
Pseudo-second-order |
| qe (mg g−1) |
K1 (min−1) |
R12 |
qe (mg g−1) |
K2 (g mg−1 min−1) |
R22 |
| SS3 |
74.60 |
0.0342 |
0.7605 |
79.60 |
0.0007 |
0.9395 |
| SP3 |
96.63 |
0.0561 |
0.7679 |
100.39 |
0.0013 |
0.9936 |
| SL3 |
76.02 |
0.0367 |
0.7725 |
80.90 |
0.0008 |
0.9442 |
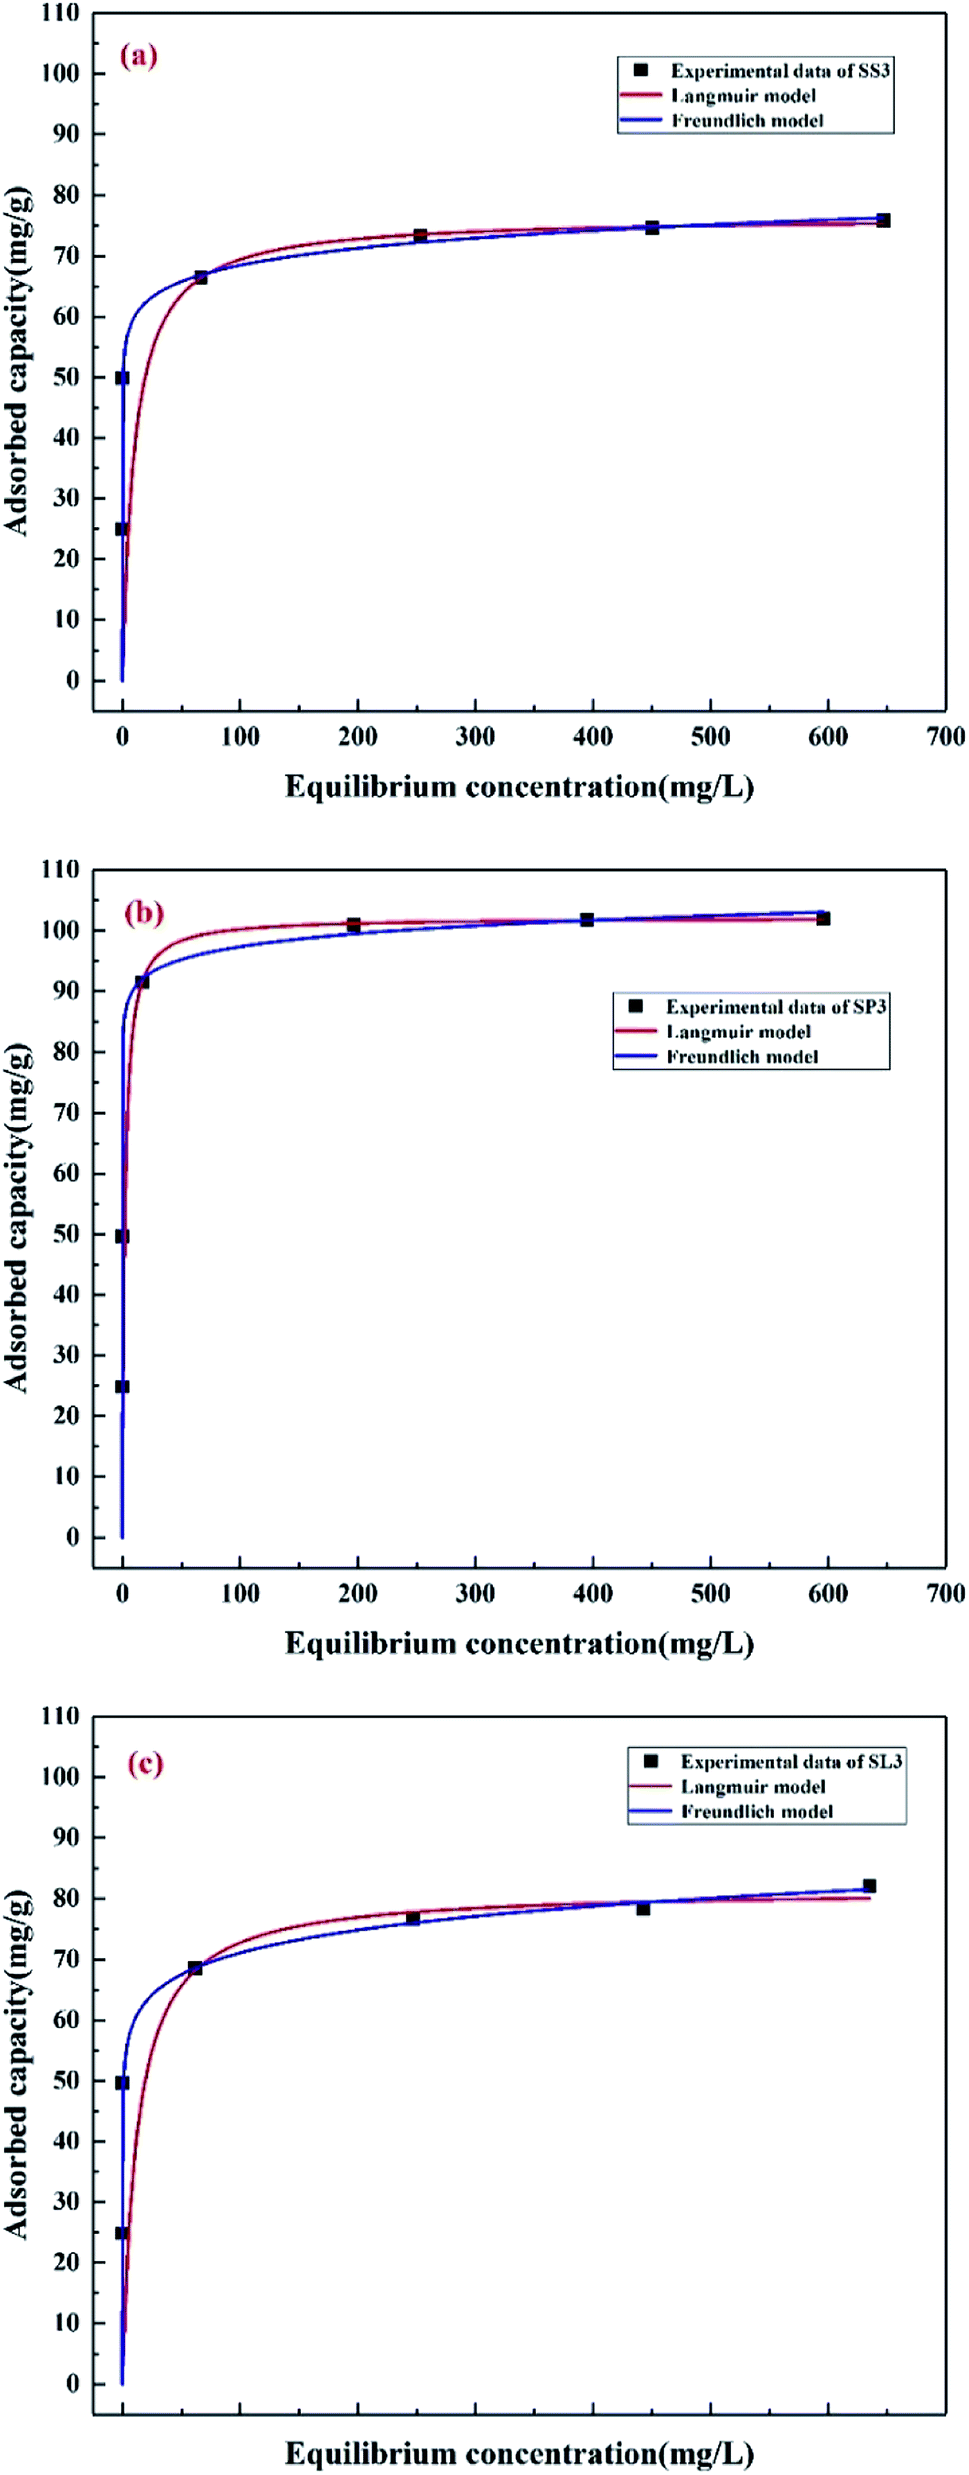
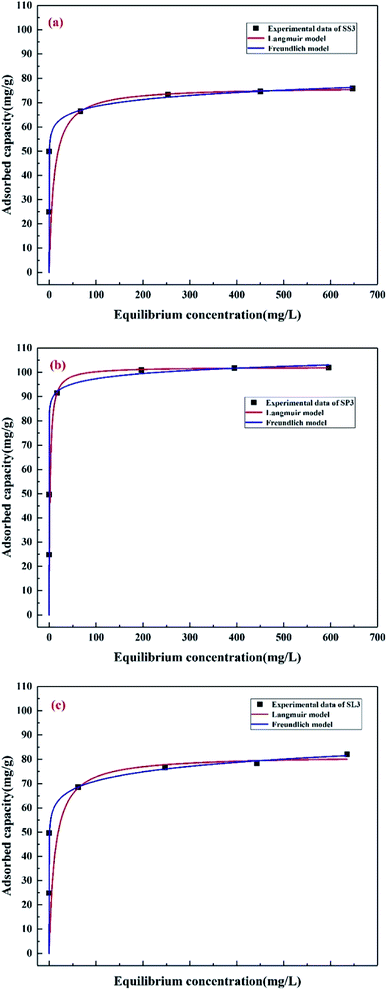
The adsorption isotherms of Pb(II) at different initial concentrations (50–800 mg g−1) were studied, as shown in Fig. 10. Table 4 lists the adsorption constants and correlation coefficients of SS3, SP3, and SL3 for Pb(II) from Langmuir and Freundlich isotherms. The correlation coefficient showed that the Langmuir model was more consistent with the data than the Freundlich model (R2 of the Langmuir model was more than 0.94, and R2 of the Freundlich model was 0.83–0.94). The results were similar to the results of adsorption for Pb(II) in water by biochar prepared from bagasse after anaerobic digestion.42 The maximum adsorption capacity of SP3 for Pb(II) (102.20 mg g−1) was higher than that of SS3 and SL3 (76.51 mg g−1 and 81.61 mg g−1, respectively). The adsorption effect of SP3 for Pb(II) was the best. The maximum adsorption quantity qmax calculated by the Langmuir model was similar to the measured value, which indicated that the adsorption of Pb(II) by corn stalks biochar was similar to that by monolayer chemical adsorption. The separation factor RL in the Langmuir model could further describe the adsorption process, which was related to the affinity of binding sites and could be used to compare the affinity of biochar to metal ions.43 The KL of three biochar were all between 0 and 1, which indicated that the adsorption process of biochar for Pb(II) was preferential. The affinity of SP3 and SL3 to Pb(II) was higher (0.5904 L mg−1 and 0.5820 L mg−1, respectively).
 |
| | Fig. 10 Adsorption isotherms of Pb(II) on stem-skins biochar (a), stem-pith biochar (b), stem-leaves biochar (c). | |
Table 4 Best-fit values for model of isotherm data and the thermodynamic parameters
| |
Langmuir |
Freundlich |
| qmax (mg g−1) |
KL (L mg−1) |
RL2 |
qmax (mg g−1) |
1/n |
RF2 |
| SS3 |
76.51 |
0.5179 |
0.9477 |
52.45 |
0.0578 |
0.8373 |
| SP3 |
102.20 |
0.5904 |
0.9915 |
84.14 |
0.0317 |
0.9409 |
| SL3 |
81.61 |
0.5820 |
0.9621 |
50.50 |
0.0742 |
0.8636 |
3.3 Characterization of biochar before and after adsorption
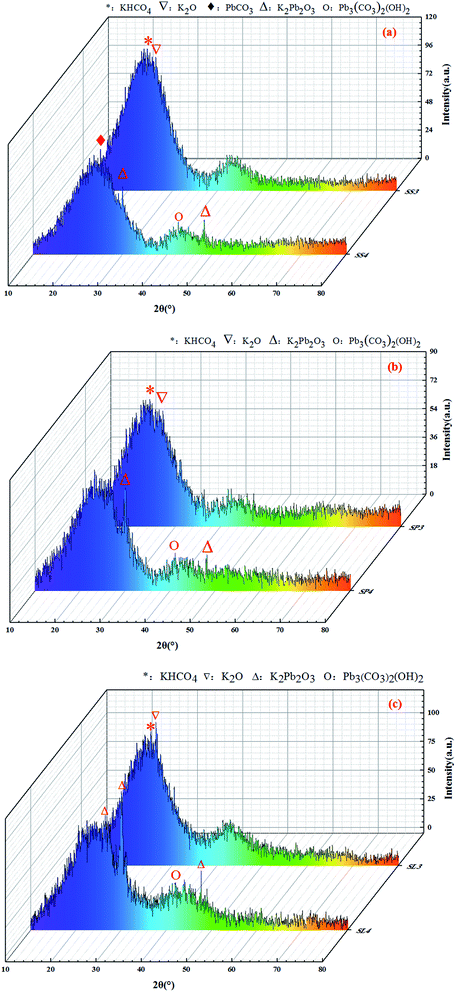
The X-ray diffraction patterns are shown in Fig. 11. The XRD spectras of stem-skins, stem-pith and stem-leaves biochar had obvious changes before and after adsorption of Pb(II). It could be analyzed from the Fig. 11 that after KOH modification of biochar, a peak appeared at 2θ of 25.703°, 27.552°, which was KHCO4 and K2O. When the biochar was activated by KOH, KOH decomposed to form K2O and H2O. Under high temperature, K2O and C reacted to form CO. CO shuttled through the biochar system to form one pore after another. At this time, K2O reacted incompletely and a small part of it remained in biochar. The adsorption of Pb(II) by biochar formed partial precipitation. K2Pb2O3 was observed at peaks of 2θ = 21.167°, 30.088°, 48.428°, and Pb3(CO3)2(OH)2 was observed at peaks of 2θ = 42.623°. Stem-skins biochar was generated with PbCO3 at 2θ = 24.807°. The adsorption mechanism of Pb(II) by biochar was specific adsorption in the form of Pb–O or hydroxyl binding and ion exchange.44 The potassium hydroxide-activated biochar and Pb(II) formed precipitate of K2Pb2O3 through complexation reaction. The carbonate in biochar reacted with lead to form PbCO3, while the activation of potassium hydroxide brought enough hydroxyl groups to form Pb3(CO3)2(OH)2. The experimental results are in good agreement with those of J. Liang44 and X. Cao.45 The comprehensive results showed that the stem-leaves biochar by KOH modified and adsorption of Pb(II) formed new phases, which formed K2O, KHCO4 after modification, and K2Pb2O3, Pb3(CO3)2(OH)2, PbCO3 after adsorption of Pb(II).
 |
| | Fig. 11 XRD spectrums before and after adsorption of Pb(II) on stem-skins biochar (a), stem-pith biochar (b), stem-leaves biochar (c). | |
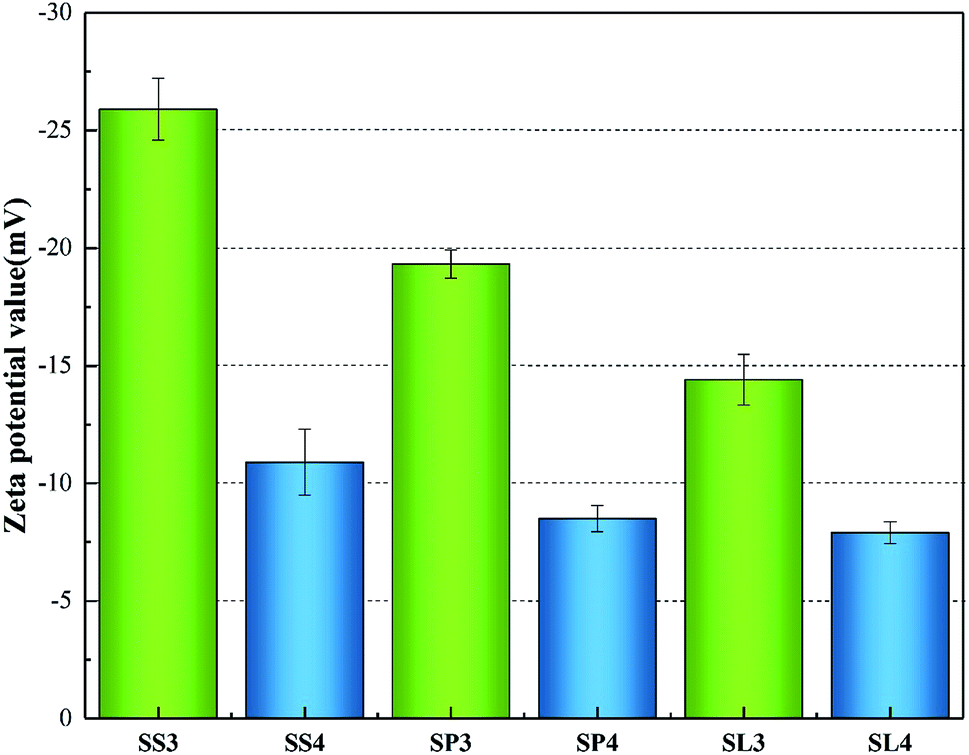
The zeta potentials value of the three biochar adsorbents are shown in Fig. 12. The zeta potentials of SS3, SP3, SL3 were −25.9 mV, −19.33 mV and −14.4 mV. After adsorption, the zeta potentials of SS4, SP4, SL4 were −10.9 mV, −8.5 mV and −7.9 mV. It could be concluded that the surface charge of biochar was negatively charged, and Pb(II) entered the molecular layer of biochar through cation exchange, occupying its chemical sites,46 which was similar to the analysis results of Cu2+ and Zn2+ adsorbed by modified montmorillonite by Y. Liu47 et al. The absolute value of the Zeta potential of stem-skins biochar was larger than that of stem-pith and stem-leaves, indicating that the electrostatic repulsion among the biochar particles of stem-skins was great and the structure was more stable. After the adsorption of Pb(II), the zeta potential negative potential gradually increased.
 |
| | Fig. 12 Zeta potentials value before and after adsorption of Pb(II) on biochar. | |
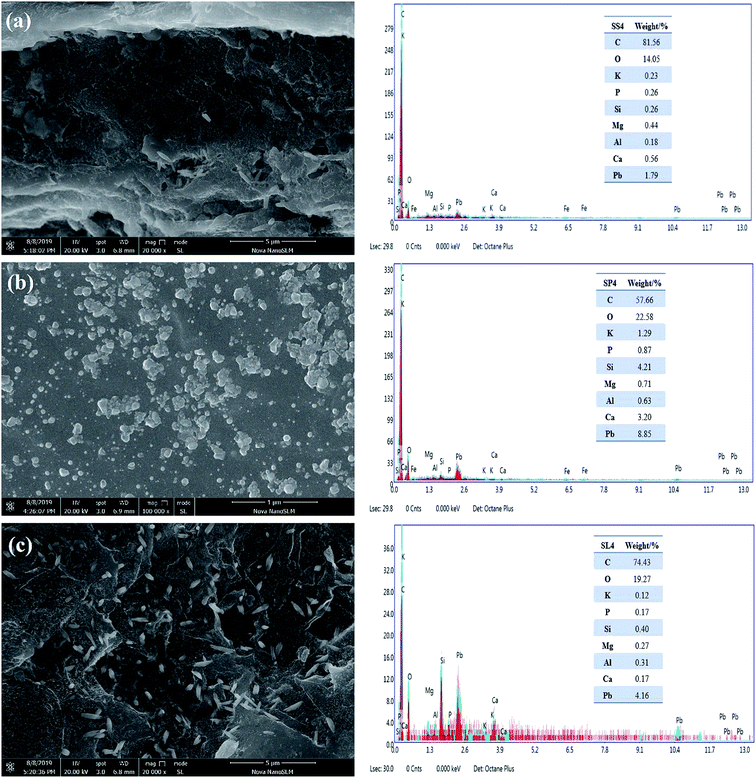
The energy spectrums of adsorption by SS4, SP4 and SL4 are shown in Fig. 13(a–c). The elements on the surface of biochar were mainly C, O, K, P, Si, Mg, Al, Ca. Generally speaking, except for C, the contents of Si and Ca were higher (Fig. 13). The inorganic mineral component played a significant role in the adsorption of heavy metals. The white spots were precipitates of lead in Fig. 13, which indicated that it formed precipitates of lead on the surface or pores of the biochar after adsorption of Pb(II). Because the mineral components of biochar can co-precipitate with Pb(II). At the same time, Pb(II) and –COOH, –OH can also undergo complexation reactions.48
 |
| | Fig. 13 SEM-EDS spectrums of stem-skins biochar (a), stem-pith biochar (b), stem-leaves biochar (c) after adsorption of Pb(II). | |
4. Conclusions
The study highlighted the potentiality to adsorb Pb(II) in water by pretreated biochar from different components of corn stalks. Results revealed that the addition of polyethylene promoted the carbonization of biomass, increased the conversion of biomass and improved the aromaticity and stability of biochar. When the mass ratio of biomass to polyethylene was 4:1, the yield was the highest. The modification changed the pore structure of biochar and improved the adsorption capacity. Under the optimum conditions (adsorption time of 4 h and initial Pb(II) concentration of 400 mg L−1), the adsorption of Pb(II) by biochar reached saturation. The stem-pith biochar had the biggest adsorption capacity (99.95 mg g−1). The adsorption data of biochar fitted well with the Pseudo-second-order model and Langmuir adsorption isotherm model, which was monolayer adsorption accompanied by chemical adsorption reactions such as ion exchange, co-precipitation, and complexation. The corn stalks biochar can effectively remove Pb(II) in water, and the stem-pith biochar has the best effect. It provides the high-efficiency and low-cost adsorption raw materials for water treatment, which is conducive to the best use of all components of corn stalks.
Conflicts of interest
The authors declare that they have no known competing financial interests or personal relationships that could have appeared to influence the work reported in this paper.
Acknowledgements
The authors would like to show their sincere gratitude for the financial support from the National Natural Science Foundation of China (No. 51173160) and Liaoning Province “Hundred Million Talent Project” (2019).
References
- N. V. Rusova, O. V. Astashkina and A. A. Lysenko, Fibre Chem., 2015, 47, 320–323 CrossRef CAS.
- M. M. Shahata, Arabian J. Chem., 2016, 9, 755–763 CrossRef CAS.
- X. Wu, L. Luo, Z. Chen and K. Liang, Appl. Surf. Sci., 2016, 364, 86–95 CrossRef CAS.
- Y. Cheng, C. Yang, H. He, G. Zeng, K. Zhao and Z. Yan, J. Environ. Eng., 2016, 142, 1–7 CrossRef.
- H. J. He, Z. H. Xiang, X. J. Chen, H. Chen, H. Huang, M. Wen and C. P. Yang, Int. J. Environ. Sci. Technol., 2018, 15, 1491–1500 CrossRef CAS.
- M. Mureseanu, A. Reiss, N. Cioatera, I. Trandafir and V. Hulea, J. Hazard. Mater., 2010, 182, 197–203 CrossRef CAS PubMed.
- D. Pérez-Quintanilla, A. Sánchez and I. Sierra, J. Colloid Interface Sci., 2016, 126–134 CrossRef PubMed.
- M. Najafi, Y. Yousefi and A. A. Rafati, Sep. Purif. Technol., 2012, 85, 193–205 CrossRef CAS.
- S. Wu, H. He, X. Inthapanya, C. Yang, L. Lu, G. Zeng and Z. Han, Environ. Sci. Pollut. Res., 2017, 24, 16560–16577 CrossRef CAS PubMed.
- H. Jin, M. U. Hanif, S. Capareda, Z. Chang, H. Huang and Y. Ai, J. Environ. Chem. Eng., 2016, 4, 365–372 CrossRef CAS.
- M. Selvanathan, K. T. Yann, H. C. Chang, A. Selvarajoo, S. K. Arumugasamy and V. Sethu, Water, Air, Soil Pollut., 2017, 228, 299 CrossRef.
- J. Wu, D. Huang, X. Liu, J. Meng, C. Tang and J. Xu, J. Hazard. Mater., 2018, 10–19 CrossRef CAS PubMed.
- L. Yan, L. Kong, Z. Qu, L. Li and G. Shen, ACS Sustainable Chem. Eng., 2015, 3, 125–132 CrossRef CAS.
- M. C. Wang, G. D. Sheng and Y. P. Qiu, Int. J. Environ. Sci. Technol., 2015, 12, 1719–1726 CrossRef CAS.
- H. Wang, B. Gao, S. Wang, J. Fang, Y. Xue and K. Yang, Bioresour. Technol., 2015, 356–362 CrossRef PubMed.
- Y. Xue, B. Gao, Y. Yao, M. Inyang, M. Zhang, A. R. Zimmerman and K. S. Ro, Chem. Eng. J., 2012, 673–680 CrossRef CAS.
- S. Lee, J. H. Park, Y. Ahn and J. Chung, Water, Air, Soil Pollut., 2015, 226, 9 CrossRef.
- B. Zhao, D. Oconnor, J. Zhang, T. Peng, Z. Shen, D. C. W. Tsang and D. Hou, J. Cleaner Prod., 2018, 174, 977–987 CrossRef CAS.
- Y. Wang and R. Liu, Sci. Total Environ., 2018, 1139–1148 CrossRef PubMed.
- Y. Zhou, B. Gao, A. R. Zimmerman, H. Chen, M. Zhang and X. Cao, Bioresour. Technol., 2014, 152, 538–542 CrossRef CAS PubMed.
- T. Liu, B. Gao, J. Fang, B. Wang and X. Cao, RSC Adv., 2016, 6, 24314–24319 RSC.
- L. Trakal, R. Šigut, H. Šillerová, D. Faturíková and M. Komárek, Arabian J. Chem., 2014, 7, 43–52 CrossRef CAS.
- L. Zhou, Y. Liu, S. Liu, Y. Yin, G. Zeng, X. Tan, X. Hu, X. Hu, L. Jiang and Y. Ding, Bioresour. Technol., 2016, 218, 351–359 CrossRef CAS PubMed.
- G. Lv and S. Wu, J. Anal. Appl. Pyrolysis, 2012, 97, 11–18 CrossRef CAS.
- S. Wang, G. Dai, B. Ru, Z. Yuan, X. Wang, X. Gang and Z. Luo, Energy, 2016, 120, 864–871 CrossRef.
- S. Wang, G. Dai, B. Ru, Y. Zhao, X. Wang, J. Zhou, Z. Luo and K. Cen, Bioresour. Technol., 2016, 218, 1106–1114 CrossRef CAS PubMed.
- Y. Huang, C. Yang, Z. Sun, G. Zeng and H. He, RSC Adv., 2015, 5, 11475–11484 RSC.
- B. B. Uzoejinwa, X. He, S. Wang, A. E. Abomohra, Y. Hu and Q. Wang, Energy Convers. Manage., 2018, 163, 468–492 CrossRef CAS.
- E. Önal, B. B. Uzun and A. E. Pütün, Energy Convers. Manage., 2014, 78, 704–710 CrossRef.
- X. Kai, R. Li, T. Yang, S. Shen, Q. Ji and Z. Tao, Energy Convers. Manage., 2017, 146, 20–33 CrossRef CAS.
- A. Marcilla, A. Gómez-Siurana and F. J. Valdés, Appl. Catal., A, 2008, 334, 20–25 CrossRef CAS.
- F. Abnisa and M. A. W. D. Wan, Energy Convers. Manage., 2014, 87, 71–85 CrossRef CAS.
- L. Xuan, Z. Yang, Z. Li, F. Rui and Y. Zhang, Bioresour. Technol., 2014, 170, 76–82 CrossRef PubMed.
- P. Regmi, J. L. G. Moscoso, S. Kumar, X. Cao, J. Mao and G. Schafran, J. Environ. Manage., 2012, 109, 61–69 CrossRef CAS PubMed.
- J. Han, S. Jeong, J. H. Lee, J. W. Choi, J. Lee and K. C. Roh, ACS Sustainable Chem. Eng., 2019, 7, 2471–2482 CrossRef CAS.
- C. Lu, S. Xu, Y. Gan, S. Liu and C. Liu, Carbon, 2005, 43, 2295–2301 CrossRef CAS.
- S. Yoshiyuki and K. Yutaka, Bioresour. Technol., 2003, 90, 241–247 CrossRef.
- X. J. Lee, L. Y. Lee, B. Y. Z. Hiew, S. Gan, S. Thangalazhy-Gopakumar and H. Kiat Ng, Bioresour. Technol., 2017, 944–953 CrossRef CAS PubMed.
- Y. Zhang, B. Cao, L. Zhao, L. Sun, Y. Gao, J. Li and F. Yang, Appl. Surf. Sci., 2017, 427, 147–155 CrossRef.
- Z. Liu and F. Zhang, J. Hazard. Mater., 2009, 167, 933–939 CrossRef CAS PubMed.
- M. Inyang, B. Gao, Y. Yao, Y. Xue, A. R. Zimmerman, P. Pullammanappallil and X. Cao, Bioresour. Technol., 2012, 110, 50–56 CrossRef CAS PubMed.
- M. Inyang, B. Gao, W. Ding, P. Pullammanappallil, A. R. Zimmerman and X. Cao, Sep. Sci. Technol., 2011, 46, 1950–1956 CrossRef CAS.
- V. D. O. S. Neto, D. Q. Melo, T. C. D. Oliveira, R. Nonato, P. Teixeira, M. A. A. Silva and R. F. D. Nascimento, J. Appl. Polym. Sci., 2014, 131, 9087–9097 Search PubMed.
- J. Liang, X. Li, Z. Yu, G. Zeng, Y. Luo, L. Jiang, Z. Yang, Y. Qian and H. Wu, ACS Sustainable Chem. Eng., 2017, 5, 5049–5058 CrossRef CAS.
- X. Cao, L. Ma, B. Gao and W. Harris, Environ. Sci. Technol., 2009, 43, 3285–3291 CrossRef CAS PubMed.
- Q. Zhou, H. He, J. Zhu, W. Shen, R. L. Frost and P. Yuan, J. Hazard. Mater., 2008, 154, 1025–1032 CrossRef CAS PubMed.
- Y. Liu, J. Luan, C. Zhang, X. Ke and H. Zhang, Environ. Sci. Pollut. Res., 2019, 26, 10387–10397 CrossRef CAS PubMed.
- L. Zhang, J. Guo, X. Huang, W. Wang, P. Sun, Y. Li and J. Han, RSC Adv., 2019, 9, 365–376 RSC.
|
| This journal is © The Royal Society of Chemistry 2020 |
Click here to see how this site uses Cookies. View our privacy policy here. 
 Open Access Article
 This Open Access Article is licensed under a Creative Commons Attribution-Non Commercial 3.0 Unported Licence
 *ab,
Tianhua Yangb,
Yongsheng Chena,
Beibei Yana,
Rundong Lib and
Guanyi Chena
*ab,
Tianhua Yangb,
Yongsheng Chena,
Beibei Yana,
Rundong Lib and
Guanyi Chena