 Open Access Article
The mineralization, drug release and in vivo bone defect repair properties of calcium phosphates/PLA modified tantalum scaffolds†
Rong Zhou‡
ab,
Hai-Jian Ni‡c,
Jin-Hui Peng*a,
Ning Liua,
Shu Chena,
Jia-Hua Shaoa,
Qi-Wei Fua,
Jun-Jian Liuc,
Feng Chen *c and
Qi-Rong Qian*a
aDepartment of Orthopedics, Changzheng Hospital, Second Military Medical University, Shanghai, 200003, P. R. China. E-mail: pengjinhui20110@smmu.edu.cn; qianqr@smmu.edu.cn
bDepartment of Orthopaedics, 72nd Group Army Hospital of PLA, No. 9 Chezhan Road, Wuxing District, Huzhou, 313000, P. R. China
cDepartment of Orthopedics, Spinal Pain Research Institute, Shanghai Tenth People's Hospital, Tongji University School of Medicine, Shanghai 200072, P. R. China. E-mail: fchen@tongji.edu.cn
First published on 21st February 2020
Abstract
Calcium phosphate based biomaterials have been widely studied in biomedical areas. Herein, amorphous calcium phosphate (ACP) nanospheres and hydroxyapatite (HA) nanorods were separately prepared and used for coating tantalum (Ta) scaffolds with a polymer of polylactide (PLA). We have found that different crystal phases of calcium phosphate coated on Ta scaffolds displayed different effects on the surface morphologies, mineralization and bovine serum albumin (BSA) release. The ACP-PLA and HA-PLA coated on Ta scaffold were more favorable for in vitro mineralization than bare and PLA coated Ta scaffolds, and resulted in a highly hydrophilic surfaces. Meanwhile, the osteoblast-like cells (MG63) showed favorable properties of adhesion and spreading on both ACP-PLA and HA-PLA coated Ta scaffolds. The ACP-PLA and HA-PLA coated Ta scaffolds showed a high biocompatibility and potential applications for in vivo bone defect repair.
1. Introduction
Bone defects originated by trauma and other pathological changes are common clinical diseases. Many strategies have been developed for the therapy of bone defects, including implantation of autografts/allografts and synthetic scaffolds.1,2 The use of synthetic scaffolds is one of the most promising ways for the treatment of bone defects.3,4 The synthetic scaffolds have convenient sources, good safety and non-immunogenicity, therefore, various synthetic scaffolds such as inorganic ceramics, bone cements, and metal implants have been introduced as the substrates for bone defects.5,6 These synthetic scaffolds provide physical support, structural guidance, and sites for cells adhesion, which are very important in new bone tissue regeneration, for example, in the porous tantalum (Ta) scaffolds which have been introduced as a metallic implant for bone defect therapy. Porous Ta scaffolds haves good stability, high volumetric porosity (70–80%), low modulus of elasticity (3 MPa), and high friction characteristics, which can improve bone ingrowth and bone mineral density.7–9The preparation of ideal biomedical scaffold, which can provide suitable functions such as mechanical support, biocompatibility, osteoconductivity and osteoinductivity, is still a big challenge. Synthesizing a biomaterial with a single component meeting the high requirements of bone defect repair is still difficult. Therefore, composite materials and surface modification have been studied. For example, calcium phosphate (CaP) hybrid materials have been developed to improve the mechanical properties, biocompatibility and bioactivity of synthetic scaffolds.10,11 The CaP based materials are considered as promising biomaterials with high biocompatibility and bioactivity, attributed to the similar chemical properties to the mineral phase of bone.12–14 In native bone tissues, the nanostructured hydroxyapatite (HA) can form a hierarchical composite with collagen fibrils.15,16 Therefore, the synthetic nanostructured CaP has been deemed to be biocompatible and hold a good biodegradation.17,18 CaP based biomaterials and their composites have been extensively employed in various biomedical areas, such as drug delivery,19–21 protein adsorption,22 bioimaging,23,24 bone defect repair/tissue engineering.25,26 For example, CaP coated metallic scaffolds are considered as the promising weight bearing implants owing to their advantages of high biocompatibility and strength.27–29 Meanwhile, in previous studies, the protein drugs of growth factors, such as, morphogenetic protein (BMP), vascular endothelial growth factor (VEGF), basic fibroblast growth factor (bFGF) and transforming growth factor-beta (TGF-β), were adopted and loaded in CaP materials to prepare biomaterials which are favorable for bone defect repair.10,11,30 However, the drug release properties of modified Ta scaffolds are rarely reported and still necessary in the biomedical field, especially for the application of bone defect repair.
In this study, the amorphous calcium phosphate (ACP) nanospheres and HA nanorods have been prepared and separately blended with racemic polylactic acid (PLA) to modify Ta scaffolds. The physico-chemical properties, mineralization, drug release, cell viability and the effects on bone defect repair of the ACP-PLA and HA-PLA modified Ta scaffolds have been investigated.
2. Experimental
2.1 Preparation of ACP nanospheres and HA nanorods
The ACP nanospheres were prepared by a modified method from reported literature.31 Firstly, the Solution A for reaction was prepared by dissolving CaCl2 (0.166 g) and polylactide-block-monomethoxy(polyethyleneglycol) (PLA-mPEG) (0.025 g) in deionized water (60 mL). Then, aqueous ammonia (∼25%, 10 mL) was added into Solution A. Meanwhile, the Solution B was prepared by dissolving Na2HPO4·12H2O (0.355 g) and PLA-mPEG (0.025 g) in deionized water (60 mL). Secondly, the Solution A with aqueous ammonia was slowly added (20 mL min−1) into Solution B. The resulting mixed solution was stirred for 1 h at room temperature. Finally, the ACP nanospheres were separated by centrifugation, washed with deionized water and ethanol several times. For the preparation of HA nanorods, the above reaction solution (60 mL) without separation was transferred to a Teflon-lined stainless steel autoclave (100 mL), sealed, and heated at 200 °C for 24 h. After cooling down to room temperature, the products were separated by centrifugation, and washed with deionized water and ethanol several times. The block copolymer of PLA-mPEG (Mw PLA = 3000, Mw PEG = 5000) were purchased from Jinan Daigang Biomaterials Co. Ltd. Other chemicals were purchased from Sinopharm Chemical Reagent Co. and used as received without further purification.2.2 Preparation of ACP-PLA and HA-PLA modified Ta scaffolds
ACP nanospheres and HA nanorods were separately dispersed in acetone, and then the equal amount of solid PLA polymer were added in the above suspensions under magnetic stirring. After dissolution of PLA, the ACP-PLA and HA-PLA suspensions were obtained for coating Ta scaffolds. The concentration of ACP, HA and PLA was separately fixed at 3 wt% in each suspension. The racemic PLA (Mw = 500![[thin space (1/6-em)]](https://www.rsc.org/images/entities/char_2009.gif) 000) were purchased from Jinan Daigang Biomaterials Co. Ltd. The Ta plates (1 cm × 1 cm × 0.1 mm) were obtained from Beijing Orient Tantalum Niobium Co. Ltd. (China). Ta scaffolds (0.5 cm × 0.5 cm × 0.5 cm) were obtained from Zimmer Inc. (USA), with a definite porosity of 75–80% and an average pore size of 440 μm. The coating process of Ta scaffolds was performed as follows: the clean Ta plates and porous Ta scaffolds were respectively put into the above ACP-PLA and HA-PLA suspensions, and kept under shaking at 37 °C for 24 h. Thereafter, the ACP-PLA and HA-PLA modified Ta plates and porous Ta scaffolds were obtained through natural drying on filter papers.
000) were purchased from Jinan Daigang Biomaterials Co. Ltd. The Ta plates (1 cm × 1 cm × 0.1 mm) were obtained from Beijing Orient Tantalum Niobium Co. Ltd. (China). Ta scaffolds (0.5 cm × 0.5 cm × 0.5 cm) were obtained from Zimmer Inc. (USA), with a definite porosity of 75–80% and an average pore size of 440 μm. The coating process of Ta scaffolds was performed as follows: the clean Ta plates and porous Ta scaffolds were respectively put into the above ACP-PLA and HA-PLA suspensions, and kept under shaking at 37 °C for 24 h. Thereafter, the ACP-PLA and HA-PLA modified Ta plates and porous Ta scaffolds were obtained through natural drying on filter papers.
Meanwhile, the adsorption efficiency of growth factor by ACP nanospheres and HA nanorods were studied, and the fluorescein isothiocyanate (FITC)-labeled VEGF (VEGF-FITC) was used. The conjugation process was performed with a FITC Protein Labeling Kit (ThermoFisher Scientific), following the manufacturer's instructions. Briefly, VEGF and FITC were mixed at a 1![[thin space (1/6-em)]](https://www.rsc.org/images/entities/char_2009.gif) :
:![[thin space (1/6-em)]](https://www.rsc.org/images/entities/char_2009.gif) 60 molar ratio, incubated at room temperature for 2 h in the dark, and dialyzed at 4 °C against PBS for 24 h. The VEGF-FITC loading experiments were performed as follows: the as-prepared ACP nanospheres (30 mg) and HA nanorods (30 mg) were separately dispersed in aqueous solution (5 mL) with VEGF-FITC (5 μg). The suspension was shaken at a constant rate of 130 rpm in a sealed vessel at 37 °C for 2 h. After centrifugal separation, the supernatants were obtained, and the fluorescence emission spectra of the supernatants were measured in the range from 510 nm to 650 nm with 495 nm of excitation wavelength (F-7000 fluorescence spectrometer, Hitachi Ltd., Japan). The fluorescence micrographs of VEGF-FITC-loading ACP nanospheres and HA nanorods were also obtained by a confocal laser scanning microscopy (Leica, SP8, Germany) to confirm the adsorption of VEGF-FITC.
60 molar ratio, incubated at room temperature for 2 h in the dark, and dialyzed at 4 °C against PBS for 24 h. The VEGF-FITC loading experiments were performed as follows: the as-prepared ACP nanospheres (30 mg) and HA nanorods (30 mg) were separately dispersed in aqueous solution (5 mL) with VEGF-FITC (5 μg). The suspension was shaken at a constant rate of 130 rpm in a sealed vessel at 37 °C for 2 h. After centrifugal separation, the supernatants were obtained, and the fluorescence emission spectra of the supernatants were measured in the range from 510 nm to 650 nm with 495 nm of excitation wavelength (F-7000 fluorescence spectrometer, Hitachi Ltd., Japan). The fluorescence micrographs of VEGF-FITC-loading ACP nanospheres and HA nanorods were also obtained by a confocal laser scanning microscopy (Leica, SP8, Germany) to confirm the adsorption of VEGF-FITC.
2.3 Characterization of samples
Transmission electron microscopy (TEM) micrographs were taken with a JEOL JEM 2100 field-emission transmission electron microscope. The surface morphology has been observed with a JEOL JSM-6700 field-emission scanning electron microscopy (SEM). X-ray powder diffraction (XRD) patterns were recorded using a Rigaku D/max 2550V X-ray diffractometer with a graphite monochromator (Cu Kα radiation, λ = 1.54178 Å). Fourier transform infrared (FTIR) spectra were taken on a FTIR spectrometer (FTIR-7600, Lambda Scientific, Australia). The thermogravimetric (TG) and differential scanning calorimeter (DSC) analysis was carried out with a STA-409/PC simultaneous thermal analyzer (Netzsch, Germany) at a heating rate of 10 °C min−1 in flowing air. The hydrophilic properties were characterized by measuring the contact angles of the ACP-PLA, HA-PLA modified Ta plates before and after the mineralization. The contact angles and the images have been obtained by dropping deionized water (4 μL) on the surface of different samples for 10 seconds, using an Automatic Contact Angle Meter Model SL200A/B/D Series.2.4 In vitro mineralization of ACP-PLA and HA-PLA coatings
The standard simulated body fluid (SBF) with a pH of 7.4 has been prepared according to the reported method.32 SBF solution has definite ion concentrations which are almost equal to those of the human blood plasma (i.e., Na+ 142.0, K+ 5.0, Mg2+ 1.5, Ca2+ 2.5, Cl− 148.8, HCO3− 4.2 and HPO42− 1.0 mM). The in vitro mineralization ability of a material is often evaluated by examining the ability of apatite to form on its surface in SBF, which is useful for predicting the in vivo bone bioactivity of a material.33 The ACP-PLA and HA-PLA coatings on Ta plates were immersed in SBF (20 mL) in culture dishes (diameter, 60 mm), and placed in an incubator at 37 °C. Thereafter, SBF (10 mL) in culture dishes was replaced with fresh SBF (10 mL) every day. The surface morphologies of the mineralized ACP-PLA and HA-PLA modified Ta plates were withdrawn for characterization on day of 0, 1, 3 and 7, respectively.2.5 The measurement of sustained BSA release
A protein of bovine serum albumin (BSA, Sangon Biotech Ltd., China) has been chosen to prepare the BSA-containing ACP-PLA and BSA-containing HA-PLA suspensions for coating Ta plates (1 cm × 1 cm × 0.1 mm). The BSA-containing ACP nanospheres and HA nanorods were prepared according to the modified method used in the preparation of growth factors-containing ACP-PLA and HA-PLA modified Ta scaffolds. The 30 mg of ACP or HA were separately dispersed in BSA solution (5 mL, 1 mg mL−1). The suspension was shaken at a constant rate of 130 rpm in a sealed vessel at 37 °C for 2 h, followed by freeze-drying to obtain the BSA-loading ACP nanospheres and HA nanorods. The coating process is similar to above preparation process of ACP-PLA and HA-PLA modified Ta scaffolds.The in vitro release experiments were performed as follows: the BSA-loading Ta plates were immersed into SBF (80 mL) at 37 °C under shaking at a rate of 160 rpm. The BSA release medium (2 mL) was withdrawn for the UV-vis analysis at 562 nm using the Bicinchoninic Acid Kit (BCA, Beyotime Institute of Biotechnology, China) at given time intervals. The withdrawn solution was replaced with fresh SBF (2 mL, 37 °C). Thereafter, the release curves were obtained and used for the analysis of in vitro BSA release.
2.6 Cell viability and morphology
The ACP-PLA or HA-PLA modified porous Ta scaffolds (0.5 cm × 0.5 cm × 0.5 cm) were prepared for the study of cell viability. The osteoblast-like cells (MG63) were cultured in Dulbecco's Modified Eagle's Medium (DMEM) with 10% Fetal Bovine Serum (FBS) and 1% penicillin–streptomycin in an in humidified incubator at 37 °C with 5% CO2. The different samples were sterilized by 75% ethanol in the 48-well culture plates (Coning, USA). The bare porous Ta scaffolds were used as controls. Then, cell suspension (1.0 mL, 1 × 10⁵ cell mL−1) were seeded onto the ACP-PLA and HA-PLA modified porous Ta scaffold, and cultured for 24 hours. Then, these scaffolds were transferred into new 48-well culture plates, and fresh culture medium was added. After being cultured for given time, a microplate reader (MK3, Thermo, USA) was used to determine the accumulated reduction of alamarBlue™ (Gibco company, USA) in the culture medium on the day of 1 and 3, at extinction wavelength of 570 and 600 nm. The accumulation reduction of alamarBlue™, which is directly related to the reduced internal environment of the cells, can be calculated by the light absorption variation of the reagent from the oxidized blue to the reduced red state. It was reported that the viability of MG63 cells cultured on the scaffolds was evaluated through the change of reduction of alamarBlue™.34 Operation procedures, calculation of cell proliferation and viability were performed according to the instructions of alamarBlue™ assay.The morphology of MG63 was obtained under SEM. Firstly, the sample was rinsed by phosphate-buffered saline (PBS) to remove unattached cells, and then was fixed in 2.5% glutaraldehyde solution for 30 min. The fixed cells were dehydrated by ethanol solutions with increased concentrations (30, 50, 75, 95 and 100 vol%) for 10 min. Finally, the dehydrated samples were air-dried and sputter coated with gold and observed with SEM (S-3400, HITACHI, Japan) at a voltage of 15 kV.
Moreover, the confocal laser scanning microscopy (CLSM) was used to investigate the morphology of the MG63 cells seeded on the ACP-PLA and HA-PLA coatings. After culture for 48 h, the samples were taken out and rinsed with PBS to remove the non-adherent cells. The adherent cells were fixed in 4% paraformaldehyde, and then washed with PBS three times. Then the samples were treated with 0.1% Triton X-100 in PBS for 2 min, washed with PBS three times, and then the nonspecific binding sites were blocked with 1% BSA in PBS for 20 min. The actin cytoskeletons were labeled in green by incubating with phalloidin-FITC (Sigma) for 60 min. After rinsing with PBS three times, the cell nuclei were stained in blue by 4′,6-diamidino-2-phenylindole dihydrochloride (DAPI, Sigma) for 10 min and washed with PBS three times. Finally, the confocal laser scanning microscopy (Leica, SP8, Germany) was used to visualize the actin cytoskeletons and the nuclei of the cells.
2.7 In vivo investigation of subchondral bone defect repair
Articular cartilage and subchondral bone defects (5 mm wide, and 1 cm depth) were created on the femoral trochlear groove of left hind femur of mature New Zealand white rabbits (3.0 kg) using electric drill, after a general anaesthetic with pentobarbital sodium solution (3%, 30 mg kg−1). Ethical approval was given by Independent Ethics Committee, Changzheng Hospital, Second Military Medical University (Shanghai, China). The defects areas were filled with the bare porous Ta scaffolds, and two kinds modified porous Ta scaffolds with ACP-PLA or HA-PLA coatings with VEGF/TGF (5 μg VEGF121 and 2 μg TGF-β1 in loading solution, PeproTech Inc., USA). Then, the autogenic periosteums (10 mm wide) separated from marginal area of the same condyles were used to cover the defects. Each kind of scaffolds was sterilized by 75% ethanol, washed with PBS and then placed into 3 defect sites for evaluation following surgery. The cast plasters were used to immobilize the joints for 2 weeks, and the samples were harvested at 12 weeks. The collected samples were subsequently fixed in 10% phosphate buffered formalin for 48 h before the dehydration treatment in a series of ethanol (75, 85, 95 and 100 vol%). The femoral samples were then decalcified in 10% EDTA, changed twice weekly for 3 weeks, and then embedded in paraffin with the long axis parallel to the base plane. Thereafter, these samples were sliced into thin specimens (5 μm) parallel to the long axis of the condyles. The thin specimens were mounted on poly-L-lysine-coated slides and then subjected to be stained with the Van Gieson, Toluidine blue and Masson's trichrome methods for the analysis of histology.3. Results and discussion
3.1 Characterization of ACP nanospheres and HA nanorods
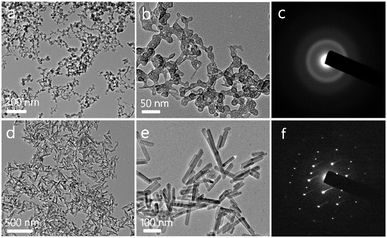
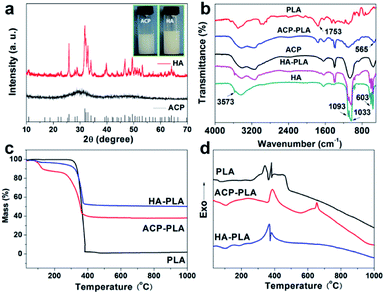
The structures of the as-prepared ACP and HA are investigated with TEM. As shown in Fig. 1a and b, the ACP shows a nanospherical structure with diameters of 10–50 nm, and the selected area electron diffraction (SAED) pattern shows an amorphous structure (Fig. 1c). Meanwhile, the XRD pattern (Fig. 2a) which shows no discernable peaks of crystalline CaP but a characteristic hump of amorphous phase at around 2θ = 30° also indicates that the sample is consisted of ACP phase. The formation mechanism of ACP nanosphere has been studied in previous reports.31 The block copolymer of PLA-mPEG which has been widely used in drug release is amphiphilic and can easily self-assemble to form spherical micelle in aqueous solution. The negatively charged oxygen atoms of C–O–C groups in the PLA-mPEG chains may interact with Ca2+ ions via electrostatic attraction.35 The presence of poly(ethylene glycol) chains is known to decrease the solubility of the amorphous phase and inhibit its transformation to HAP.36Meanwhile, the TEM micrographs in Fig. 1d and e indicate that the HA is consisted of nanorod structure with diameters of 20–30 nm. The SAED pattern (Fig. 1f) of an individual nanorod shows a single-crystalline diffraction pattern of HA. The XRD pattern of the HA nanorods is given in Fig. 2a, and shows that the sample is consisted of a single phase of a hexagonal structure (JCPDS no. 09-0432). The diffraction peaks of HA nanorods at around 2θ ≈ 25.8°, 28.9°, 31.7°, 34.0°, 40.5°, 46.7°, 49.5°, 53.1° and 64.1° correspond to (002), (210), (211), (202), (221), (222), (213), (004) and (304) crystal faces of HA. The preferred growth direction of the HA nanorod is along the c-axis of the hexagonal structure. The formation of HA nanorods can be well explained by a crystallization process of ACP nanospheres and the following crystal growth, under the hydrothermal treatment at 200 °C for 24 h.
It is difficult to directly coat ACP or HA onto the surface of Ta metals at normal conditions. Therefore, PLA which is a popular biomaterial was chosen to make composites with ACP or HA, and used as adhesion agent to coat ACP or HA onto the surface of Ta metals. The as-prepared ACP nanospheres and HA nanorods can be well dispersed in acetone (inset of Fig. 2a), and used to prepare homogeneous suspensions after being blended with PLA polymer. Then, the ACP-PLA and HA-PLA suspensions were separately used to modify the Ta scaffolds. The main strategy for the preparation of ACP-PLA and HA-PLA modified Ta scaffolds is illustrated in Scheme 1. After the coating procedure, the ACP-PLA or HA-PLA layers are easily obtained on the surface of Ta scaffolds.
 | ||
| Scheme 1 Illustration of the strategy for the preparation of ACP-PLA and HA-PLA modified Ta scaffolds. | ||
3.2 Characterization of ACP-PLA and HA-PLA
FTIR spectra of the pure PLA, ACP nanospheres, HA nanorods and the composites of ACP-PLA and HA-PLA are shown in Fig. 2b. In the spectra of pure PLA, ACP-PLA and HA-PLA, the following absorption peaks are observed, including the C–O stretching at about 1087 cm−1, carbonyl band (–C![[double bond, length as m-dash]](https://www.rsc.org/images/entities/char_e001.gif) O) at about 1753 cm−1, and –CH– stretching vibration at about 3000 cm−1.37 These characteristic peaks imply the presence of the PLA polymer. For the FTIR spectra of ACP nanospheres, HA nanorods, ACP-PLA and HA-PLA, the distinctive bands at around 565, 603, 1033 and 1093 cm−1 for PO43− are observed, indicating the presence of ACP and HA.12,21 The results of FTIR spectra support the existence of ACP, HA and PLA in the composites of ACP-PLA and HA-PLA, respectively.
O) at about 1753 cm−1, and –CH– stretching vibration at about 3000 cm−1.37 These characteristic peaks imply the presence of the PLA polymer. For the FTIR spectra of ACP nanospheres, HA nanorods, ACP-PLA and HA-PLA, the distinctive bands at around 565, 603, 1033 and 1093 cm−1 for PO43− are observed, indicating the presence of ACP and HA.12,21 The results of FTIR spectra support the existence of ACP, HA and PLA in the composites of ACP-PLA and HA-PLA, respectively.
The TG and DSC curves are obtained to investigate the thermophysical properties of the PLA polymer and ACP-PLA and HA-PLA (Fig. 2c and d). In the TG curve of PLA, about 100% weight loss is observed in the temperature range of 300–400 °C, due to the oxidative decomposition of PLA polymer, accompanying by exothermic peaks near 390 °C in the curve of DSC. In the TG curves of ACP-PLA and HA-PLA, the weight losses of about 51.9% and 45.3% are due to the oxidative decomposition of the PLA in the temperature range of 200–400 °C, which also can be accompanied by the exothermic peaks near 350 °C in the DSC curves. The mass percentages of PLA in ACP-PLA and HA-PLA are about 51.9% and 45.3%, and the mass percentages of ACP and HA are 38.5% and 51.2%, respectively. The difference between this results and the input qualities of ACP and HA may be attributed to the difference on the water contents in the samples. The weight losses of about 9.6% and 3.5% in the temperature range of 100–120 °C in the TG curves is due to the loss of water molecules in ACP-PLA and HA-PLA, which can be accompanied by endothermic peaks near 100 °C in the DSC curves, respectively. Otherwise, there is a small peak in the DSC curves of ACP-PLA around 650 °C corresponding to the phase transform of amorphous to crystalline CaP at high temperatures. This result accords with the result of XRD pattern which has indicated an amorphous phase of ACP nanospheres. The above results of both TG and DSC curves display the thermophysical properties of the as-prepared PLA, ACP-PLA and HA-PLA, supporting the existence of ACP, HA, and PLA in the composites of ACP-PLA and HA-PLA, respectively.
3.3 In vitro mineralization of ACP-PLA and HA-PLA modified Ta plates
The bare Ta plates, PLA modified Ta plates were treated in SBF for different days and observed by SEM (Fig. 3). There is no new substance precipitated on the surfaces of bare Ta plates and PLA coating on Ta plates after being immersed in SBF for 7 days. However, the surface morphologies of ACP-PLA and HA-PLA coatings on Ta surfaces largely change after being immersed in SBF for different time (Fig. 3). Before the treatment with SBF, the ACP nanospheres and HA nanorods are embedded in PLA polymer and form ACP-PLA and HA-PLA coatings on the surfaces of Ta plates. However, the surface of the ACP-PLA coating on Ta plates are covered by assembled structures of CaP nanosheets after being immersed in SBF for only 1 day. With expanding the time from 1 day to 3 days and 7 days, the size of CaP nanosheets gradually grows up. It is well reported that the ACP is not stable and can transform into crystallized HA in aqueous solution.38,39 As for the HA-PLA coating on Ta plates, there is no obvious shape transformation but a size change of HA nanorods after being immersed in SBF for 1 day. Thereafter, a lot of new HA nanorods appear on the surfaces of HA-PLA modified Ta plates, after expanding the time from 1 day to 3 days and 7 days. The early mineralization property of biomaterials in one week is important for studying the bioactivity of biomaterials.40,41 After the early mineralization process, the further mineralization might induced by the resultant minerals on the surface of biomaterials but not the real surface of biomaterials. Therefore, it has been generally considered to have a good bioactivity for the biomaterials that can quickly promote the formation of hydroxyapatite on their surface in SBF.42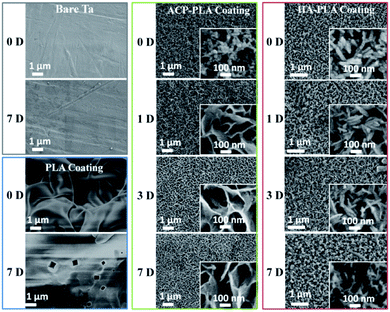 | ||
| Fig. 3 SEM micrographs of bare Ta plates, and PLA, ACP-PLA and HA-PLA modified Ta plates treated in SBF for different time. | ||
Furthermore, the mass changes of the ACP-PLA and HA-PLA modified Ta plates are measured in the process of mineralization (Fig. 4). The masses of both ACP-PLA and HA-PLA modified Ta plates do not show obvious change in first day. Then, the mass of the ACP-PLA and HA-PLA modified Ta plates increase ∼0.20 and ∼0.17 mg cm−2 after 3 days of mineralization. After expanding mineralization time to 7 days, the masses of the ACP-PLA and HA-PLA modified Ta plates continually increase ∼0.65 and ∼0.60 mg cm−2. After mineralization in SBF, the CaP nanosheets are found everywhere on the surface of ACP-PLA modified Ta plates. The transform from ACP-PLA composite to crystalline nanosheets can be explained by the crystal transformation and following crystal growth. The ACP content in the ACP-PLA can crystallize to reach a thermodynamically and chemically stable phase of HA, when the sample is immersed into SBF at 37 °C with a pH value of 7.4. In the early stage, the crystal phase of inorganic component in ACP-PLA is transformation from ACP to HA. Thereafter, the ions of calcium and phosphate in SBF can form new precipitate of HA and promote the growth of the primarily formed HA structures. The increase in mass after the mineralization for 3 and 7 days can prove the above results. As for the HA-PLA, there is no phase transformation when the samples were immersed in SBF. However, the abound ions of calcium and phosphate in the solution can form new precipitate of HA and promotes the growth of the primary HA nanorods. Therefore, the different surface morphologies of ACP-PLA and HA-PLA modified Ta plates are observed after being immersed in SBF.
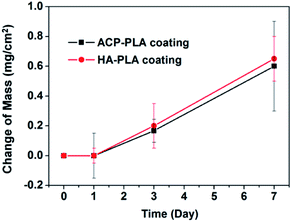 | ||
| Fig. 4 The mass changes of ACP-PLA and HA-PLA modified Ta plates versus the time of mineralization in SBF. Data are presented as mean ± standard deviation (SD), and number of replicates (n) is three. | ||
The hypothetical mechanisms of the mineralization on the surface of ACP-PLA and HA-PLA modified Ta plates in SBF are exhibited in Fig. 5. The ACP nanospheres and HA nanorods which are individually blended in the PLA play key roles of seeds for the formation of HA. The different final surface structures after mineralization can be explained by the different dominant growth of the HA crystal on the surface of ACP-PLA and HA-PLA modified Ta plates. The ACP nanospheres with an amorphous phase do not guide the direction of crystallization and crystal growth at the initial stage. Therefore, the products of spherulites composed of platelet crystallites organized in radial orientation are obtained, due to the disordered crystallization of ACP nanospheres.43 Then, the products with nanosheets structure can formed by the way of crystal growth using the abundant Ca2+ and PO43− ions in the SBF. On the other hand, the HA nanorods do not have the crystallization process. The main change of HA-PLA modified Ta plates in mineralization is the crystal growth and new formation of HA. There is a specific preferred growth direction which is along the c-axis of the hexagonal HA. Therefore HA nanorods may induce the growth direction of the new formed HA products on the surface of HA-PLA modified Ta plates.
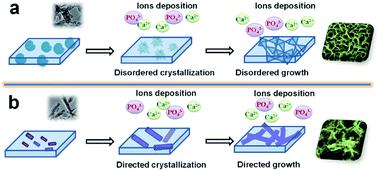 | ||
| Fig. 5 The hypothetical mechanism for the mineralization of ACP-PLA and HA-PLA modified Ta scaffolds in SBF. (a) ACP-PLA modified Ta scaffolds; (b) HA-PLA modified Ta scaffolds. | ||
Contact angles on the different surfaces of the as-prepared ACP-PLA and HA-PLA coatings on Ta plates with or without treatment of mineralization in SBF are measured using deionized water. Sharp decreased contact angles of water on ACP-PLA and HA-PLA are observed which occurred after 1 and 7 days of mineralization in SBF (Fig. 6). After the mineralization, the surface of both samples became absolutely hydrophilic, which can be well explained by the formation of porous structures of HA nanosheets and HA nanorods. The spreading of the droplet may be driven by capillary effects within porous structures of HA nanosheets and HA nanorods formed on the surface of ACP-PLA and HA-PLA after the mineralization in SBF.
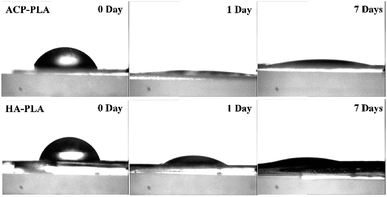 | ||
| Fig. 6 Contact angles on the surfaces of ACP-PLA and HA-PLA modified Ta plates before and after mineralization for 1 and 7 days in SBF. | ||
3.4 In vitro growth factor/BSA loading and release
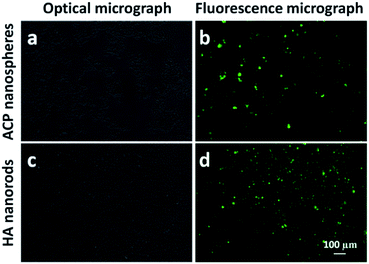
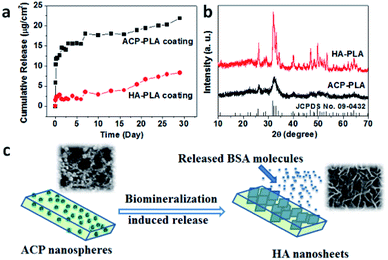
The adsorption efficiency of growth factor by ACP nanospheres and HA nanorods were studied by measure the amount of VEGF-FITC in supernatants (Fig. S1†). After centrifugal separation of VEGF-FITC-loading ACP nanospheres and HA nanorods from the solution, the supernatants were obtained and measured with a fluorescence spectrometer. The amounts of VEGF-FITC in supernatants were calculated as 1.44 μg and 1.36 μg for the loading solution of ACP nanospheres and HA nanorods, respectively. The results indicate that 5.56 μg and 5.64 μg of VEGF-FITC were adsorbed by ACP nanospheres and HA nanorods, and adsorption efficiency are 79.4% and 80.6%, respectively. The fluorescence micrographs of ACP nanospheres and HA nanorods after loading with VEGF-FITC were also obtained, which indicate a good adsorption effect of both samples (Fig. 7).Then, we also studied the drug release properties of ACP-PLA and HA-PLA coating. Firstly, the methods of fluorescence spectrum and ELISA kit have been used to investigate the release amount of VEGF at different time from these coatings. Unfortunately, it is too difficult to exactly measure the release amount of these growth factors in the medium of SBF which were released from the coatings. The amount of growth factors in ACP-PLA or HA-PLA on the surface of Ta scaffolds is very small, and the released amount of these molecules in SBF is smaller. Therefore, the typical protein molecule of BSA has been selected, which has been widely used as a drug model in the biomedical research. The sustained drug release behaviors of BSA-containing ACP-PLA and HA-PLA coatings on Ta plates are investigated in SBF at 37 °C. As the curve in Fig. 8a shown, the release rate of BSA from ACP-PLA modified Ta plates is rapid in the first 3 days, and then reduces gradually. The cumulative release account from ACP-PLA modified Ta plates reaches to 15.6, 17.6, 18.8 and 21.8 μg cm−2 at the time of 5, 10, 19 and 29 days. Meanwhile, the release rate from HA-PLA modified Ta plates is slower than ACP-PLA. The cumulative BSA release from HA-PLA modified Ta plates reaches to 2.0, 2.9, 5.4 and 8.4 μg cm−2 at the time of 5, 10, 19 and 29 days.
The above different release curves can be explained by the different structure and mineralization process on the surfaces of ACP-PLA and HA-PLA modified Ta plates. The initial rapid BSA release from the ACP-PLA modified Ta plates can be explained by the changes of structure and morphology. In the early BSA release process, the crystal phase transformation from ACP to crystalline HA occurred in SBF. In this way, the structural remodeling on the surface of the ACP-PLA modified Ta plates can lead a rapid release of BSA which is loaded by the ACP nanospheres through the adsorption. The result of XRD pattern in Fig. 8b indicates that the crystal phase of ACP-PLA has transformed from ACP to HA (JCPDS no. 09-0432) after the release process in SBF for 29 days. The hypothetical release mechanism of ACP-PLA is illustrated in Fig. 8c. On the other hand, as shown in the result of XRD (Fig. 8b), there is no obvious crystal phase change of the as-prepared HA-PLA modified Ta plates after the BSA release in SBF. The stable crystal phase may contribute to the slower BSA release. Meanwhile, the structures and morphologies of ACP nanospheres and HA nanorods are different, which may result in different surface properties and specific surface area, and may further influence on their drug release properties. It well reported that the size and specific surface area of drug carriers displays important influence on drug release properties.44,45
3.5 Cell viability
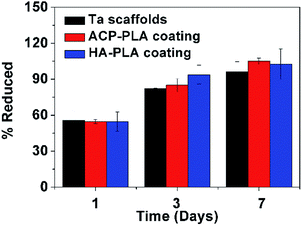
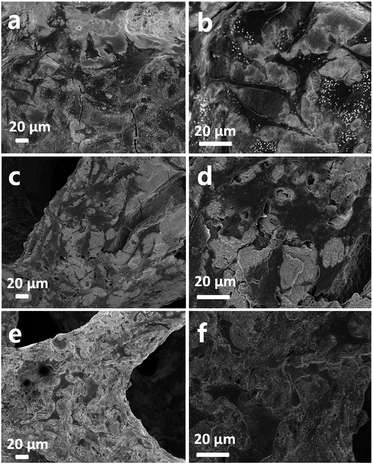
The cytotoxicity of bare Ta and ACP-PLA and HA-PLA modified Ta scaffolds are investigated using MG63 cells (Fig. 9). The alamarBlue™ assay reveals that there is essentially no toxicity when the cells are cultured on bare Ta, ACP-PLA and HA-PLA modified porous Ta scaffolds. On the first day, the difference of the cell viabilities among these samples is not obvious. With increasing culturing time from 1 day to 3 days and 7 days, the viabilities of MG63 cells are higher. The experimental results indicate that MG63 cells grow well on ACP-PLA and HA-PLA modified porous Ta scaffolds.The SEM micrographs of MG63 cells seeded on the bare Ta scaffolds, ACP-PLA and HA-PLA modified porous Ta scaffolds after culture for 3 days are shown in Fig. 10. The magnified SEM micrographs in Fig. 10a–d indicate a good state of MG63 cells. The cells are better attaching and spreading on the surface of the ACP-PLA and HA-PLA modified porous Ta scaffolds than the bare Ta scaffolds. The antenna-like parts of the MG63 cells are observed on the surface of ACP-PLA and HA-PLA modified porous Ta scaffolds, indicating a good interconnection between the cells and ACP-PLA and HA-PLA modified porous Ta scaffolds.
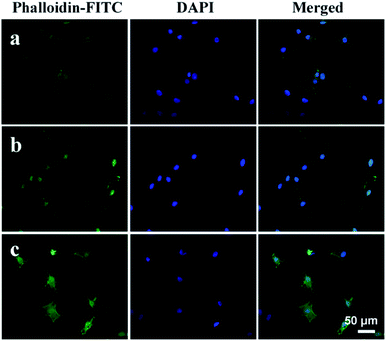
Moreover, the spreading behavior of MG63 cells cultured on the as-prepared ACP-PLA and HA-PLA modified Ta scaffolds are investigated by CLSM (Fig. 11), after culturing for 48 h. The bare Ta plates are used as the control samples. The actin cytoskeletons are labeled in green by phalloidin-FITC, and the cell nuclei are stained in blue by DAPI. As shown in the Fig. 11, many cells with filopodia on the ACP-PLA and HA-PLA modified Ta plates can be observed. The result indicates that the ACP-PLA and HA-PLA modified Ta exhibits excellent properties on cell spreading, because of the MG63 cells appear cytoplasmic extensions and filopodia attachments, which is the typical morphology of osteoblast. For the control sample of bare Ta scaffolds (Fig. 11c), MG63 cells also appear good typical morphology of osteoblast, after being seeded for 48 h. These results indicate that bare Ta scaffolds, the as-prepared ACP-PLA and HA-PLA modified Ta scaffolds have good properties on cell spreading.
3.6 In vivo investigation of subchondral bone defect repair
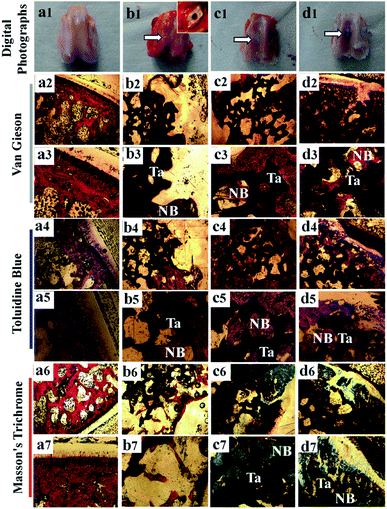
The preliminary in vivo experiments have been carried out to evaluate the bone defect repair performance of the samples. All experimental animals are healthy with free movable joints, after implanting the two kinds of modified Ta scaffolds and bare Ta scaffolds for 12 weeks. Comparing to healthy femoral trochlear groove (Fig. 12a1), the defective femoral trochlear grooves in experimental groups are well repaired with smooth surfaces after being grafted with bare Ta and two kinds of modified porous Ta scaffolds (Fig. 12b1–d1), indicating that the bare Ta, and two kinds of modified Ta scaffolds can promote the bone defect repair.The photomicrographs of bone slices with Van Gieson, Toluidine blue and Masson's trichrome staining, as well as the control groups of healthy bone tissue are exhibited in Fig. 12. As the results in Fig. 12c3 and d3 shown, new collagen constituent can be observed in two kinds of modified porous Ta scaffolds. The bone cells can migrate and grow well in the porous Ta scaffolds. The photomicrographs of Toluidine blue (Fig. 12c4, d4, c5 and d5) and Masson's trichrome (Fig. 12c6, d6, c7 and d7) staining also show much deposition of extracellular bone-like matrix on the surface and internal space of ACP-PLA modified porous Ta scaffolds and HA-PLA modified porous Ta scaffolds. The cell nuclei have been stained as black dots in the photomicrographs, and the collagen constituents have been stained with bluish green color. Comparing with the bare Ta scaffold (Fig. 12b2–b7), the amount of cells and collagen constituent on the ACP-PLA and HA-PLA modified porous Ta scaffolds are more obvious, which indicate good properties for bone defect repair. Meanwhile, the new bone tissue and bone linking in the defect area of the control group is scanty after surgical operation for 12 weeks. These results indicate that the amounts of the new bone tissue and many callus bridges are similar in both modified porous Ta scaffold, which are better than that in bare porous Ta scaffold.
4. Conclusions
The ACP nanospheres and HA nanorods are prepared and used with PLA polymer to modify Ta scaffolds. The effects of ACP nanospheres and HA nanorods on the mineralization, drug release, cytotoxicity and in vivo bone defect repair have been investigated. In the process of mineralization, the structures of HA nanosheets and HA nanorods are respectively observed on the surfaces of ACP-PLA and HA-PLA modified Ta plates. The ACP and HA play a key role of seed to guide the crystal growth of minerals. Meanwhile, after the mineralization, the surface of ACP-PLA and HA-PLA coating become absolutely hydrophilic. The in vitro BSA release rate of ACP-PLA modified Ta scaffolds is much faster than HA-PLA modified Ta scaffolds, which can be explained by the crystal phase transformation from ACP to HA and the crystallization process. The MG63 cells show good viability and adhesion/spreading behavior on the ACP-PLA and HA-PLA modified porous Ta scaffolds. In the in vivo experiment, much of new bone tissues have been observed in the ACP-PLA and HA-PLA modified porous Ta scaffolds, indicating a good potential application of these materials in bone defect repair.Conflicts of interest
There are no conflicts to declare.Acknowledgements
The financial support from the National Natural Science Foundation of China (31771081, 81171727), the Science and Technology Commission of Shanghai Municipality (18ZR1445100, 19441901900, 19ZR1439700), and S&T Innovation 2025 Major Special Programme of Ningbo (2018B10040) is gratefully acknowledged.Notes and references
- T. Garg and A. K. Goyal, Expert Opin. Drug Delivery, 2014, 11, 767–789 CrossRef CAS PubMed.
- J. M. Holzwarth and P. X. Ma, Biomaterials, 2011, 32, 9622–9629 CrossRef CAS PubMed.
- M. A. Fernandez-Yague, S. A. Abbah, L. McNamara, D. I. Zeugolis, A. Pandit and M. J. Biggs, Adv. Drug Delivery Rev., 2015, 84, 1–29 CrossRef CAS PubMed.
- A. El-Ghannam, Expert Rev. Med. Devices, 2005, 2, 87–101 CrossRef PubMed.
- V. Kesireddy and F. K. Kasper, J. Mater. Chem. B, 2016, 4, 6773–6786 RSC.
- N. Ramesh, S. C. Moratti and G. J. Dias, J. Biomed. Mater. Res., Part B, 2018, 106, 2046–2057 CrossRef CAS PubMed.
- J. D. Bobyn, G. J. Stackpool, S. A. Hacking, M. Tanzer and J. J. Krygier, J. Bone Jt. Surg., Br. Vol., 1999, 81B, 907–914 CrossRef.
- R. M. Meneghini, D. G. Lewallen and A. D. Hanssen, J. Bone Jt. Surg., Am. Vol., 2008, 90, 78–84 CrossRef PubMed.
- Y. Minoda, A. Kobayashi, M. Ikebuchi, H. Iwaki, F. Inori and H. Nakamura, J. Arthroplasty, 2013, 28, 1760–1764 CrossRef PubMed.
- K. Rezwan, Q. Z. Chen, J. J. Blaker and A. R. Boccaccini, Biomaterials, 2006, 27, 3413–3431 CrossRef CAS PubMed.
- E. Verron, J. M. Bouler and J. Guicheux, Acta Biomater., 2012, 8, 3541–3551 CrossRef CAS PubMed.
- S. V. Dorozhkin, Acta Biomater., 2010, 6, 4457–4475 CrossRef CAS PubMed.
- A. K. Bembey, A. J. Bushby, A. Boyde, V. L. Ferguson and M. L. Oyen, J. Mater. Res., 2006, 21, 1962–1968 CrossRef CAS.
- M. Tzaphlidou, J. Biol. Phys., 2008, 34, 39–49 CrossRef CAS PubMed.
- S. Weiner and H. D. Wagner, Annu. Rev. Mater. Sci., 1998, 28, 271–298 CrossRef CAS.
- M. A. Rubin, L. Jasiuk, J. Taylor, J. Rubin, T. Ganey and R. P. Apkarian, Bone, 2003, 33, 270–282 CrossRef PubMed.
- V. Uskokovic and D. P. Uskokovic, J. Biomed. Mater. Res., Part B, 2011, 96B, 152–191 CrossRef CAS PubMed.
- M. Motskin, D. M. Wright and K. Muller, et al., Biomaterials, 2009, 30, 3307–3317 CrossRef CAS PubMed.
- C. Qi, Y. J. Zhu and X. Y. Zhao, et al., Chem.–Eur. J., 2013, 19, 981–987 CrossRef CAS PubMed.
- Q. W. Fu, Y. P. Zi and W. Xu, et al., Int. J. Nanomed., 2016, 11, 5087–5097 CrossRef CAS PubMed.
- Z. F. Zhou, T. W. Sun and F. Chen, et al., Biomaterials, 2017, 121, 1–14 CrossRef CAS PubMed.
- F. Chen, C. Li, Y. J. Zhu, X. Y. Zhao, B. Q. Lu and J. Wu, Biomater. Sci., 2013, 1, 1074–1081 RSC.
- F. Chen, P. Huang, Y. J. Zhu, J. Wu, C. L. Zhang and D. X. Cui, Biomaterials, 2011, 32, 9031–9039 CrossRef CAS PubMed.
- E. I. Altinoglu, T. J. Russin and J. M. Kaiser, et al., ACS Nano, 2008, 2, 2075–2084 CrossRef CAS PubMed.
- R. Ravichandran, J. R. Venugopal, S. Sundarrajan, S. Mukherjee and S. Ramakrishna, Biomaterials, 2012, 33, 846–855 CrossRef CAS PubMed.
- H. L. Oliveira, W. L. O. Da Rosa and C. E. Cuevas-Suarez, et al., Calcif. Tissue Int., 2017, 101, 341–354 CrossRef CAS PubMed.
- H. B. Wen, R. A. J. Dalmeijer, F. Z. Cui, C. A. Van Blitterswijk and K. De Groot, J. Mater. Sci. Lett., 1998, 17, 925–930 CrossRef CAS.
- R. Zhou, W. Xu and F. Chen, et al., Colloids Surf., B, 2014, 123, 236–245 CrossRef CAS PubMed.
- K. Mediaswanti, C. Wen and E. P. Ivanova, et al., Int. J. Surf. Sci. Eng., 2014, 8, 255–263 CrossRef CAS.
- D. Naskar, A. K. Ghosh, M. Mandal, P. Das, S. K. Nandi and S. C. Kundu, Biomaterials, 2017, 136, 67–85 CrossRef CAS PubMed.
- F. Chen, P. Huang, Y. J. Zhu, J. Wu and D. X. Cui, Biomaterials, 2012, 33, 6447–6455 CrossRef CAS PubMed.
- T. Kokubo, H. Kushitani, S. Sakka, T. Kitsugi and T. Yamamuro, J. Biomed. Mater. Res., 1990, 24, 721–734 CrossRef CAS PubMed.
- T. Kokubo and H. Takadama, Biomaterials, 2006, 27, 2907–2915 CrossRef CAS PubMed.
- G. Wang, X. Liu, J. Gao and C. Ding, Acta Biomater., 2009, 5, 2270–2278 CrossRef CAS PubMed.
- S. G. Deng, J. M. Cao and J. Feng, et al., J. Phys. Chem. B, 2005, 109, 11473–11477 CrossRef CAS PubMed.
- Y. Fan, Z. Sun and J. Moradian-Oldak, Biomaterials, 2009, 30, 478–483 CrossRef CAS PubMed.
- M. P. Prabhakaran, J. Venugopal and S. Ramakrishna, Acta Biomater., 2009, 5, 2884–2893 CrossRef CAS PubMed.
- J. H. Tao, H. H. Pan and J. R. Wang, et al., J. Phys. Chem. C, 2008, 112, 14929–14933 CrossRef CAS.
- H. Zhang, Q. W. Fu and T. W. Sun, et al., Colloids Surf., B, 2015, 136, 27–36 CrossRef CAS PubMed.
- N. Rauner, M. Meuris, M. Zoric and J. C. Tiller, Nature, 2017, 543, 407–410 CrossRef CAS PubMed.
- N. Cozza, F. Monte, W. Bonani, P. Aswath, A. Motta and C. Migliaresi, J. Tissue Eng. Regener. Med., 2018, 12, 1131–1142 CrossRef PubMed.
- C. T. Wu, J. Chang and Y. Xiao, Advanced bioactive inorganic materials for bone regeneration and drug delivery, CRC Press and Taylor & Francis, 2013 Search PubMed.
- H. Pan, X. Y. Liu, R. Tang and H. Y. Xu, Chem. Commun., 2010, 46, 7415–7417 RSC.
- S. A. A. Rizvi and A. M. Saleh, Saudi Pharm. J., 2018, 26, 64–70 CrossRef PubMed.
- G. J. Dawes, L. E. Fratila-Apachitei and K. Mulia, et al., J. Mater. Sci.: Mater. Med., 2009, 20, 1089–1094 CrossRef CAS PubMed.
Footnotes |
| † Electronic supplementary information (ESI) available. See DOI: 10.1039/c9ra09385k |
| ‡ These authors contributed equally to this work. |
| This journal is © The Royal Society of Chemistry 2020 |

