DOI:
10.1039/C9RA08904G
(Paper)
RSC Adv., 2020,
10, 2191-2197
Preparation of porous Co3O4 and its response to ethanol with low energy consumption†
Received
29th October 2019
, Accepted 6th January 2020
First published on 10th January 2020
Abstract
Co3O4 is a promising p-type semiconductor for ethanol detection. In this work, ethanol detection sensors were fabricated with nanostructured Co3O4, which exhibited higher selectivity and lower operating temperature. The Co3O4 was synthesised using ZIF-67 as a sacrificial precursor. The T400-Co3O4 that was obtained by calcining ZIF-67 at 400 °C showed the best sensing performance. Its response to 100 ppm ethanol vapor was 221.99 at a low optimal operating temperature (200 °C). Moreover, T400-Co3O4 achieved a low detection limit (1 ppm), remarkable repeatability, and higher selectivity compared to ammonia, carbon monoxide, acetone, hydrogen, methane, methanol, and nitrogen dioxide. The enhanced sensing performance was mainly attributed to three factors: (1) the adsorption/desorption of active adsorbed oxygen molecules (e.g. O− and O2−) and abundant oxygen vacancies, which increased the number of active sites; (2) the catalytic activity of Co3+, which greatly increased the reaction route and decreased the activation energy; and (3) the effective diffusion of gas molecules, which increased the effect of collisions between gas molecules and the material surface. This work provides an effective means to fabricate sensitive ethanol gas sensors with low energy consumption.
1. Introduction
Ethanol detection is widely used in fields such as food quality testing, transportation safety, and the chemistry industry. Gas sensors, especially metal-oxide-based semiconductor gas sensors (MOS gas sensor), are commonly used in toxic gas detection because they have low cost, high response values, and high stability.1,2 However, commercial MOS experience low selectivity and high energy consumption.3 Metal oxides are critical factors in enhancing the sensing properties of MOS gas sensors. Metal oxides with the right pore size increase the response value and decrease the response/recovery time because they have more exposed active sites and higher gas molecule diffusion.4
Metal–organic frameworks (MOFs) are excellent gas adsorption/desorption materials because of a high specific surface area, tailorable pore structure, and catalytic activity.5,6 Considering these advantages, MOFs and MOFs-derived materials are extensively used in gas detection. MOFs-derived porous metal oxides are suitable gas-sensitive materials because of their similar structural and physicochemical properties to MOFs. For example, ZnO nanocages were prepared by direct pyrolysis of MOF-5, and it could detect low-concentration VOCs.7 The composite like ZnO/Co3O4 was synthesised by pyrolysis of MOFs precursors, and it exhibited remarkable sensing properties to acetone at the ppb–ppm level.8 The Co, Zn-based MOFs-derived Co3O4/ZnO also showed great response and selectivity properties to HCHO at low operating temperatures.9
As for the ethanol gas sensor, Table 1 compares the ethanol sensing performance of existing materials to the Co3O4 in this work. Among these metal oxides, n-type semiconductors (e.g. ZnO, WO3, and SnO2) are common ethanol sensing materials with a high response value and excellent stability.11,12,14–17 However, the operating temperature of these n-type semiconductors is usually high (250 to 500 °C), which leads to a higher energy consumption. On the contrary, a p-type semiconductor like Co3O4 shows a lower operating temperature (150 to 250 °C) than n-type semiconductors, and its baseline is more stable.10,13 Although p-type semiconductors suffer from a lower response value and longer response/recovery time, they are a possible ethanol sensing material using morphological control.9,12 Co3O4 is a type of transition metal oxide and Co containing various states (e.g. Co2+ and Co3+). The redox process between Co2+ and Co3+ leads to a more natural adsorbing process of oxygen and ethanol molecules. Thus, Co3O4 with a large surface area, abundant active sites, and suitable pore size is considered as a probable ethanol sensing material. Especially, Lü et al.18 synthesised porous Co3O4 concave nanocubes with a high specific surface by calcining ZIF-67 at 300 °C. This porous Co3O4 shows a low detection limitation (10 ppm), and its response to 200 ppm ethanol is about 3.3 at 300 °C. The synthesis ratio of the metal and precipitant and heating rate significantly affects the morphology of the precursor and Co3O4. Furthermore, the pore size is also a critical factor for sensing performance. Thus, factors such as the heating temperature in the synthesis process, and the pore size of Co3O4 have to be considered.
Table 1 Comparison of ethanol gas-sensing performance based on different sensor material reported in the literature
| Material |
Morphology |
Operating temperature (°C) |
Concentration (ppm) |
Response |
Ref. |
| Co3O4 |
Nanorod |
160 |
500 |
70.7 |
10 |
| SnO2 |
Hollow spheres |
350 |
100 |
10.5 |
11 |
| ZnO |
Nanorod |
400 |
100 |
149.2 |
12 |
| Co3O4/rGO |
Layer-by-layer nanocomposites |
200 |
100 |
21 |
13 |
| ZnO/Co3O4 |
Core–shell structure |
200 |
100 |
38.87 |
14 |
| ZnO@ZIF-8 |
Core–shell microspheres |
160 |
100 |
35.9 |
15 |
| Au–WO3 |
Nanoplatelets |
320 |
100 |
97.2 |
16 |
| Pt–In2O3 |
Cubic |
250 |
100 |
32.6 |
17 |
| Commercial Co3O4 |
Nanomaterial |
200 |
100 |
15.5 |
This work |
| T400-Co3O4 |
Polyhedral structure |
200 |
100 |
221.99 |
This work |
Herein, porous Co3O4 with different pore sizes was synthesised by temperature-controlled decomposition of MOFs (ZIF-67) precursors. The porous Co3O4 exhibited enhanced sensing properties for ethanol at 200 °C, indicating that a MOFs-derived material is suitable for developing a gas sensing material with a high response value and short response/recovery time.
To investigate the sensing performance and examine the sensing mechanism, the obtained Co3O4 was examined by X-ray diffraction (XRD), Raman spectroscopy, scanning electron microscopy (SEM), transmission electron microscopy (TEM), N2 adsorption–desorption analysis (BET), energy-dispersive X-ray spectroscopy (EDS), and X-ray photoelectron spectroscopy (XPS). The obtained results were useful to understand the sensing mechanism of Co3O4 and contributed to expanding the ethanol sensing material.
2. Materials and methods
2.1 Material preparation
The synthesis of ZIF-67 precursors was referenced by previous literature.19 In a typical synthesis, 6 mmol Co(NO3)2·6H2O (99%, Aladdin Bio-Chem Technology Co., Ltd) was dissolved into a 40 mL methanol/ethanol (1/1 in v/v) mixed solvent to form solution A. 24 mmol 2-methylimidazole (2-MI, 98%, Aladdin Bio-Chem Technology Co., Ltd) was dissolved in another 40 mL methanol/ethanol (1/1 in v/v) mixed solvent to form solution B. Then, solution A was poured in solution B with vigorous stirring and formed purple precipitation. The solution was stirred for 10 minutes and suspended to stew at room temperature for 24 h. The purple precipitation was then filtered and washed by ethanol, and then dried at 60 °C overnight. The obtained purple precipitation was collected as a precursor, and the final Co3O4 was synthesised by a temperature-controlled decomposition with a heating rate of 2 °C min−1. The decomposition temperatures were 300, 350, 400, 450, and 500 °C, respectively. When heated to the decomposition temperature, the samples were kept for 2 h in the atmosphere to cool naturally. The final samples were named as T300-Co3O4, T350-Co3O4, T400-Co3O4, T450-Co3O4, and T500-Co3O4, respectively. Additionally, commercial Co3O4 was purchased from Aladdin Bio-Chem Technology Co., Ltd (100 nm, 99.5%) as a reference material.
2.2 Physicochemical characterisation and gas detection
The crystallinity information of the samples was characterised by XRD on a D/max-2500/PC X-ray diffractometer (Rigaku, Japan) with Cu-Kα radiation and 2θ with a range of 5° to 90°. A Raman study was carried out with the use of Renishaw RM2000 (Britain). The morphology and nanostructure of samples were tested by SEM (S-4800, Hitachi, Japan) and TEM (Tecnai G2 F30 S-Twin, FEI, USA). The channel information and specific surface areas of samples were measured by BET (ASAP 3020, Micromeritics, USA) at 77 K. The element contents and valence states on the sample surface were obtained by XPS (ESCALAB 250 XI, Thermo, USA). Furthermore, the binding energy of the XPS analysis was referenced to C 1s at 284.8 eV.
The gas sensing properties were analysed on a JF02F dynamic gas sensing analysis system (Guiyan Jinfeng Technology Co., Kunming, China). Before testing, the prepared Co3O4 was first dispersed in ethanol and dropped on the testing ceramic substrate, which has a pair of Ag electrodes. The mass of the loading Co3O4 was fixed, and the testing substrate was then transferred to the test chamber. The test substrate was heated to the operating temperature by a heating platform. The response value of the Co3O4 is defined as Rg/Ra, where Rg and Ra represent the resistances of the sample in the target gas and air, respectively. The response time is defined as the time for sensor resistance to reach 90% of the final state, while the recovery time is the time needed for the sensor to return to 10% of the total resistance change. The details of the test are shown in Fig. S1.†
3. Results and discussion
3.1 Gas sensing properties
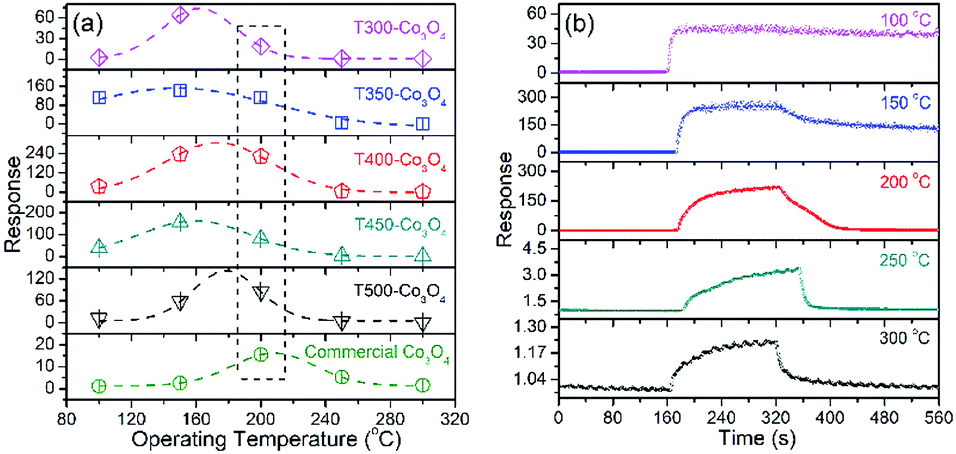
The Co3O4 sensing performance was tested by exposing the sensors to ethanol vapor and air. Fig. 1a shows the responses of Co3O4 to different operating temperatures (100 to 300 °C). The response values of T300-Co3O4, T350-Co3O4, T400-Co3O4, and T450-Co3O4 increase with an increase in the operating temperature and reach a maximum value at 150 °C. Moreover, the optimal operating temperature of T500-Co3O4 is 200 °C. The fitting curves of these Co3O4 samples show that the optimal operating temperature ranges from 150 to 200 °C. However, the resistance of the sensor cannot restore to the original value when the operating temperature is below 200 °C (Fig. 1b), and it might be related to the pore structures and the exclusion of adsorbed gas molecules.20 Furthermore, the response of commercial Co3O4 is 15.45 to 100 ppm ethanol at 200 °C, which was much lower than the MOF-derived Co3O4 samples. Considering the good performance of the sensors at 200 °C, subsequent investigations are focused on T400-Co3O4. The dynamic curves resistance are shown in Fig. S2.†
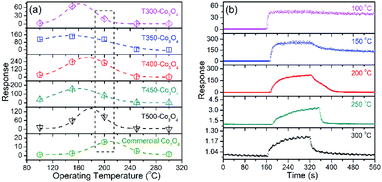 |
| | Fig. 1 (a) Response to ethanol (100 ppm) of Co3O4 samples under various operating temperatures, and (b) the response/recovery curve of T400-Co3O4 to 100 ppm ethanol at different operating temperature. | |
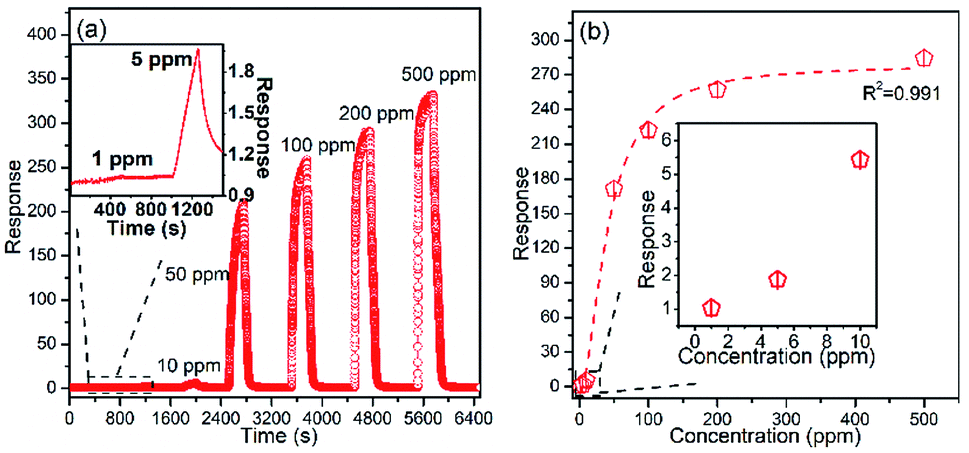
Fig. 2a shows the dynamic response/recovery curve of T400-Co3O4. The sensor resistance increases upon exposure to ethanol, while it decreases when the sensor is exposed to air. The response of T400-Co3O4 continuously increases with increasing ethanol concentration, which can be ascribed to the rich active sites for ethanol detection. The response values of T400-Co3O4 are 1.03, 1.87, 5.43, and 171.20 for 1, 5, 10, 50 ppm of ethanol vapor (Fig. 2b). The rapid response values increase at 50 ppm ethanol. For a higher ethanol concentration, the response values are 221.99, 256.97, and 284.07 for 100, 200, and 500 ppm ethanol vapor, respectively, which indicate the abundant active sites of T400-Co3O4 on the available surface.
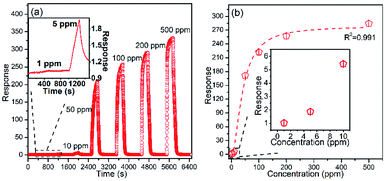 |
| | Fig. 2 (a) Dynamic response/recovery curves, and (b) response values of T400-Co3O4 to different ethanol concentrations (1–500 ppm) at 200 °C. | |
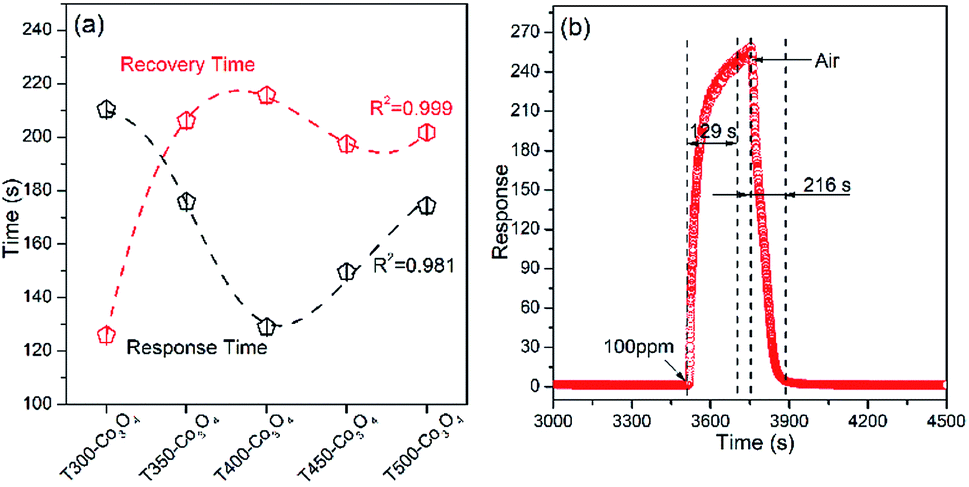
The response/recovery time is another crucial parameter for the gas sensor. As shown in Fig. 3a, the response time of Co3O4 decreases with increasing calcination temperature until 400 °C. Then, the response time increases with a further rise (e.g. from 450 to 500 °C) in calcination temperature, which might contribute to structural changes. The response time is significantly related to the pore structure, specific surface area and operating temperature. The recovery time is complicated because it needs to consider the detection process and band bending.21,22 The response and recovery times of the T400-Co3O4 are 129 and 216 s, respectively (Fig. 3b).
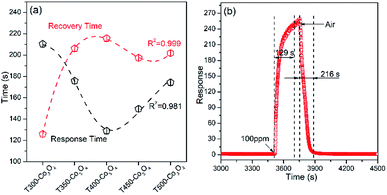 |
| | Fig. 3 (a) Response time/recovery time of Co3O4, and (b) dynamic curves of T400-Co3O4 upon exposure to 100 ppm ethanol at 200 °C. | |
The repeatability and stability of T400-Co3O4 is shown in Fig. 4a. A rapid response loss is seen in first 7 days, followed by slight decrease in response in the subsequent 21 days. The reason might be due to the further oxidation of Co and the agglomerate of the nanostructure.23 In addition, the dynamic curves of T400-Co3O4 are almost at the same level after 6 cycles at 200 °C, showing significant repeatability and reversibility. As for selectivity, the response of T400-Co3O4 and commercial Co3O4 to various target gases is investigated at 200 °C (Fig. 4b). The response value of T400-Co3O4 to 100 ppm ethanol (221.99) is higher than the response to acetone (74.05), methanol (87.22), methane (5.67), ammonia (3.10), carbon monoxide (5.61), and hydrogen (8.37) under the same conditions. The response value of commercial Co3O4 to various target gases is lower than T400-Co3O4, and it shows a high response to ethanol, methanol and acetone. The results demonstrate that the T400-Co3O4 is sensitive to specific functional groups (e.g. Hydroxyl and Carbonyl), which might be related to the variable valence characteristics of cobalt and its redox process.
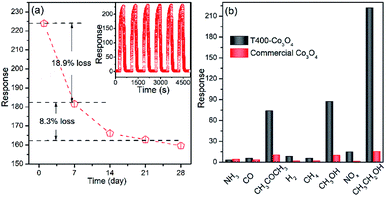 |
| | Fig. 4 (a) Dynamic curves to ethanol (100 ppm), and (b) selectivity to various gases (100 ppm) of T400-Co3O4 at 200 °C. | |
3.2 Physicochemical characteristics
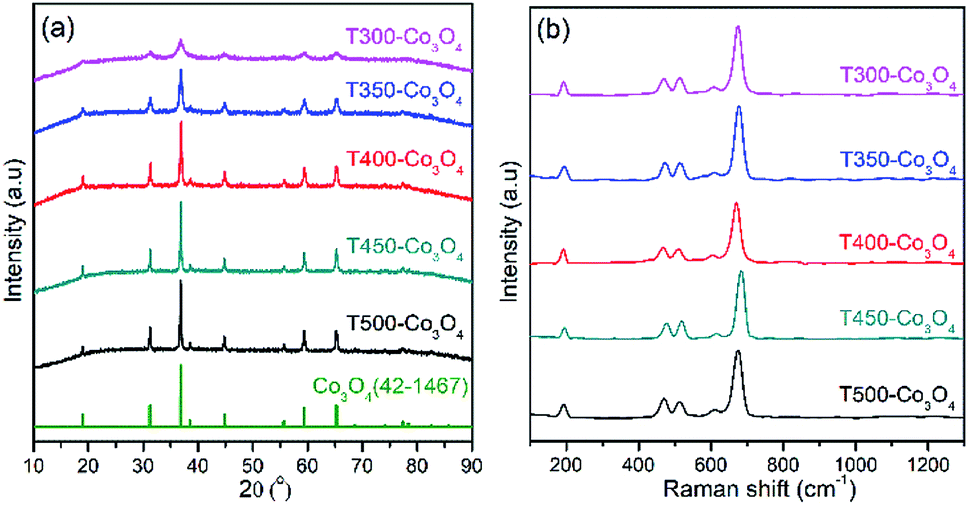
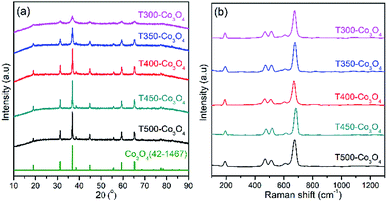
XRD and Raman spectra determine the structure and composition of the Co3O4 sample. As shown in Fig. 5a, all diffraction peaks of the Co3O4 XRD patterns are well indexed to spinel-type phase Co3O4 (JCPDS card no. 42-1467). Furthermore, the relative intensity of the Co3O4 diffraction peak increases with increasing calcination temperature, indicating that the crystallinity of the samples is improved.
 |
| | Fig. 5 (a) XRD patterns, and (b) Raman spectra of Co3O4 samples. | |
The Raman spectra of Co3O4 samples are shown in Fig. 5b, and Table 2 lists the experimental results of the position of the Co3O4 samples. The Raman bands at 191, 465, 511, 608 and 670 cm−1 of the T400-Co3O4 are Raman active peaks24,25 (e.g. F2g, Eg, and A1g). These five active Raman peaks indicate that the spinel structure of Co3O4, which is in agreement with the XRD results.
Table 2 Positions of Raman peaks for Co3O4 samples
| Sample |
F2g (cm−1) |
Eg (cm−1) |
F2g (cm−1) |
F2g (cm−1) |
A1g (cm−1) |
| T300-Co3O4 |
192.9 |
469.9 |
513.7 |
607.9 |
673.9 |
| T350-Co3O4 |
193.7 |
472.9 |
514.0 |
611.8 |
676.7 |
| T400-Co3O4 |
191.2 |
466.8 |
510.6 |
606.4 |
669.6 |
| T450-Co3O4 |
194.5 |
476.7 |
518.3 |
616.4 |
682.3 |
| T500-Co3O4 |
192.4 |
469.5 |
513.1 |
618.8 |
673.9 |
Furthermore, stronger and sharper red-shifted Raman peaks are related to the size-dependent effect on the nanoparticles.26 T400-Co3O4 shows the narrow peaks slightly red-shifted compared to the other samples, showing the smaller particle size of T400-Co3O4.
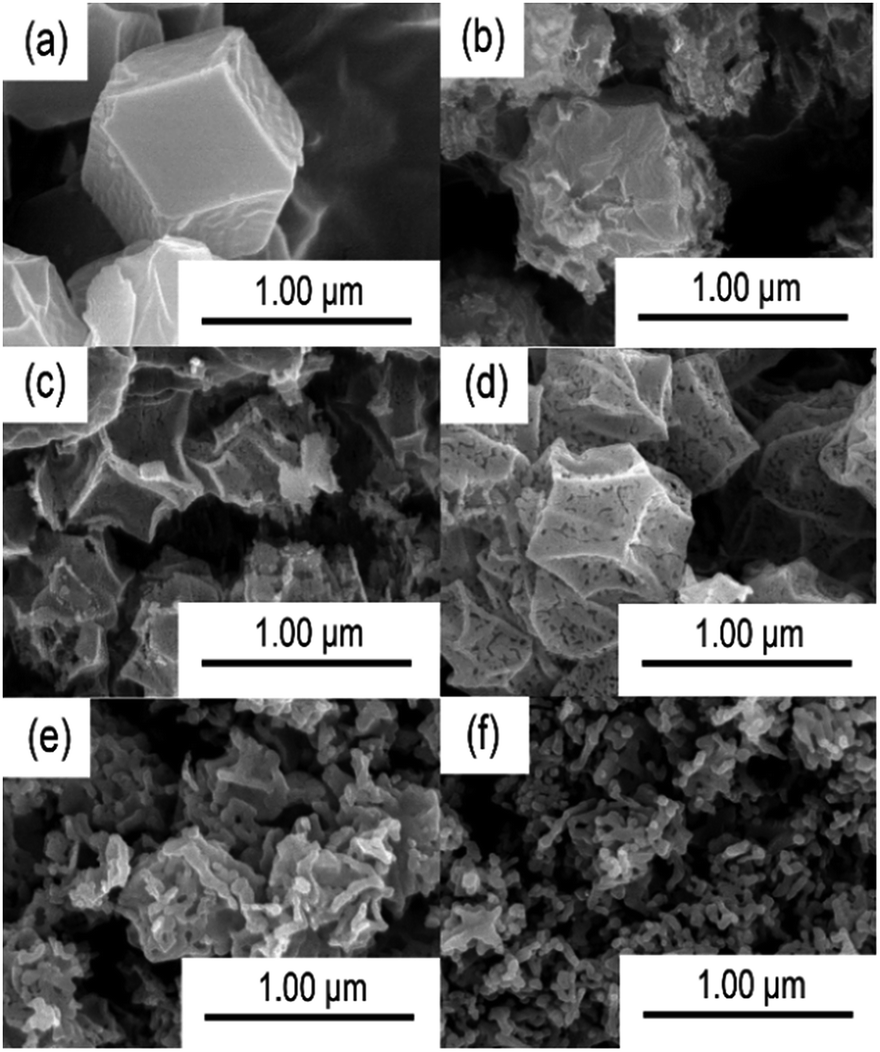
The morphologies of ZIF-67 and Co3O4 with different calcination temperatures were investigated by SEM, TEM and HRTEM (Fig. 6 and S3†). Fig. 6a shows the SEM image of ZIF-67 and it shows a typical rhombic dodecahedron structure. The obtained Co3O4 maintains similar polyhedral shape with ZIF-67 within a calcination temperature range of 300 to 400 °C, while the surface of these samples becomes rough and broken, which might be due to the decomposition of the organic ligand. In addition, the surface of T400-Co3O4 shows more holes and crevices than T300-Co3O4 and T350-Co3O4. When the calcination temperature further rises to 500 °C, the polyhedral structure is collapsed and forms an interconnected net-work structure (Fig. 6b–f). Fig. S3a and b† are the TEM and HRTEM images of T400-Co3O4. The obtained T400-Co3O4 with a polyhedral structure is comprised of nanorods and the powder is stacked together. The basic units of polyhedral T400-Co3O4 are nanorods with a uniform diameter of about 40 nm. The HRTEM image exhibits the lattice fringes with lengths of 0.24 nm, which index to the (311) planes of Co3O4. Furthermore, the absence of amorphous carbon indicates the completed decomposition of the ZIF-67 precursor.
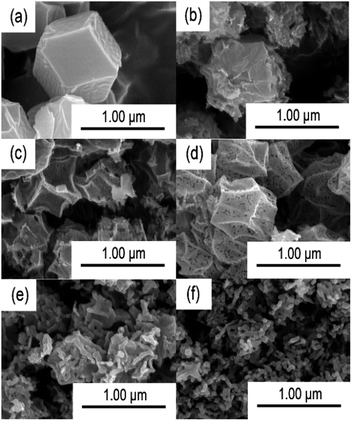 |
| | Fig. 6 SEM images of (a) ZIF-67, (b) T300-Co3O4, (c) T350-Co3O4, (d) T400-Co3O4, (e) T450-Co3O4, (f) T500-Co3O4. | |
The N2 adsorption–desorption isotherm and pore size distribution of ZIF-67 and Co3O4 are shown in Fig. 7, while BET specific surface area, pore size and pore volume of the samples are listed in Table 3. The N2 adsorption–desorption isotherm of ZIF-67 is a type I curve, while Co3O4 samples are type IV with an H3 hysteresis loop, which indicates the existence of slit holes. As shown in Table 3, the specific surface area and pore volume of Co3O4 decrease with increasing calcination temperature. Notably, the specific surface area and pore volume of T500-Co3O4 is sharply reduced as compared to other Co3O4 samples, indicating that the total mutation of the structure, which corresponds to the results of the SEM image. For the pore size, T400-Co3O4 shows the largest pore size among these Co3O4 samples, which is suitable for the diffusion of ethanol gas molecules.
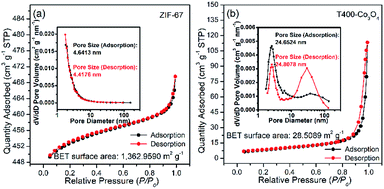 |
| | Fig. 7 N2 adsorption–desorption isotherms, and pore size distributions of (a) ZIF-67, and (b) T400-Co3O4. | |
Table 3 The specific surface area, pore volume and pore size of Co3O4 samples
| Sample |
Specific surface area (m2 g−1) |
Pore volume (cm3 g−1) |
Pore size (nm) |
| ZIF-67 |
1362.959 |
0.043 |
4.418 |
| T300-Co3O4 |
118.475 |
0.411 |
11.654 |
| T350-Co3O4 |
51.474 |
0.345 |
22.866 |
| T400-Co3O4 |
28.509 |
0.176 |
24.808 |
| T450-Co3O4 |
16.144 |
0.103 |
21.996 |
| T500-Co3O4 |
4.341 |
0.021 |
14.566 |
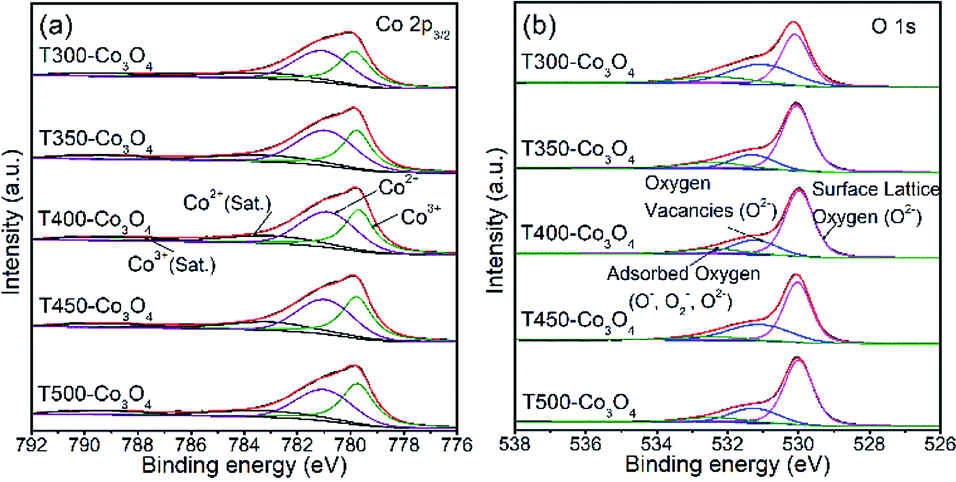
XPS analysis was performed to confirm the valence states of the elements on the surface of the samples (Fig. 8 and S4†). Fig. 8a shows the Co 2p3/2 XPS spectra. The peaks at 779.6–779.9 eV can be attributed to Co3+, while peaks at 780.8–781.1 eV are attributed to Co2+. The satellite peaks of Co3+ and Co2+ have binding energies of 788.8–789.1 eV and 783.0–784.3 eV, respectively.27,28 Particularly, the Co content of Co3O4 initially increases with increasing calcination temperature until 400 °C and then decrease at 400 to 500 °C. The T400-Co3O4 has the highest Co content of 29.43%. Additionally, the Co3+ content of T500-Co3O4 and T400-Co3O4 is 10.63% and 10.32%, respectively, which is higher than other Co3O4 samples (Table 4). Fig. 8b shows the O 1s spectra. The O 1s XPS spectra of Co3O4 samples can be deconvoluted into three peaks, which are assigned to surface lattice oxygen (530.0–530.1 eV), oxygen vacancies (531.1–531.3 eV), and chemisorbed oxygen species (532.3–532.5 eV).18,29 Table S1† is the amount of oxygen with different O species of the Co3O4. Generally, the response of the sensing material is significantly related to the oxygen vacancies. However, the numbers of oxygen species are determined by the oxide species.29 Thus, the numbers of oxygen species, especially oxygen vacancies, of these samples are almost the same in quantity.
 |
| | Fig. 8 (a) Co 2p3/2, and (b) O 1s XPS spectra of Co3O4 samples. | |
Table 4 Amount (at%) of Co with different valence states in Co3O4 samples
| Sample |
Co |
Co(III) |
Co(II) |
Co(II) (satellite) |
Co(III) (satellite) |
| T300-Co3O4 |
25.74 |
9.42 |
10.94 |
3.53 |
1.85 |
| T350-Co3O4 |
28.6 |
9.68 |
12.51 |
4.21 |
2.20 |
| T400-Co3O4 |
29.43 |
10.32 |
11.66 |
4.94 |
2.50 |
| T450-Co3O4 |
27.07 |
9.64 |
10.18 |
5.26 |
1.99 |
| T500-Co3O4 |
26.71 |
10.63 |
9.91 |
4.01 |
2.15 |
3.3 Gas-sensing mechanism
The common sensing mechanism is based on gas adsorption and desorption. For Co3O4, a typical p-type semiconductor, oxygen molecules are adsorbed on the surface of the material in air and forms adsorbed oxygen species (e.g. O−, O2−, and O2−). O2 molecules cannot exist on a material surface in an undissociated state.30 Oxygen molecules will be ionised into O2− when the operating temperature is below 150 °C. When the temperature increases (e.g. 150 to 400 °C), oxygen molecules change to O− and O2−. The O− and O2− species are active sites for ethanol detection and O− ions are formed at 200 to 350 °C.31 The adsorption heat of O− is higher than O2−, which means that O− is preferred for sensing reactions.32 Once the sensor is exposed to ethanol vapor, ethanol molecules react with these adsorbed oxygen species.33 The sensing process is shown in eqn (1) and (2):| | |
C2H5OH(gas) → C2H5OH(ads),
| (1) |
| | |
C2H5OH(ads) + 6O(ads)− → 2CO2(gas) + 3H2O(gas) + 6e.
| (2) |
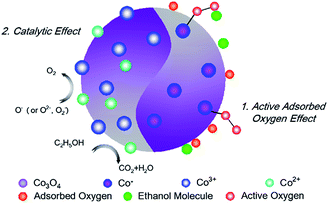
In this process, oxygen vacancies (Vo) play a crucial role. When O2 is adsorbed on the surface of the material, some oxygen atoms fill the anion vacancy while other oxygen atoms dangle out and form adsorbed oxygen (Fig. 9). The formed Co*–O− are active sites for ethanol dissociation and oxidise the ethanol to CO2 and H2O as eqn (3) and (4):34
| | |
Co* + O− + Vo + e → Co*–O−,
| (3) |
| | |
6Co*–O− + C2H5OH → 6Co* + 6Vo + 2CO2 + 3H2O + 6e.
| (4) |
 |
| | Fig. 9 Schematic of the Co3O4 sensing process. | |
In addition to the effect of molecule adsorption and oxygen vacancy, gas sensing performance is also enhanced by the catalytic effect of cobalt due to its multiple valence states. In other words, a relatively lower operating temperature might be related to the catalytic activity of the Co3O4. According to XPS analysis, Co3O4 contains abundant Co3+ and Co2+. The active sites Co3+ react with ethanol when the material is exposed to ethanol vapor. In this process, the Co3+ ions are reduced to Co2+, while ethanol molecules are oxidised at the same time35 (Fig. 9). The catalytic activity of Co3O4 significantly reduces the activation energy of the reaction and leads to a lower operating temperature. When the material is exposed to air, electrons are captured from the conduction band of Co3O4, and positively charged oxygen is created. In this process, Co2+ ions will be oxidised to Co3+.
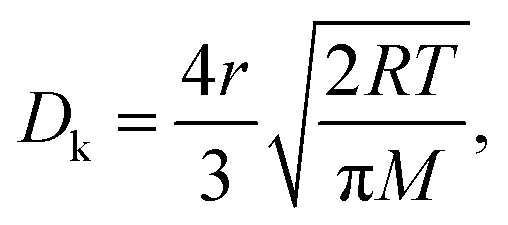
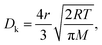
Furthermore, developing the structure is another critical factor for sensing the performance. According to BET results, the specific surface area and pore volume are related to the calcination temperature. Although larger specific surface areas and pore volumes provide a more effective contact surface, the nanostructure also causes agglomeration. The agglomeration further decreases the surface energy and reduces the activation sites,36 which might be the reason why the response value of T300-Co3O4 and T350-Co3O4 is smaller than that of T400-Co3O4. Therefore, the specific surface area and pore volume may not be the relevant factor for increased responsiveness. Except for the specific surface area and pore volume, the BET results also provide information on the pore size, which shows a significant impact on the gas sensitivity. The reason is that the pore size is related to gas diffusion, especially effective diffusion, such as Knudsen diffusion. The mean free path (![[small lambda, Greek, macron]](https://www.rsc.org/images/entities/i_char_e0cc.gif) ) of gas molecules at ambient temperature and pressure is constant and the of ethanol is 25.6 nm.36 When the pore size is approximately the same as , Knudsen diffusion will dominate relative to molecular diffusion. The Knudsen diffusion coefficient (Dk) is defined as eqn (5):37,38
) of gas molecules at ambient temperature and pressure is constant and the of ethanol is 25.6 nm.36 When the pore size is approximately the same as , Knudsen diffusion will dominate relative to molecular diffusion. The Knudsen diffusion coefficient (Dk) is defined as eqn (5):37,38
| |
 | (5) |
Here,
R is the universal gas constant,
T is temperature,
M is the molecular mass of ethanol, and
r is the pore size.
Dk is linearly related to
r. A reduction of
r in the samples will reduce
Dk, and thus the ethanol molecules' diffusion is limited throughout the whole material. As shown in
Table 3, the
r of T350-Co
3O
4 and T450-Co
3O
4 are approximately the same, and these two Co
3O
4 samples show approximately equal response values to 100 ppm ethanol at 200 °C. The same results are shown in T300-Co
3O
4 and T500-Co
3O
4. As for T400-Co
3O
4, it shows the largest pore size and highest response value.
4. Conclusions
In summary, a series of porous Co3O4 with different morphologies were fabricated by an MOF precursor template technique without any surfactants. These Co3O4 showed notable ethanol sensing performance, and the Co3O4 sample obtained with a 400 °C calcination temperature (T400-Co3O4) showed the best response among the samples. The response value of T400-Co3O4 was better than other materials reported in literatures. Further, the detection limitation of T400-Co3O4 was as low as 1 ppm, and it exhibited good repeatability, high selectivity and fast response/recovery time. The enhanced sensing ability might be attributed to the adsorption/desorption of oxygen molecules, the catalytic activity of Co3+ and the effective diffusion of gas molecules. The facile and effective synthesis technique provides a candidate material to optimise sensor performance and provides an example of a low-energy consumption ethanol gas sensor.
Conflicts of interest
There are no conflicts to declare.
Acknowledgements
This work was supported by National Natural Science Foundation of China (No. 61874137).
Notes and references
- A. Dey, Mater. Sci. Eng., B, 2018, 229, 206–217 CrossRef CAS.
- L. Zhu and W. Zeng, Sens. Actuators, A, 2017, 267, 242–261 CrossRef CAS.
- F. S. Fateminia, Y. Mortazavi and A. A. Khodadadi, Mater. Sci. Semicond. Process., 2019, 90, 182–189 CrossRef CAS.
- X. Zhou, X. Cheng, Y. Zhu, A. A. Elzatahry, A. Alghamdi, Y. Deng and D. Zhao, Chin. Chem. Lett., 2018, 29, 405–416 CrossRef CAS.
- S. Dang, Q.-L. Zhu and Q. Xu, Nat. Rev. Mater., 2017, 3, 17075 CrossRef.
- K. Lu, T. Aung, N. Guo, R. Weichselbaum and W. Lin, Adv. Mater., 2018, 30, 1707634 CrossRef PubMed.
- W. Li, X. Wu, N. Han, J. Chen, X. Qian, Y. Deng, W. Tang and Y. Chen, Sens. Actuators, B, 2016, 225, 158–166 CrossRef CAS.
- Y. Xiong, W. Xu, Z. Zhu, Q. Xue, W. Lu, D. Ding and L. Zhu, Sens. Actuators, B, 2017, 253, 523–532 CrossRef CAS.
- J. Sun, L. Sun, S. Bai, H. Fu, J. Guo, Y. Feng, R. Luo, D. Li and A. Chen, Sens. Actuators, B, 2019, 285, 291–301 CrossRef CAS.
- Z. Wen, L. Zhu, W. Mei, L. Hu, Y. Li, L. Sun, H. Cai and Z. Ye, Sens. Actuators, B, 2013, 186, 172–179 CrossRef CAS.
- B. Wang, L. Sun and Y. Wang, Mater. Lett., 2018, 218, 290–294 CrossRef CAS.
- L. Zhang and Y. Yin, Sens. Actuators, B, 2013, 183, 110–116 CrossRef CAS.
- M. Tian, J. Miao, P. Cheng, H. Mu, J. Tu and J. Sun, Appl. Surf. Sci., 2019, 479, 601–607 CrossRef CAS.
- B. Li, J. Liu, Q. Liu, R. Chen, H. Zhang, J. Yu, D. Song, J. Li, M. Zhang and J. Wang, Appl. Surf. Sci., 2019, 475, 700–709 CrossRef CAS.
- G. Ren, Z. Li, W. Yang, M. Faheem, J. Xing, X. Zou, Q. Pan, G. Zhou and Y. Du, Sens. Actuators, B, 2019, 284, 421–427 CrossRef CAS.
- E. Dai, S. Wu, Y. Ye, Y. Cai, J. Liu and C. Liang, J. Colloid Interface Sci., 2018, 514, 165–171 CrossRef CAS PubMed.
- A. Montazeri and F. Jamali-Sheini, Sens. Actuators, B, 2017, 242, 778–791 CrossRef CAS.
- Y. Lü, W. Zhan, Y. He, Y. Wang, X. Kong, Q. Kuang, Z. Xie and L. Zheng, ACS Appl. Mater. Interfaces, 2014, 6, 4186–4195 CrossRef PubMed.
- B. Y. Xia, Y. Yan, N. Li, H. B. Wu, X. W. Lou and X. Wang, Nat. Energy, 2016, 1, 15006 CrossRef CAS.
- O. Lupan, V. Postica, F. Labat, I. Ciofini, T. Pauporté and R. Adelung, Sens. Actuators, B, 2018, 254, 1259–1270 CrossRef CAS.
- J. D. Prades, R. Jimenez-Diaz, F. Hernandez-Ramirez, S. Barth, A. Cirera, A. Romano-Rodriguez, S. Mathur and J. R. Morante, Appl. Phys. Lett., 2008, 93, 123110 CrossRef.
- A. Dey, Mater. Sci. Eng., B, 2018, 229, 206–217 CrossRef CAS.
- X. Zhang, B. Liu, Y. Xu, H. Liu, W. Zhao, P. Wang, A. Ming and F. Wei, CrystEngComm, 2019, 21, 7528–7534 RSC.
- M. Rashad, M. Rüsing, G. Berth, K. Lischka and A. Pawlis, J. Nanomater., 2013, 2013, 82 CrossRef.
- L. L. Xing, Z. H. Chen and X. Y. Xue, Solid State Sci., 2014, 32, 88–93 CrossRef CAS.
- I. Lorite, J. J. Romero and J. F. Fernández, J. Raman Spectrosc., 2012, 43, 1443–1448 CrossRef CAS.
- T. Hu, Y. Wang, L. Zhang, T. Tang, H. Xiao, W. Chen, M. Zhao, J. Jia and H. Zhu, Appl. Catal., B, 2019, 243, 175–182 CrossRef CAS.
- B. Chen, X. He, F. Yin, H. Wang, D. J. Liu, R. Shi, J. Chen and H. Yin, Adv. Funct. Mater., 2017, 27, 1700795 CrossRef.
- Y. Mo, F. Shi, S. Qin, P. Tang, Y. Feng, Y. Zhao and D. Li, Ind. Eng. Chem. Res., 2019, 58, 8061–8071 CrossRef CAS.
- J. Oviedo and M. J. Gillan, Surf. Sci., 2001, 490, 221–236 CrossRef CAS.
- H. Nguyen and S. A. El-Safty, J. Phys. Chem. C, 2011, 115, 8466–8474 CrossRef CAS.
- C. H. Shek and G. M. Lin, J. Mater. Res., 2000, 15, 1994–1997 CrossRef CAS.
- X. Cao, Y. Zhu, T. Shi, J. Lei, X. Tang and D. Zhang, J. Nanosci. Nanotechnol., 2018, 18, 6965–6970 CrossRef PubMed.
- J. Wu, Q. Huang, D. Zeng, S. Zhang, L. Yang, D. Xia, Z. Xiong and C. Xie, Sens. Actuators, B, 2014, 198, 62–69 CrossRef CAS.
- J. Xiao, K. Diao, Z. Zheng and X. Cui, J. Mater. Sci.: Mater. Electron., 2018, 29, 8535–8546 CrossRef CAS.
- C. Jin, C. Ge, G. Xu, G. Peterson, Z. Jian, Y. Wei and K. Zhu, Mater. Sci. Eng., B, 2017, 224, 158–162 CrossRef CAS.
- V. Ambardekar, P. P. Bandyopadhyay and S. B. Majumder, J. Alloys Compd., 2018, 752, 440–447 CrossRef CAS.
- H. Li, D. Zhu, Z. Yang, W. Lu and Y. Pu, Appl. Surf. Sci., 2019, 489, 384–391 CrossRef CAS.
Footnote |
| † Electronic supplementary information (ESI) available. See DOI: 10.1039/c9ra08904g |
|
| This journal is © The Royal Society of Chemistry 2020 |
Click here to see how this site uses Cookies. View our privacy policy here. 
 Open Access Article
 This Open Access Article is licensed under a Creative Commons Attribution-Non Commercial 3.0 Unported Licence
 *ab,
Yaohua Xuab,
Hao Liuab,
Wenrui Zhaoab,
Anjie Mingab and
Feng Weia
*ab,
Yaohua Xuab,
Hao Liuab,
Wenrui Zhaoab,
Anjie Mingab and
Feng Weia