 Open Access Article
Creative Commons Attribution 3.0 Unported Licence
Fabrication and performance evaluation of new nanocomposite membranes based on sulfonated poly(phthalazinone ether ketone) for PEM fuel cells
Khadijeh Hooshyari *a,
Samira Heydaribc,
Mehran Javanbakht
 bc,
Hossein Beydaghid and
Morteza Enhessarie
aDepartment of Applied Chemistry, Faculty of Chemistry, Urmia University, Urmia, Iran. E-mail: Kh.Hooshyari@urmia.ac.ir
bDepartment of Chemistry, Amirkabir University of Technology, Tehran, Iran
cSolar Cell and Fuel Cell Lab, Renewable Energy Research Center, Amirkabir University of Technology, Tehran, Iran
dGraphene Labs, Istituto Italiano di Tecnologia, 16163 Genova, Italy
eDepartment of Chemistry, Naragh Branch, Islamic Azad University, Naragh, Iran
First published on 15th January 2020
Abstract
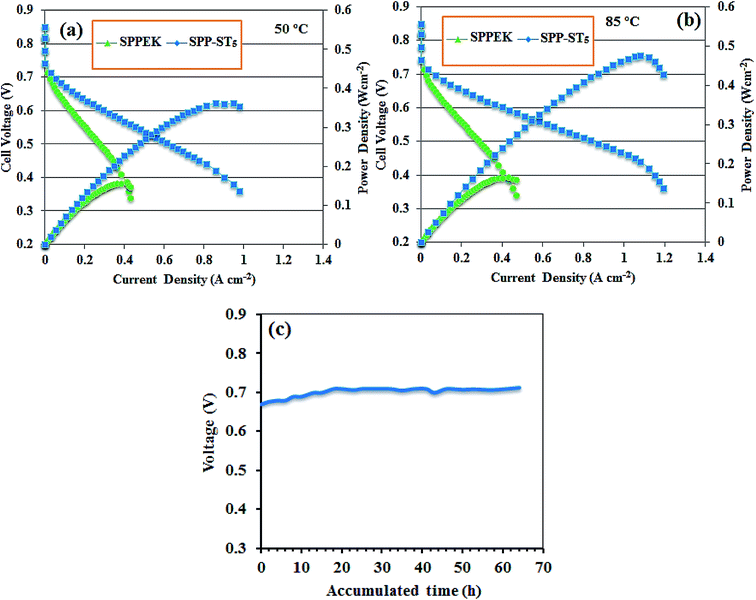
The purpose of this work is to enhance the proton conductivity and fuel cell performance of sulfonated poly(phthalazinone ether ketone) (SPPEK) as a proton exchange membrane through the application of SrTiO3 perovskite nanoparticles. Nanocomposite membranes based on SPPEK and SrTiO3 perovskite nanoparticles were prepared via a casting method. The highest proton conductivity of nanocomposite membranes obtained was 120 mS cm−1 at 90 °C and 95% RH. These enhancements could be related to the hygroscopic structure of SrTiO3 perovskite nanoparticles and the formation of hydrogen bonds between nanoparticles and water molecules. The satisfactory power density, 0.41 W cm−2 at 0.5 V and 85 °C, of the nanocomposite membrane (5 wt% content of nanoparticles) confirms their potential for application in the PEM fuel cells.
1. Introduction
Burning fossil fuels in order to produce energy is a threat to the environment, especially the ozone layer. Today the world is looking for renewable sources to supply energy.1,2 The fuel cell is one of the best alternatives as a clean source for this purpose. Hydrogen is an environment friendly fuel because the product of its combustion is pure water. Fuel cells transform chemical energy to electrical energy in one step. In most cases, a catalytic material accelerates this phenomenon.3–5 Among the different types of fuel cells, the proton exchange membrane (PEM) fuel cells are the most applicable, because of their low weight and volume, low operating temperature and ease of fuel storage.6–9 The structure and performance of PEMs are the most important issues of fuel cell science, since they have significant effects on ohmic drop, electrode polarization and total performance of PEM fuel cells. A qualified membrane should have sufficient proton conductivity, good water uptake, suitable thermal stability, high mechanical strength and chemical resistance. Moreover, it should prevent the crossover of reactant gases.10–12 Up to now, Nafion has been the most widely used membrane. It is a kind of perfluorosulfonate ionomer membranes, a polymer with the noted properties as a qualified membrane, which has sulfonic acid groups in its side chain. However, Nafion is so expensive and has low proton conductivity in low relative humidity.13 On the other hand, because of proton transport mechanism, the proton conductivity is vigorously affected by the presence of water, which means that the membrane must be hydrated to obtain maximum ability of transporting protons. Therefore, Nafion has suitable proton conductivity at temperatures under the water boiling point but at higher temperatures, a significant decline would be observed in conductivity and consequently in PEM fuel cells performance.14,15 Many efforts had been made in order to improve these defects, but these emprises would not result in cheaper membranes.Many efforts have been made to find a substitute for Nafion membrane. Sulfonated non-fluorinated polymers such as: sulphonated poly(ether ether ketone),16,17 sulphonated poly(ether ketone), sulphonated poly(sulfone),18 sulfonated poly(vinylidene fluoride-co-hexafluoro propylene),19 sulphonated polybenzimidazole, sulphonated polyimide have been studied.20,21 These polymers have suitable mechanical, chemical, thermal and oxidative stability.22,23 Sulfonated poly(phthalazinone ether ketone) (SPPEK) is one of the sulphonated polymers with eligible properties for use as PEMs. It is a thermoplastic polymer with high glass transition temperature that has excellent thermal and mechanical stability.24,25 Nitrogen atoms in the SPPEK backbone and high content of sulfonic acid groups lead to high proton conductivity of this polymer. The presence of sulfonic acid functional groups on the side chains of aromatic polymers cause the ionic clusters to be gathered. Consequently, the hydrophilic and hydrophobic sites separate from each other and this phenomenon leads to better proton conductivity.26 Furthermore, SPPEK is not expensive in comparison with Nafion.27–29 Sulfonic acid groups can efficiently cause improvement in the proton conductivity of sulphonated polymers via Grotthuss mechanism. But on the contrary, dimensional instability often occurs in membranes with high content of sulfonic acid groups while swelling. Because the membrane will experience hot press in the process of producing membrane electrode assembly, then it should work at a humidified hot condition in the fuel cell, it is so important to save the mechanical stability, simultaneous with having appropriate proton conductivity. Therefore, the membrane must have a suitable dimensional stability. Inorganic materials can improve mechanical properties of the membrane.30,31 Also, doping with hygroscopic materials can improve membrane's water uptake ability and consequently its proton conductivity. SiO2, ZrO2 and TiO2 are hygroscopic materials which adsorb water and cause better water uptake and proton exchange ability.32–34 Proton transfer occurs easier if more water molecules would be captured in the polymer structure. Many organic–inorganic membranes have been manufactured.35 Du et al. fabricated a composite membrane using SPEEK doped with SiO2 sulfuric acid, they were successful to increase the SPEEK proton conductivity with the value of 18.6%.36 Yu-Huei Su et al. mixed SPPEK and SiO2 to form the PEM composites. Thermal and mechanical properties and dimensional stability of these membranes have been improved.37 Recently, different nanocomposite membranes based on barium zirconate nanoparticles,38–40 strontium cerate nanoparticles,41 lanthanum cerate42 and iron titanate nanoparticles43–45 have been investigated.
A very stable type of oxide with the schematic formula of ABO3, which is named perovskite, can be a suitable choice for this purpose. In the ABO3 formula of perovskites, A (A cations are 12-coordinated by oxygen and have a large ionic radius with similar size as the oxygen ion) and B (B cations are 6-coordinated by oxygen and have a small ionic radius, which situated in the octahedral holes between the closed pack AO-layers) are cations which are appropriate in perovskite structures. Perovskite groups show high stability due to the special orientation of atoms. Research on perovskite-type (ABO3) pure materials has been enhanced in recent years due to their smart high proton conductivity under wet atmospheres at high temperatures (1000 °C).46,47 The perovskite nanoparticles have high thermal, mechanical, and chemical stabilities. The perovskites can be insulators, semiconductors, superconductors, and ionic conductors.48 Different types of large and small ions can be incorporated in perovskite structure. So these types of oxides have the ability to contain diverse alignment of chemicals. Consequently, the hallow spaces are formed easily in the crystalline structure of this component. Perovskites have sufficient properties for proton conduction because of free spaces for oxygen sites capture water molecules, facilitating proton mobility.
The most important perovskite from the titanate family is strontium titanate SrTiO3 (ST). The ST nanoparticle with perovskite-type cubic structure is a promising material for using in solid oxide fuel cells, capacitors, photo-catalysis, magneto-hydrodynamic power generation and oxygen sensors.49 The perovskite materials such as BaCeO3, BaZrO3, SrCeO3 and SrTiO3 have good proton conductivity (0.01–10 mS cm−1) in temperature range of 200–1200 °C.50 Behaviors of defects in strontium titanate (SrTiO3−δ), one of the most common perovskite-type metal oxides, have been studied during last 40 years. The oxygen vacancy would be formed in oxygen-deficient ABO3−δ as a nonstoichiometric perovskite, where δ expresses the number of deficient atoms per unit formula (oxygen vacancy spaces). The oxygen vacancy spaces in the perovskite nanoparticles raise the proton conductivity because of its role as hydrogen traps.
In this work, we produced nanocomposite membranes based on SPPEK doped with SrTiO3 (ST) perovskite nanoparticles. The ratio of nanoparticles had been changed and the trend of properties changes was investigated at different temperatures for the first time. The results showed that mechanical stability, water uptake, proton conductivity and single fuel cell test performance of the nanocomposite membranes improved. The SrTiO3 perovskite nanoparticles caused an enhancement in water uptake and proton conductivity of membranes by forming hydrogen bonds and trapping water molecules in the membrane matrix. Mechanical stability of the nanocomposite membranes enhanced because of the increase of inorganic content and also the strong hydrogen bonds between SO3H groups of the SPPEK and ST perovskite nanoparticles. As expected, by improving water uptake and proton conductivity of the membranes, they showed better fuel cell performance and supplied more power density in the presence of nanoparticles.
2. Experimental
2.1. Materials
Poly(phthalazinone ether ketone), PPEK, (Mw = 28![[thin space (1/6-em)]](https://www.rsc.org/images/entities/char_2009.gif) 800 g mol−1, Mn = 10
800 g mol−1, Mn = 10![[thin space (1/6-em)]](https://www.rsc.org/images/entities/char_2009.gif) 300) was supplied by Fumatech Company. Dimethylacetamide (DMAc), 2-propanol and glycerol were supplied from Merck Company. Carbon Vulcan and Pt/C 20% powder were obtained from Electrochem Company. Nafion 117 membrane, Nafion 5% solution and Teflon solution were supplied by Dupont. SrTiO3 perovskite nanoparticle with the size of 50 nm was used as inorganic additive.
300) was supplied by Fumatech Company. Dimethylacetamide (DMAc), 2-propanol and glycerol were supplied from Merck Company. Carbon Vulcan and Pt/C 20% powder were obtained from Electrochem Company. Nafion 117 membrane, Nafion 5% solution and Teflon solution were supplied by Dupont. SrTiO3 perovskite nanoparticle with the size of 50 nm was used as inorganic additive.
2.2. Synthesis of SrTiO3 perovskite nanoparticles
The SrTiO3 (ST) perovskite nanoparticles were simply synthesized according to previously described method.51 0.5982 g SrO2, 0.3994 g TiO2 and 1.5 g of NaCl and KCl (a mixture with equal molar ratios) were blended thoroughly in a carnelian mortar. Afterward, the homogenous mixture was heated from ambient temperature to 700 °C for 12 hours in a corundum pounder and was leaved to become cool. After reaching to room temperature, the probable contaminants were washed by 1 M solution of HNO3 in water. The solid residue was dried at 80 °C and finally, ST perovskite nanoparticles were gained in the shape of a white powder.2.3. Sulfonation of PPEK
The SPPEK was prepared by direct sulfonation of PPEK with sulfuric acid according to the following procedure; first, 2 g of PPEK powder was added into 20 mL concentrated sulfuric acid and was stirred for 1 hour at ambient temperature. The prepared solution was stirred for 4 hours under the temperature of 60 °C. Then, the solution was poured into ice water simultaneous with shaking. The residue powder was washed by deionized water for several times to be neutralized. Finally, the SPPEK powder was dried in a vacuum oven at 70 °C for 24 hours.The introduction of sulfonic acid groups on PPEK backbone causes the appearance of a significant signal at 8.30 ppm, which is related to the aromatic proton (HE) next to SO3H. DS was calculated by the following eqn (1):
 | (1) |
2.4. Preparation of nanocomposite membranes
Nanocomposite membranes were fabricated via solution casting method. Appropriate amount of SPPEK was dissolved in DMAc at 60 °C and 6 h stirring to obtain a homogeneous solution (15 wt%). The certain amounts of the ST perovskite nanoparticles (1, 3, 5, 7 and 9 wt%) were dispersed in DMAc using an ultrasonic probe and then were added to the above SPPEK solution while stirring in order to obtain a homogenous solution. The prepared quite viscose solution was cast onto a glass plate with applicator and dried at 25 °C for 12 h, 70 °C for 12 h and 120 °C for 2 h to remove any residual DMAc. Finally, the glass plate was soaked in water in order to separate the obtained membrane. The thicknesses of prepared membranes were ranged between 80 and 100 μm. The prepared nanocomposite membranes based on SPPEK and ST perovskite nanoparticles were named SPP-STx. The value of x in SPP-STx nanocomposite membranes was assigned for the x wt% of the ST perovskite nanoparticles vs. weight of dry polymer.2.5. Apparatus
Biologic fuel cell tester, series of FCT-150s, was used to obtain polarization curves. Autolab potentiostat-galvanostat PGstat 302N was used to perform electrochemical tests. ATR-FTIR spectra of the membranes were performed with a Bruker Equinox 55 (600–4000 cm−1 and resolution of 4 cm−1) at the room temperature. Field emission scanning electron microscopy (FE-SEM), Carl Zeiss electronic microscope, was used to analyze membrane's morphology and energy dispersive X-ray spectroscopy (EDX) was used to confirm the homogeneous distribution of the nanoparticles in the nanocomposite membranes matrix. Tensile strength test was performed with the purpose of exploring mechanical stability of the membrane using Instron-5566 instrument. Membranes were cut to strips with dimensions of 5 and 50 mm, and stretched with the speed of 2 mm min−1. Thermal stability was investigated at ambient pressure from 30 to 700 °C with the rate of 20 °C min−1. H-NMR device model Oxford 600 MHz was used to investigate the structure of the SPPEK.2.6. Characterization of membranes
 | (2) |
In a process similar to that applied for detecting the water uptake, the thicknesses of the dry and wet membranes were measured with using thickness gauge. The swelling ratios (SW) of the membranes were obtained from eqn (3):
 | (3) |
 | (4) |
Activation energy (Ea) was obtained using Arrhenius eqn (5):
 | (5) |
For determining the IEC, the membranes were weighed, then, immersed in a saturated NaCl solution for thorough substitution of H+ by Na+ ions of NaCl. After that, the released H+ ions from the polymer to the salty solution were titrated by NaOH in the presence of phenolphthalein as indicator. The eqn (6) was used to calculate the IEC of the membranes:
 | (6) |
![[thin space (1/6-em)]](https://www.rsc.org/images/entities/char_2009.gif) :
:![[thin space (1/6-em)]](https://www.rsc.org/images/entities/char_2009.gif) 9) to prepare the catalyst ink. Then a 5 wt% of Nafion solution was added into the above solution. The weight ratio of Nafion to platinum in the Pt/C powder in the ink is 1
9) to prepare the catalyst ink. Then a 5 wt% of Nafion solution was added into the above solution. The weight ratio of Nafion to platinum in the Pt/C powder in the ink is 1![[thin space (1/6-em)]](https://www.rsc.org/images/entities/char_2009.gif) :
:![[thin space (1/6-em)]](https://www.rsc.org/images/entities/char_2009.gif) 1. The catalyst ink was painted on the carbon cloth containing microporous layer at 120 °C and 50 kg cm−2 pressure for 5 min to prepare the MEAs. For activation processes, the temperature of anode, cathode and humidifiers (RH range: 60–95%) was increased step by step until the temperature reaches 80 °C for all issues. The cell was put in 0.6 V at a constant current for 6 h until the cell was activated fully.
1. The catalyst ink was painted on the carbon cloth containing microporous layer at 120 °C and 50 kg cm−2 pressure for 5 min to prepare the MEAs. For activation processes, the temperature of anode, cathode and humidifiers (RH range: 60–95%) was increased step by step until the temperature reaches 80 °C for all issues. The cell was put in 0.6 V at a constant current for 6 h until the cell was activated fully.3. Results and discussion
3.1. ST perovskite nanoparticles characterization
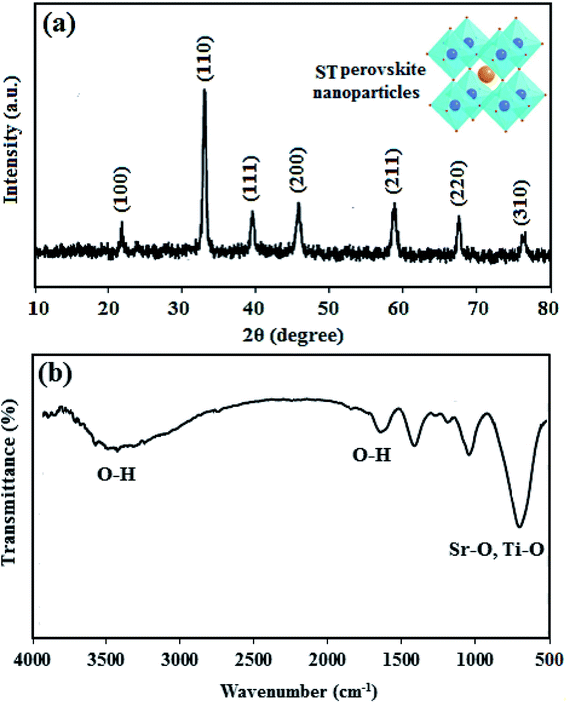
XRD pattern and FTIR spectra of ST perovskite nanoparticles were shown in Fig. 1. The XRD pattern (Fig. 1(a)) indicates the crystal of the as-synthesized ST perovskite nanoparticles appears a typical perovskite structure of the cubic symmetry. The diffraction peaks of the ST perovskite nanoparticles were located at 22.7°, 32.3°, 39.9°, 46.3°, 57.6°, 67.5°, and 77.1°, corresponding to the (100), (110), (111), (200), (211), (220), and (310) crystal planes, respectively, of cubic perovskite ST nanoparticles consist of single phase (according to JCPDS No.74-1296).49 However, the perfect perovskite nanoparticles structure is scarcely found at ambient temperature/pressure due to the strict constraints placed on the ionic sizes of A, B and O in ABO3 structure of perovskites.52 The Goldschmidt tolerance factor, t, is determined from ionic radii, rA, rB and rO as following: t = (rA + rO)/√2(rB + rO). The Goldschmidt tolerance factor is based on the geometrical packing of charge spheres and for the ideally packed perovskite structure (simple cubic) represented with t = 1. However, a large number of perovskite structures are distorted to orthorhombic, rhombohedral or tetragonal which can be approximated as cubic with t deviated from 1. In most cases, t varies between 0.75 and 1.53,54 These approximated cubic structures due to tensile strain and lower activation energies increase proton transfer. The average crystallite size of ST perovskite nanoparticles was determined by Deby–Scherer's eqn (6) (in which is the X-ray wavelength in nanometer, θ is ½ the diffraction angle and β is the full width half maximum in radian eqn (7)) and obtained about 50 nm. The ST perovskite nanoparticles with particle size of 50 nm have the high specific surface area that makes strong hydrogen bonding with water in the nanocomposite membrane.
 | (7) |
From Fig. 1(b), at low frequencies, the typical tensile vibration of metal–oxygen at 763–550 cm−1 is the vibrational region of Sr–O, Ti–O in titanate compounds, which confirms the presence of ST perovskite nanoparticles. The bands at 3435 cm−1 and 1630 cm−1 was assigned to the O–H vibration, which confirm the existence of O–H groups according to the adsorbed to the water on the ST perovskite nanoparticles. The O–H groups in ST perovskite nanoparticles confirm the water uptake adsorption ability, which can increase the proton conductivity of nanocomposite membrane.
3.2. SPP-STx nanocomposite membranes characterization
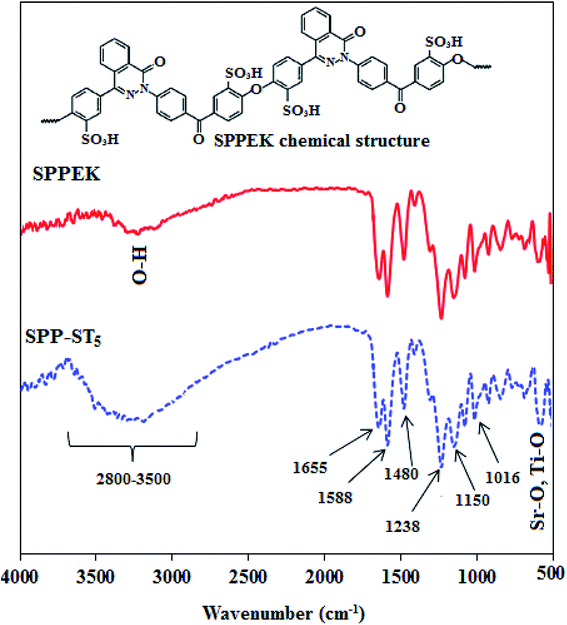
The broad adsorption near 3400 cm−1 is attributed to O–H band in SO3H groups. The carbonyl band is seen in 1655 cm−1and the C![[double bond, length as m-dash]](https://www.rsc.org/images/entities/char_e001.gif) N band is seen in 1588 cm−1 in the spectrum. Two peaks in 1480 and 1238 cm−1 refer to the conjugated carbons in SPPEK, C–C and C–O–C bands, respectively.55 The peaks in approximately 1020 and 1100 cm−1 illustrate the symmetric and asymmetric stretching vibration of S
N band is seen in 1588 cm−1 in the spectrum. Two peaks in 1480 and 1238 cm−1 refer to the conjugated carbons in SPPEK, C–C and C–O–C bands, respectively.55 The peaks in approximately 1020 and 1100 cm−1 illustrate the symmetric and asymmetric stretching vibration of S![[double bond, length as m-dash]](https://www.rsc.org/images/entities/char_e001.gif) O
O![[double bond, length as m-dash]](https://www.rsc.org/images/entities/char_e001.gif) S in SO3H groups, confirmed the addition of sulfonated groups in the structure of polymer.55,56 As shown in Fig. 2, after adding ST perovskite nanoparticles to SPPEK, the intensity of O–H group related peaks was increased which is related to hydrophilic nature of ST perovskite nanoparticles in the SPP-ST5 nanocomposite membranes structure. In addition, the peak that appeared around 763–550 cm−1 in SPP-ST5 nanocomposite membrane is may be assigned to presence of Sr–O and Ti–O vibration in the structure of nanocomposite membrane.
S in SO3H groups, confirmed the addition of sulfonated groups in the structure of polymer.55,56 As shown in Fig. 2, after adding ST perovskite nanoparticles to SPPEK, the intensity of O–H group related peaks was increased which is related to hydrophilic nature of ST perovskite nanoparticles in the SPP-ST5 nanocomposite membranes structure. In addition, the peak that appeared around 763–550 cm−1 in SPP-ST5 nanocomposite membrane is may be assigned to presence of Sr–O and Ti–O vibration in the structure of nanocomposite membrane.
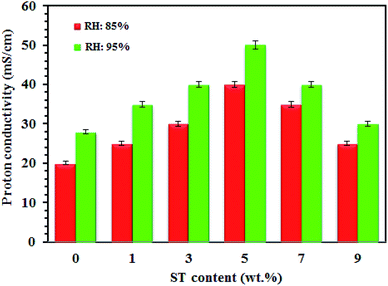
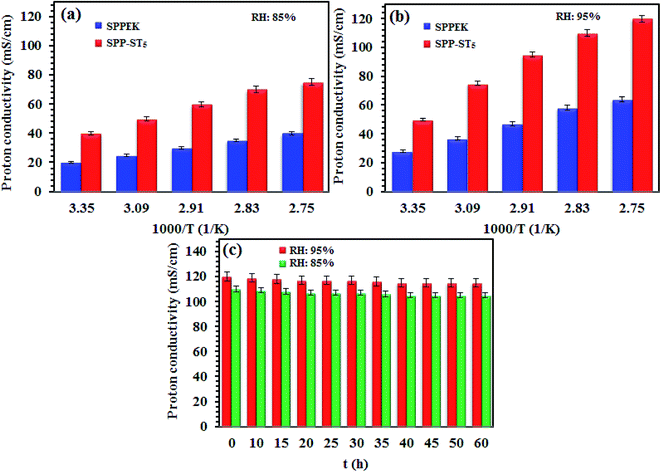
Water molecules in the nanocomposite membranes cause the transportation of protons in two mechanisms by forming a network of hydrogen bonds: hopping (Grotthuss) mechanism is performed by bonded H2O in which the protons jump from one molecule to another molecule. The other one, the vehicle mechanism occurs by free H2O molecules, and proton transport refers to different forms of H+ such as; H3O+ and H5O2+. The SO3H groups in the SPPEK membrane and oxygen vacancies of the ST perovskite nanoparticles capture water molecules with hydrogen bonding. Fig. 3 confirm this fact, as all the SPP-STx nanocomposite membranes showed high proton conductivity at 95% RH compared with 85% RH. The ST perovskite nanoparticles increase the water uptake of the membranes by the formation of proton bonds due to their hygroscopic structure. In fact, nanoparticles form a new direction for proton transport by the retention of water molecules in the membrane. Also, interactions between nanoparticles and polymer create new pathways for protons mobility. Furthermore, the wide surface area of nanoparticles provides active areas for forming more hydrogen bonds.
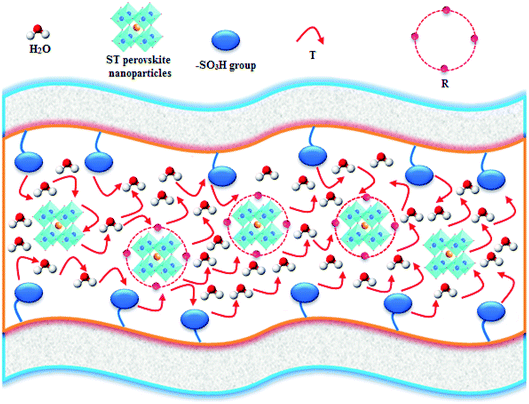
The ST perovskite nanoparticles have interaction with SPPEK matrix in SPP-STx nanocomposite membranes. Fig. 4 display schemes of proposed proton transport mechanism for SPP-STx nanocomposite membranes.
As can be seen in Fig. 4, proton transfer can happen between adjacent oxygen of the ST perovskite nanoparticles and the –SO3H group (active sites) of SPPEK matrix. Proton transfer mechanism in the ST perovskite nanoparticles includes rotational diffusion (R, proton around oxygen) and intraoctahedra proton transfer (T, proton between two adjacent oxygen) in the trap regions.57,58 The rotational motion of the proton around oxygen groups is fast.59 Hence the reorientation of the proton can happens towards the next oxygen before the transfer.
The proton conductivity of SPP-ST5 and pristine SPPEK membranes at different RH and temperatures are shown in Fig. 5. The SPP-ST5 nanocomposite membranes showed increasing proton conductivity at higher temperatures due to more mobility of protons. The activation energy (Ea) of proton transport phenomenon can be exported from Arrhenius equation, the slope of the plot ln(σ) versus 1000/T (K). The SPPEK and SPP-ST5 membrane exhibits an proton transport Ea of 7.31 and 5.04 kJ mol−1 respectively. The decline of Ea demonstrated the decreased energy barrier for proton transfer which is due to the formed acid–base interaction between ST perovskite nanoparticles and SO3H groups of polymer (faster migration of a high number of protons). So, SPP-ST5 nanocomposite membrane has highest potential for use in higher temperature PEM fuel cells due to lowest Ea value.
Furthermore, flexibility of the hygroscopic domains in SPP-ST5 nanocomposite membranes at a higher temperature causes a higher diffusivity of protons. The existence of additional hydrogen bonding network of the ST perovskite nanoparticles is responsible not only for the proton conductivity promotion, but also for the lower activation energy values in the SPP-ST5 nanocomposite membranes. The SPP-ST5 nanocomposite membranes exhibited high proton conductivity (120 mS cm−1) than Nafion 117 (102 mS cm−1) at 90 °C and 95% RH. It could be concluded that the water molecules evaporate from Nafion structure quickly at high temperatures and proton conductivity decreases. So SPP-ST5 would be a suitable substitution for Nafion, especially at higher temperatures. As can be seen in Table 1, SPP-ST5 nanocomposite membranes show high proton conductivity compared with other previous work.
| Membrane | Temperature (°C) | Proton conductivity (mS cm−1) | Ref. |
|---|---|---|---|
| a Sulfonated poly(vinylidene fluoride-co-hexaflouropropylene).b Fe2TiO5 modified by 3-aminopropyltriethoxysilane.c SPPEK doped with sulfonated graphite nanofibers.d SPPEK with sulfonation degree of 1.2.e Crosslinked SPPEK.f SPPEK containing 10% 12-phosphotungstic acid. | |||
| SPP-ST5 | 90 | 120 | This work |
| MSSW5a | Ambient | 71 | 50 |
| MAIT-Tb | 25 | 24 | 52 |
| SPPEK-SGNFc | 80 | 104 | 53 |
| 7dd | 25 | 1 | 25 |
| 6ec,e | 25 | 10 | 26 |
| MP10f | 80 | 17 | 27 |
Another important factor that affects the efficiency of a membrane as PEM fuel cells is time-stability of proton conductivity. The proton conductivity of the SPP-ST5 nanocomposite membranes was investigated by keeping at 80 °C overnight, the results of which are presented in Fig. 5(c). Fig. 5(c) shows the proton conductivity of the SPP-ST5 nanocomposite membranes approximately remain constant after 50 h. It indicates the effect of the ST perovskite nanoparticles in the RH preservation and stability of proton conductivity. The oxygen vacancies of the ST perovskite nanoparticles make hydrogen interaction in the membrane and so the adsorbed water amount in the membrane and so the proton conductivity maintains constant.
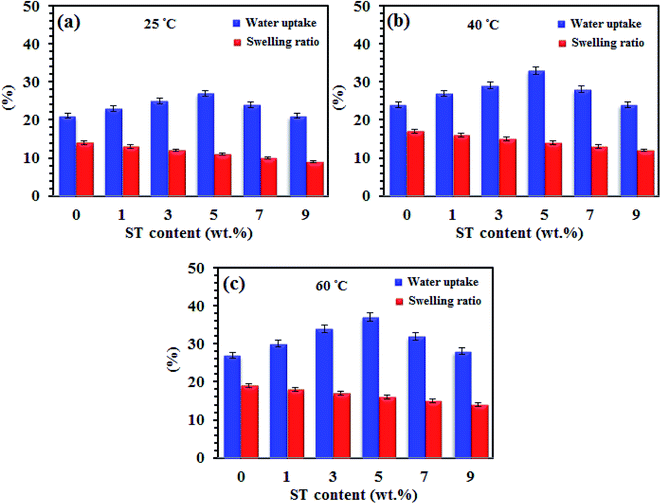 | ||
| Fig. 6 Water uptake and swelling plots (in-plane direction) of SPP-STx nanocomposite membranes at (a) 25 °C, (b) 40 °C and (c) 60 °C. | ||
The oxygen vacancies in the ST perovskite nanoparticles create more sites to absorb free water, formation of hydrogen bonding and so increase the proton conductivity of the SPP-STx nanocomposite membranes. The SPP-ST5 nanocomposite membranes displayed higher water uptake (37%) compared with other nanocomposite membranes at 60 °C (Table 2).
| Membrane | Proton conductivity (mS cm−1) at 90 °C and 95% RH | Water uptake (%) at 60 °C | Swelling ratio (%) at 60 °C | IEC (meq g−1) |
|---|---|---|---|---|
| SPPEK | 50 | 26 | 19 | 1.4 |
| SPP-ST5 | 120 | 37 | 14 | 1.8 |
Acceptable dimensional stability is a vital parameter of the prepared membranes when used in MEA of PEM fuel cells, which is essential for proper mass transfer and prevention of electrical contact in the MEA. The swelling is an indication to prognosticate the mechanical stability of membranes in PEM fuel cells. Inorganic rigid nanoparticle causes the improvement of mechanical stability of polymeric structures. As shown in Fig. 6, unlike to water uptake, the swelling of the SPP-STx nanocomposite membranes are lower than pristine SPPEK and decrease from 14% to 9% at room temperature with increasing the ST perovskite nanoparticles content, likely due to the compact structure of nanocomposite membranes with formation of hydrogen bonding between ST perovskite nanoparticles and SO3H groups of SPPEK membrane. Also, complex structure of SO3H– ST perovskite nanoparticles could limit motion of SPPEK chains and has effective effect to constrain the membrane swelling. Thus, nanoparticles make the membranes to be stable mechanically by forming intermolecular interactions and limiting the membranes swelling.32,37,39 The results of Fig. 6 shown that both of water uptake and membrane swelling increased with increase temperature. It is maybe due to increase in mobility of free water molecules and SPPEK chains with increasing temperature from 20 °C to 60 °C which facilitates water absorption in polymeric structure.
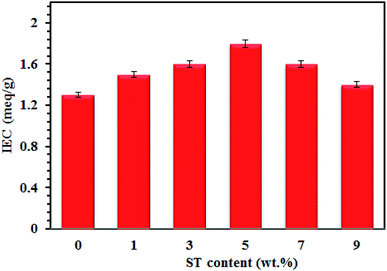
Fig. 7 shows that the IEC plot of SPP-STx nanocomposite membranes. The existence of ST perovskite nanoparticles in SPP-STx nanocomposite membranes increases considerably the proton conductivity compared to pure SPPEK membranes.
The IEC values of the nanocomposite membranes increase with increasing the proton conductivity. Increasing the IEC means that there are many sites to transfer the proton. Therefore, the proton conductivity also increases for the nanocomposite membranes with increasing of the IEC value. The SPP-ST5 nanocomposite membranes displayed higher IEC (1.8 meq g−1) compared to the pure SPPEK and other SPP-STx nanocomposite membranes.
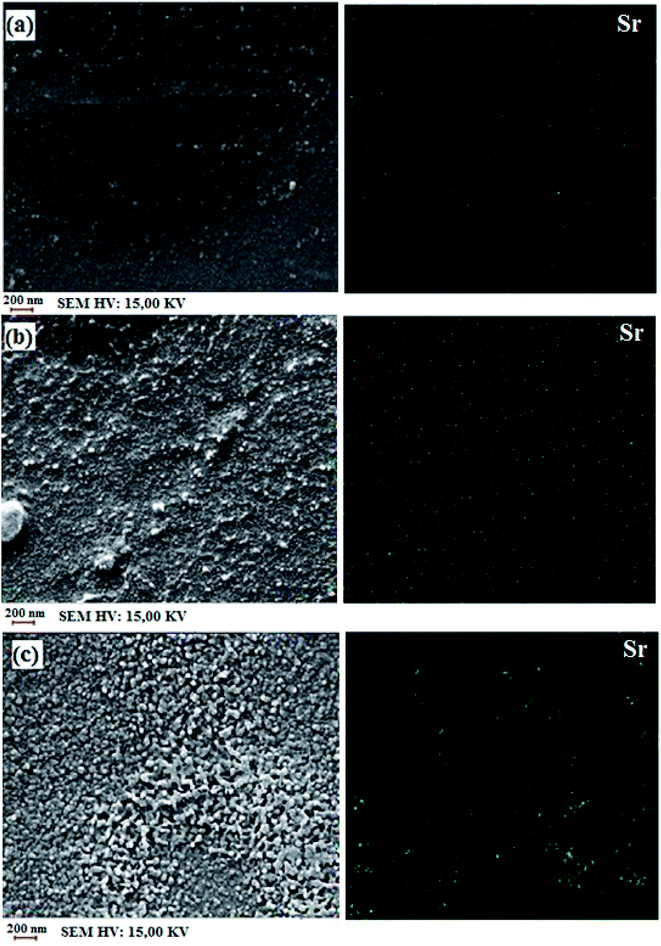
Fig. 8 shows the cross-section SEM-EDX images of SPP-ST3, SPP-ST5 and SPP-ST7 nanocomposite membranes. The nanoparticles have high surface energy and so have chemical reactions with the surrounding environment and are not stable. So the high content of the nanoparticles reduces the active surface area and decreases the water uptake and proton conductivity. Another reason for proton conductivity decreases because of the nanoparticle aggregation in the nanocomposite membranes is closing the proton transfer pathways. The high content of nanoparticles would occupy the vacant sites accessible for water molecules in the nanocomposite membranes and decrease the water uptake. So, the amount of the ST perovskite nanoparticles at the preparation process of nanocomposite membranes is an important parameter for controlling the proton conductivity. The ST perovskite nanoparticles (Sr particles) have a homogeneous dispersion in cross-section of the SPP-ST5 nanocomposite membranes and the morphology is favorable (Fig. 8(b)). But the morphology of the cross-section of the SPP-ST7 nanocomposite membranes due to the agglomeration of the ST perovskite nanoparticles is unfavorable (Fig. 8(c)). The homogeneous distribution of the nanoparticles creates effective hydrogen bonding interactions between the nanoparticles and SPPEK membrane matrix. So, the SPP-ST5 nanocomposite membranes have higher proton conductivity and water uptake compared with the SPP-ST7 nanocomposite membrane.
Mechanical properties of the SPP-STx nanocomposite membranes are shown in Fig. 10(a). The nanocomposite membrane showed high mechanical stability than pristine SPPEK membrane. The mechanical stability of nanocomposite membranes had picked up due to the strong hydrogen bonds between ST perovskite nanoparticles and SO3H groups in SPPEK matrix. The EDX image of SPP-ST5 nanocomposite membranes showed that the ST perovskite nanoparticles dispersed in SPPEK matrix homogenously. Therefore, the strong interaction between the nanoparticles and SPPEK was supported resulted in better mechanical stability for SPP-ST5 nanocomposite membranes. According to EDX results, agglomeration of nanoparticles in higher content of ST perovskite nanoparticles (>5 wt%) caused weaker mechanical stability. As expected, because of rigid and inflexible nature of ST perovskite nanoparticles, SPP-STx nanocomposite membranes showed lower elongation at break compared with SPPEK.
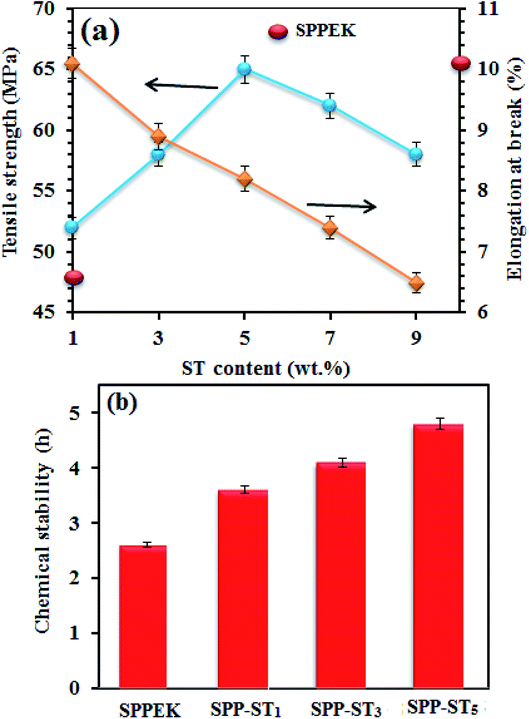 | ||
| Fig. 10 (a) Mechanical stability plot of SPP-STx nanocomposite membranes. (b) Chemical stability plot of SPPEK and SPP-ST5 membranes. | ||
The effect of the presence of ST perovskite nanoparticles on oxidative stability of membranes, an indication of the membranes' lifetime in the fuel cell was measured by soaking in Fenton reagent. The chemical stability of the membranes was calculated by determining the weight loss in Fenton's reagent. The chemical stability data during 5 h are presented in Fig. 10(b) shows the oxidation stability plot of SPPEK and SPP-ST5 membranes. It was expected that the oxidative resistance decrease by increase of water uptake, because the peroxide groups would react with polymer easier in the presence of water. But the reverse results were obtained for SPP-ST5 nanocomposite membranes.
The oxidative resistance of SPP-ST5 nanocomposite membranes had improved compared with SPPEK membrane, although the water uptake had risen. In other words, the ST perovskite nanoparticles cause better oxidative stability and consequently, longer lifetime of membranes. The nanoparticles cause better oxidative stability and consequently, longer lifetime of membranes by protecting the aromatic structure of SPPEK from meeting the hydrogen peroxide. Strong hydrogen bonds between ST perovskite nanoparticles and SPPEK structure caused the membrane to be more condensed and conserve amine part of the polymer from oxidative attack. In addition, the presence of ST perovskite nanoparticles caused more quantity of SPPEK chains to be refuge.
Fig. 11(c) shows the lifetime plots of the SPP-ST5 nanocomposite membranes at 80 °C and 95% RH. Fig. 11(c) shows that the lifetime of the SPP-ST5 nanocomposite membranes maintain constant for 60 h. The results exhibited that the SPP-ST5 nanocomposite membranes proved a suitable fuel cell performance. This is an approval for using the ST perovskites nanoparticles in the PEM for fuel cell applications.
4. Conclusions
The potential of SPPEK based nanocomposite membrane in PEM fuel cell applications has been considered in this work with the incorporation of ST perovskite nanoparticles as filler. The nanocomposite membranes showed high water uptake of 37% (at 60 °C) and proton conductivity of 120 mS cm−1 (at 90 °C and 95% RH) compared pure SPPEK due to hygroscopic nature of SrTiO3 perovskite nanoparticles. The MEA consisting of nanocomposite membrane with 5 wt% ST perovskite nanoparticles gained the power density of 0.41 W cm−2 at 85 °C. The results show that nanocomposite membranes are suitable candidate for application in PEM fuel cells.Conflicts of interest
There are no conflicts to declare.Acknowledgements
The research was supported by Urmia University (Urmia, Iran).References
- H. S. Thiam, W. R. W. Daud, S. K. Kamarudin, A. B. Mohammad, A. A. H. Kadhum, K. S. Loh and E. H. Majlan, Int. J. Hydrogen Energy, 2011, 36, 3187–3205 CrossRef CAS.
- W. K. Chao, C. M. Lee, D. C. Tsai, C. C. Chou, K. L. Hsueh and F. S. Shieu, J. Power Sources, 2008, 185, 136–142 CrossRef CAS.
- J. Jung, M. Kwon, H. R. Kim and J. Kim, Int. J. Hydrogen Energy, 2014, 39, 966–973 CrossRef CAS.
- M. M. Hasani-Sadrabadi, E. Dashtimoghadam, K. Sarikhani, F. S. Majedi and G. Khanbabaei, J. Power Sources, 2010, 195, 2450–2456 CrossRef CAS.
- K. Fatyeyeva, J. Bigarre, B. Blondel, H. Galiano, D. Gaud, M. Lecardeurc and F. Poncin-Epaillard, J. Membr. Sci., 2011, 366, 33–42 CrossRef CAS.
- L. Fu, G. Xiao and D. Yan, J. Membr. Sci., 2010, 362, 509–516 CrossRef CAS.
- N. Intaraprasit and P. Kongkachuichay, J. Taiwan Inst. Chem. Eng., 2011, 42, 190–195 CrossRef CAS.
- X. Wu, G. He, S. Gu, Z. Hu and X. Yan, Chem. Eng. J., 2010, 156, 578–581 CrossRef CAS.
- M. Javanbakht, K. Hooshyari, M. Enhessari and H. Beydaghi, Iran. J. Hydrogen Fuel Cell, 2014, 2, 105–112 Search PubMed.
- F. Dong, Z. Li, S. Wang, L. Xu and X. Yu, Int. J. Hydrogen Energy, 2011, 36, 3681–3687 CrossRef CAS.
- I. Radev, G. Georgiev, V. Sinigersky and E. Slavcheva, Int. J. Hydrogen Energy, 2008, 33, 4849–4855 CrossRef CAS.
- M. H. Yildirim, A. Schwarz, D. F. Stamatialis and M. Wessling, J. Membr. Sci., 2009, 328, 127–133 CrossRef CAS.
- M. B. Karimi, F. Mohammadi and K. Hooshyari, Int. J. Hydrogen Energy, 2019, 44, 28919–28938 CrossRef CAS.
- K. H. Hooshyari, M. Javanbakht and M. Adibi, Electrochim. Acta, 2016, 142, 142–152 CrossRef.
- K. H. Hooshyari, M. Javanbakht and M. Adibi, Int. J. Hydrogen Energy, 2016, 41, 10870–10883 CrossRef CAS.
- K. Hooshyari, S. Nazari Khanamiri, P. Salarizadeh and H. Beydaghi, J. Electrochem. Soc., 2019, 166, F976–F989 CrossRef.
- P. Hosseinabadi, K. Hooshyari, M. Javanbakht and M. Enhessari, New J. Chem., 2019, 43, 16232–16245 RSC.
- K. Hooshyari, M. Javanbakht, P. Salarizadeh and A. Bageri, J. Iran. Chem. Soc., 2019, 16, 1617–1629 CrossRef CAS.
- K. Selvakumar and M. Ramesh Prabhu, J. Mater. Sci.: Mater. Electron., 2018, 29, 15163–15173 CrossRef CAS.
- A. C. Dupuis, Prog. Mater. Sci., 2011, 56, 289–327 CrossRef CAS.
- C. Liu, X. Li, J. Xu and X. Jian, Eur. Polym. J., 2011, 47, 1852–1860 CrossRef CAS.
- Z. Li, F. Dong, L. Xu, S. Wang and X. Yu, J. Membr. Sci., 2010, 351, 50–57 CrossRef CAS.
- P. Salarizadeh, M. Javanbakht, S. Pourmahdian, M. Hazer, K. Hooshyari and M. Askari, Int. J. Hydrogen Energy, 2019, 44, 3099–3114 CrossRef CAS.
- H. Beydaghi, M. Javanbakht, P. Salarizadeh, A. Bagheri and A. Amoozadeh, Polymer, 2017, 119, 253–262 CrossRef CAS.
- G. Rambabu, S. Sasikala and S. D. Bhat, RSC Adv., 2016, 6, 107507–107518 RSC.
- L. Chen, S. Zhang, Y. Chen and X. Jian, J. Power Sources, 2017, 355, 23–30 CrossRef CAS.
- H. G. Chen, S. J. Wang, M. Xiao and Y. Z. Meng, J. Power Sources, 2007, 165, 16–23 CrossRef CAS.
- F. C. Ding, S. J. Wang, M. Xiao and Y. Z. Meng, J. Power Sources, 2007, 164, 488–495 CrossRef CAS.
- H. Zhang, B. Zhu and Y. Xu, Solid State Ionics, 2006, 177, 1123–1128 CrossRef CAS.
- K. Selvakumar, S. Rajendran and M. Ramesh Prabhu, Appl. Surf. Sci., 2017, 418, 64–71 CrossRef.
- J. Kalaiselvimary and M. Ramesh Prabhu, J. Mater. Sci.: Mater. Electron., 2018, 29, 5525–5535 CrossRef CAS.
- Z. Miao, H. Yu, W. Song, D. Zhao, L. Hao, B. Yi and Z. Shao, Electrochem. Commun., 2009, 11, 787–790 CrossRef CAS.
- G. Mohammadi, M. Jahanshahi and A. Rahimpour, Int. J. Hydrogen Energy, 2013, 38, 9387–9394 CrossRef CAS.
- H. Namazi and H. Ahmadi, J. Power Sources, 2011, 196, 2573–2583 CrossRef CAS.
- N. Hasanabadi, S. R. Ghaffarian and M. M. Hasani-Sadrabadi, Int. J. Hydrogen Energy, 2011, 36, 15323–15332 CrossRef CAS.
- L. Du, X. Yan and G. He, Int. J. Hydrogen Energy, 2012, 37, 11853–11861 CrossRef CAS.
- Y. H. Su, Y. L. Liu, Y. M. Sun, J. Y. Lai, M. D. Guiver and Y. Gao, J. Power Sources, 2006, 155, 111–117 CrossRef CAS.
- A.-M. Attaran, M. Javanbakht, K.-H. Hooshyari and M. Enhessari, Solid State Ionics, 2015, 269, 98–105 CrossRef CAS.
- K.-H. Hooshyari, M. Javanbakht, A. Shabanikia and M. Enhessari, J. Power Sources, 2015, 276, 62–72 CrossRef CAS.
- K. Selvakumar, S. Rajendran and M. Ramesh Prabhu, Ionics, 2019, 25, 2243–2253 CrossRef CAS.
- A. Shabanikia, M. Javanbakht, H.-S. Amoli, K.-H. Hooshyari and M. Enhessari, Electrochim. Acta, 2015, 154, 370–378 CrossRef CAS.
- A. Shabanikia, M. Javanbakht, H.-S. Amoli, K.-H. Hooshyari and M. Enhessari, J. Electrochem. Soc., 2014, 161, 1403–1408 CrossRef.
- A. Moheb, M. Javanbakht and K.-H. Hooshyari, Int. J. Hydrogen Energy, 2016, 41, 2896–28910 CrossRef.
- K.-H. Hooshyari, M. Javanbakht, L. Naji and M. Enhessari, J. Membr. Sci., 2014, 454, 74–81 CrossRef CAS.
- A. Shabanikia, M. Javanbakht, H.-S. Amoli, K.-H. Hooshyari and M. Enhessari, Ionics, 2015, 21, 2227–2236 CrossRef CAS.
- T. Ishihara, Perovskite Oxide for Solid Oxide Fuel Cells, Springer, 2009, ISBN 978-0-387-77707-8 Search PubMed.
- S. Hossain, A. M. Abdalla, S. Noorazean, J. H. Zainia and A. K. Azada, Renewable Sustainable Energy Rev., 2017, 79, 750–764 CrossRef CAS.
- L. Zhao, K. Chen, Y. Liu and B. He, J. Power Sources, 2017, 342, 313–319 CrossRef CAS.
- K. Raja, M. Pugalenthi and M. Ramesh Prabhu, Ionics, 2019, 5177–5188 CrossRef.
- K. D. Kreuer, Annu. Rev. Mater. Res., 2003, 33, 333–359 CrossRef CAS.
- H. Daib, Y. Zhonga, X. Wua, R. Hua, W. Lei, Y. Zhanga, G. Fana, X. Hua, J. Lia and Z. Yanga, J. Electroanal. Chem., 2018, 810, 95–99 CrossRef.
- J. Wu, Defect chemistry and proton conductivity in Ba-based perovskites, PhD thesis, California Institute of Technology Pasadena, California, 2005.
- M. Karlsson, A. Matic, C. S. Knee, I. Ahmed, S. G. Eriksson and L. Borjesson, Chem. Mater., 2008, 10, 3480–3486 CrossRef.
- K. S. Knight, Solid State Ionics, 2001, 145, 275–294 CrossRef CAS.
- Z. Li, F. Dong, L. Xu, S. Wang and X. Yu, J. Membr. Sci., 2010, 351, 50–57 CrossRef CAS.
- G. Rambabu, S. Sasikala and S. D. Bhat, RSC Adv., 2016, 6, 107507–107518 RSC.
- J. A. Dawson and I. Tanaka, J. Mater. Chem. A, 2015, 3, 10045–10051 RSC.
- D. Noferini, G. J. Nilsen, M. M. Koza, S. Eriksson, S. M. Rahman, A. R. Wildes, Z. Evenson and M. Karlsson, Phys. Chem. Chem. Phys., 2018, 20, 13697–13704 RSC.
- S. U. Dubal, A. P. Jamale, C. H. Bhosale and L. D. Jadhav, Appl. Surf. Sci., 2015, 324, 871–876 CrossRef CAS.
| This journal is © The Royal Society of Chemistry 2020 |

