 Open Access Article
CdSe/ZIF-8-x: synthesis and photocatalytic CO2 reduction performance†
Hui-Juan Peng,
Pei-Qin Zheng,
Hsiu-Yi Chao ,
Long Jiang and
Zheng-Ping Qiao
 *
*
MOE Key Laboratory of Bioinorganic and Synthetic Chemistry, School of Chemistry, Sun Yat-Sen University, Guangzhou, 510275, China. E-mail: cesqzp@mail.sysu.edu.cn
First published on 2nd January 2020
Abstract
The photocatalytic reduction of CO2 is an effective way to solve the greenhouse effect. Different kinds of materials, such as semiconductors, coordination compounds, and bioenzymes, have been widely investigated to increase the efficiency of the photocatalytic reduction of CO2. However, a high selectivity and great stability are still challenges for material scientists. Here, we report for the first time visible light photocatalytic CO2 reduction by a series of CdSe/ZIF-8 nanocomposites combining the excellent CO2 adsorption capacity of ZIF-8 and the narrow energy gap of CdSe quantum dots (QDs). The composites show a higher catalytic performance than those of the pure components. Among CdSe/ZIF-8-x (x = nCdSe/nZIF-8), the highest yield (42.317 μmol g−1) for reducing CO2 to CO in 12 h, was obtained using nanocomposites with a ratio of 0.42 (nCdSe/nZIF-8) within the range of investigation.
Nowadays, global energy shortage and environmental pollution are two major obstacles to the development of human society, and have attracted increasing concern. Using solar energy to convert CO2 into valuable fuels or chemicals is extremely attractive due to its dual function of the reduction of the greenhouse effect and also as an alternative energy source to fossil fuels. Recently, different kinds of materials, such as semiconductor materials,1–3 metal complexes,4–6 and bioenzyme catalysts,7 have been explored for photocatalytic CO2 reduction.
Metal–organic frameworks (MOFs) constructed from metal-containing clusters and organic building blocks are types of crystalline porous materials, and have been widely applied in many fields, such as gas storage,8 electrochemical energy storage (EES)9,10 and catalysis.11 Recently, MOFs12–14 have been considered as potential new catalysts due to their excellent capability for CO2 adsorption and capture.15 These porous materials provide a large number of catalytic active sites, and their porous structures are conducive to charge transfer.16 During the adsorption process, CO2 coordinates with unsaturated metal sites and forms chemical bonds with MOFs.12 Blom and co-workers demonstrated that CO2 can interact with metal ions and form end-on adducts with one of the oxygen lone pair orbitals.17
ZIF-8, which is constructed from Zn2+ centres and imidazolate ligands, shows a high CO2 adsorption capacity since the imidazolate ligand has a high adsorption capacity for CO2 and also a strong complexation ability of CO2.18 However, ZIF-8 has a wide band gap (4.9 eV, ref. 19), which means that ZIF-8 is barely photoactive enough to catalyse CO2 reduction. However, CdSe QDs can easily be excited to generate electron–hole pairs upon visible light irradiation due to their narrow band gap. Osterloh and co-workers reported CdSe QDs of several sizes applied to photocatalytic H2 evolution and showed the quantitative relationship between the degree of quantum confinement and the photocatalytic H2 evolution.20
In this work, we synthesized a series of CdSe/ZIF-8-x composites, which combine the excellent CO2 adsorption capacity of ZIF-8 with the narrow energy gap of CdSe QDs. X-ray diffraction (XRD) and energy dispersive spectroscopy (EDS) indicated the successful combination of CdSe QDs and ZIF-8. The CdSe/ZIF-8 composite exhibits an increased yield for reducing CO2 to CO compared with pure CdSe QDs or ZIF-8. Under visible light irradiation for 12 h, the CO yield was 42.317 μmol g−1, which is 6.13 and 10.84 times the yields catalysed by CdSe (6.901 μmol g−1) and by ZIF-8 (3.905 μmol g−1), respectively.
Reagents used in this work were analytically pure and used without further purification. Powder X-ray diffraction (PXRD) analysis was performed using a Rigaku Dmax-2000 diffractometer equipped with a Cu Kα (λ = 0.15406 nm) radiation source. The morphology of the catalysts was observed by transmission electron microscopy (TEM, JEOL JEM-2100F) operated at 200 kV. Scanning electron microscopy (SEM) pictures were prepared using a Hitachi scanning electron microscope S-4800. Elemental mapping was carried out by energy dispersive X-ray spectroscopy (EDS) on the same instrument. Inductively coupled plasma spectrometry (ICP, Cary5000) was used for multi-elemental analyses. The CO2 absorption behaviours of the catalysts were studied with physical adsorption apparatus (ASAP 2020M). Solid UV-visible diffuse reflectance spectroscopy (UV-vis DRS) was carried out at room temperature to evaluate the band gap energy (Eg). The products of the photocatalytic CO2 reduction were detected by gas chromatography (GC7900, Techcomp). Dynamic light scattering (DLS) measurements were carried out on an Elitesizer from Brookhaven.
CdSe QDs were synthesized by a previously reported procedure.21 The resulting CdSe QDs were precipitated by adding ethanol and dispersed in 5 mL of hexane as a stock solution.
The synthesis of CdSe/ZIF-8 was based on the pure ZIF-8 synthesis process with modification.22 A certain quantity of the above CdSe QD stock solution was precipitated by adding ethanol, and re-dispersed in 5 mL of an n-hexanol solution of 0.1642 g (2 mmol) of 2-methylimidazole (Hmim) via ultrasonication. A solution of Zn(NO3)2·6H2O (0.074 g, 0.25 mmol) in 5 mL of n-hexanol was rapidly poured into the above solution under stirring. The product was collected by centrifugation after 1 h, washed with n-hexanol twice and dried at 80 °C for 12 h under vacuum. The samples produced from nCd2+/nZn2+ equal to 0.4, 0.8, and 1.2 were named as samples 1 to 3, respectively.
The photocatalytic CO2 reduction performance of CdSe/ZIF-8-x was performed in a typical catalytic system with [Ru(bpy)3]2+ (bpy = 2′,2-bipyridine) as a photosensitizer and triethanolamine (TEOA) as a sacrificial reducing agent in CO2-saturated acetonitrile (MeCN).23–27 The photosensitizer [Ru(bpy)3]Cl2·6H2O (2 mg) and catalysts CdSe/ZIF-8-x (5 mg) were dispersed in a solution of 1 mL of triethanolamine (TEOA) and 4 mL of acetonitrile. Before irradiation, the suspension was purged with CO2 for 15 min to eliminate any air. With vigorous stirring, a 300 W Xe lamp with a 420 nm cut-off filter was utilized as the light source. After illumination for 12 h, the produced gases were analysed and quantified by gas chromatography.
The molar ratios of CdSe to ZIF-8 of the composites were characterized by ICP (Table 1). Samples 1–3 showed the same trend, that the nCd2+/nZn2+ of the products was lower than that in the reaction system due to the different reaction conversion rates of CdSe and ZIF-8.
| Sample | Reaction system | Products |
|---|---|---|
| 1 | 0.4 | 0.30 |
| 2 | 0.8 | 0.42 |
| 3 | 1.2 | 0.59 |
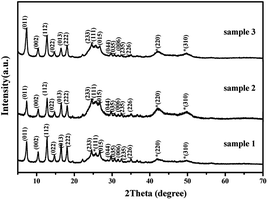
PXRD patterns of the as-prepared samples are shown in Fig. 1. All of diffraction peaks can be indexed as CdSe with a cubic phase (PDF#19-0191, shown by *) and ZIF-8 (CCDC no. 602542). The diffraction peaks of samples 1–3 are obviously wider than those of the bulk ZIF-8 and CdSe. The diameter of CdSe is around 5 nm, which was calculated from the half-width of the diffraction peaks using Scherrer's formula. This was also confirmed from the TEM images (Fig. 2).28
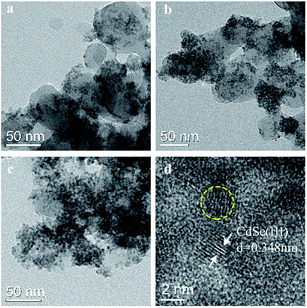
TEM images of samples 1–3 are shown in Fig. 2. In Fig. 2(d), the particle sizes of the CdSe QDs in the yellow circle are about 4 nm, which are the same as those of pure CdSe QDs synthesized by the same method.29 The high-resolution TEM (HRTEM) image of sample 2 (Fig. 2(d)) shows clear fringes with a lattice spacing of ca. 0.348 nm, which are attributed to the (111) plane of CdSe. This result indicates that the morphology of CdSe QDs did not change after being added to the reaction system of ZIF-8. The increasing contents of CdSe in samples 1–3 are clearly shown by the density of the QDs (Fig. 2(a–c)), which correspond with the ICP results. However, an excess addition of CdSe resulted in aggregation (Fig. 2(c)).
The morphology and size of CdSe/ZIF-8-x were studied, and the SEM images are shown in Fig. S2.† Clearly, the particle size of sample 2 was the smallest of the CdSe/ZIF-8-x samples. Sample 3 shows an obvious aggregation of CdSe/ZIF-8-x and an amorphous structure. The particle size was further investigated by DLS. The mean particle size values of ZIF-8 and samples 1–3 were 2443, 1279, 463, and 873 nm, respectively. Clearly, it can be seen that the moderate addition of CdSe is beneficial for smaller ZIF-8 crystals, while an excess addition of CdSe results in the aggregation of CdSe/ZIF-8-x. This result is in somewhat agreement with the TEM (Fig. 2) and SEM (Fig. S2†) results.
A typical EDS spectrum and elemental analysis of sample 2 are shown in Fig. S1 and Table S1,† respectively, confirming the presence of Cd, Se, Zn, C and O. The elemental ratio of nCd2+/nZn2+ calculated by the EDS is only 0.09, which is lower than that of the ICP result. This is probably due to the fact that the analysis of EDS comes from the surface elements and the lower elemental ratio indicates that CdSe is wrapped inside ZIF-8.
Fig. 3 shows the XPS survey spectrum and high-resolution spectra for Cd2+ 3d, Zn2+ 2p, and Se2− 3d. As shown in Fig. 3(b), the 2p3/2 and 2p1/2 binding energies of Zn2+ are located at values of 1044.8 and 1021.7 eV, respectively. Fig. 3(c) shows the 3d peak of Se2− at 54.1 eV. In addition, Fig. 3(d) shows that only two peaks appear, at binding energies of 411.7 and 404.9 eV, which are shifted towards the lower binding energy by about 0.3 eV of those of Cd2+ (3d5/2) and Cd2+ (3d3/2), from data reported in the literature.30 The above results confirm the strong combination of CdSe and ZIF-8.
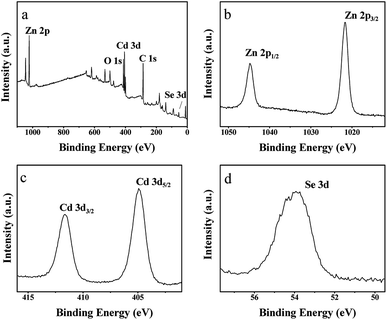 | ||
| Fig. 3 (a) Survey spectrum of sample 2, (b) core level spectrum of Zn 2p, (c) core level spectrum of Se 3d, and (d) core level spectrum Cd 3d. | ||
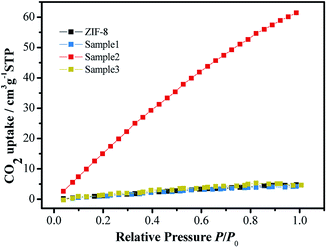
As shown in Fig. 4, among samples 1–3, sample 2 exhibits the highest CO2 uptake at 298 K, which is about 13 times that of ZIF-8. This result means that sample 2 can greatly absorb CO2 before the reduction reaction so that it can accelerate the kinetic process of CO2 reduction. Additionally, all the samples show a linear relationship between CO2 uptake and relative pressure (0.1–1.0), indicating that the interaction between CO2 and the samples is obviously physical.27,31 According to the DLS result, the greater adsorption performance of sample 2 could be due to the relatively uniform dispersion of CdSe in ZIF-8. While the aggregation of CdSe/ZIF-8-x results in a lower CO2 uptake by the lower valid surface area and active sites from the unsaturated metal sites.12 In addition, the morphology of the samples characterized by TEM, as shown in Fig. 2, indicates that the greater adsorption performance of sample 2 is due to the sufficient quantity of CdSe and the relatively uniform dispersion of CdSe in ZIF-8 and a lower aggregation of CdSe/ZIF-8-x.
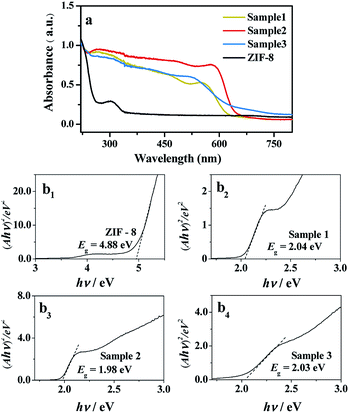
Solid UV-visible diffuse reflectance spectroscopy (UV-vis DRS) was used to evaluate the band gap energy (Eg) of samples 1–3.32 UV-vis DRS of CdSe/ZIF-8 with different proportions were studied at room temperature. From Fig. 5(a), it can be seen that the absorption wavelength of ZIF-8 is about 302 nm, which is not in the visible light region. However, the visible light absorption ability of CdSe/ZIF-8 is obviously better than that of pure ZIF-8, and the spectral response range widened to 527–630 nm. In addition, we found that the Eg value of ZIF-8 is 4.88 eV, Fig. 5(b1), which is too large to be used for visible light catalysis. However, the CdSe/ZIF-8 composites have much smaller Eg values than that of ZIF-8, at around 2.0 eV (Fig. 5(b2–b4)). This result supports the conclusion that the CdSe/ZIF-8 composites show better photocatalytic ability than ZIF-8.
To study the thermal stability of CdSe/ZIF-8-x, we conducted TGA. As shown in Fig. S3,† the initial decomposition temperatures of ZIF-8 and samples 1–3 are 118, 186, 422, and 158 °C, respectively, indicating that sample 2 has the highest thermal stability. Combined with the TEM results, the relatively uniform dispersion in sample 2 achieved the strongest combination force between CdSe and ZIF-8 among all the samples. Photocatalytic CO2 reduction experiments were carried out under visible light irradiation, and the results are summarized in Table 2. Pure CdSe and ZIF-8 show low photocatalytic activities for CO2 reduction, in which the CO production rate is below 1 μmol g−1 h−1. With an increase in the addition of CdSe, the rate of CO production first increases and then decreases. Among all the as-prepared samples, sample 2 shows the highest CO (3.526 μmol g−1 h−1) and CH4 production rates (0.102 μmol g−1 h−1), in which the CO production rate was about 11 times that of ZIF-8 (0.325 μmol g−1 h−1) and about 6 times that of CdSe (0.575 μmol g−1 h−1). However, when using N2 to replace CO2 to start the reaction under identical conditions, a little CO and CH4 were detected. The control experiment indicated that the CO product comes from CO2 gas (Table S2†).
| Sample | CO2 uptake (cm3 g−1 STP) | CO production rate (μmol g−1 h−1) | CH4 production rate (μmol g−1 h−1) |
|---|---|---|---|
| ZIF-8 | 4.805 | 0.325 | 0.000 |
| CdSe | — | 0.575 | 0.000 |
| Sample 1 | 4.219 | 1.521 | 0.092 |
| Sample 2 | 61.435 | 3.526 | 0.102 |
| Sample 3 | 4.655 | 2.038 | 0.056 |
In a photocatalytic process, CO2 adsorption is the rate-limiting step,33 which is attributed to the fact that the CO2 conversion efficiency of the photocatalyst significantly relies on the amount of CO2 molecules adsorbed.16 Combined with the DLS result, the higher CO2 uptake of sample 2 is the main reason for the high photocatalytic activities for CO2 reduction. Theoretically, increasing the yield of CH4 is more difficult than that of CO, because reducing CO2 to CO consumes two electrons while eight electrons are needed in the CH4 transformation. Given the experimental results that CdSe/ZIF-8-x showed a higher CH4 production rate than pure CdSe and ZIF-8, we considered that ZIF-8 pores could play the role of a “nanoreactor” to enclose CO2 and CO, so as to finish the lengthy transformation process and improve the yield of CH4.34 In addition, the above inference could be supported by the CO2 adsorption capacities data (Table 2).
Based on all the above results, the probable mechanism for CdSe/ZIF-8-x in the photocatalytic process is proposed as follows (Fig. 6). As shown in Fig. 6, CdSe QDs play the core role in the photocatalytic process, as they were excited to generate electron–hole pairs upon visible light irradiation due to their narrow band gap. Furthermore, the addition of CdSe improved the conductivity of CdSe/ZIF-8-x, which attributed to the charge transfer since a good conductivity leads to only a small charge transfer resistance.35,36 ZIF-8 plays a key role as the “electrons transporter” and also as the “nanoreactor”, which means that photogenerated electrons could be transferred quickly from CdSe to ZIF-8. Then, the molecular [Ru(bpy)3]2+ photosensitizer can effectively receive the photoinduced electrons to reduce the CO2 molecule absorbed by the ZIF-8 pores to yield CO. On the other hand, the photogenerated holes are quenched by TEOA acting as a sacrificial electron donor.
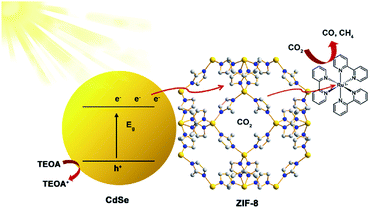 | ||
| Fig. 6 Schematic illustration of the proposed mechanism of photocatalytic CO2 reduction over CdSe/ZIF-8-x. | ||
Conclusions
In this study, a series of CdSe/ZIF-8-x nanocomposites was synthesized. They have a higher photocatalytic activity than pure CdSe and ZIF-8. PXRD, TEM and EDS results indicate that the CdSe QDs were successfully combined with ZIF-8. Moreover, sample 2, in which nCd2+/nZn2+ is equal to 0.4, shows a higher thermal stability and increased yield for reducing CO2 to CO (3.526 μmol g−1 h−1) and CH4 (0.102 μmol g−1 h−1). The CO yield is about 11 times that of ZIF-8 (0.325 μmol g−1 h−1).Conflicts of interest
There are no conflicts to declare.Acknowledgements
This work was supported by the National Natural Science Foundation of China (No. 21571193) and the Open Funds of the State Key Laboratory of Rare Earth Resource Utilization RERU2013012.References
- L. Schmidt-Mende, J. K. Stolarczyk and S. N. Habisreutinger, Angew. Chem., Int. Ed., 2013, 52, 7372–7408 CrossRef PubMed.
- Y. Liu, Z. Wang, B. Huang, Y. Dai, X. Qin and X. Zhang, Curr. Org. Chem., 2014, 18, 620–628 CrossRef CAS.
- J. Low, B. Cheng and J. Yu, Appl. Surf. Sci., 2017, 392, 658–686 CrossRef CAS.
- M. F. Kuehnel, K. L. Orchard, K. E. Dalle and E. Reisner, J. Am. Chem. Soc., 2017, 139, 7217–7223 CrossRef CAS PubMed.
- P. Kar, S. Farsinezhad, N. Mahdi, Y. Zhang, U. Obuekwe, H. Sharma, J. Shen, N. Semagina and K. Shankar, Nano Res., 2016, 9, 3478–3493 CrossRef CAS.
- S. Navalón, A. Dhakshinamoorthy, M. Alvaro and H. Garcia, ChemSusChem, 2013, 6, 562–577 CrossRef PubMed.
- S. Zhang, J. Shi, Y. Sun, Y. Wu, Y. Zhang, Z. Cai, Y. Chen, C. You, P. Han and Z. Jiang, ACS Catal., 2019, 9, 3913–3925 CrossRef CAS.
- J. R. Li, R. J. Kuppler and H. C. Zhou, Chem. Soc. Rev., 2009, 38, 1477–1504 RSC.
- W. Zhang, X. Jiang, X. Wang, Y. V. Kaneti, Y. Chen and J. Liu, et al., Angew. Chem., Int. Ed., 2017, 56, 8435–8440 CrossRef CAS PubMed.
- C. Young, R. R. Salunkhe, J. Tang, C.-C. Hu, M. Shahabuddin, E. Yanmaz, M. S. A. Hossain, J. H. Kimbf and Y. Yamauchi, Phys. Chem. Chem. Phys., 2016, 18, 29308 RSC.
- J. W. Liu, L. F. Chen, H. Cui, J. Y. Zhang, L. Zhang and C. Y. Su, Chem. Soc. Rev., 2014, 43, 6011–6061 RSC.
- Z. Huang, P. Dong, Y. Zhang, X. Nie, X. Wang and X. Zhang, J. CO2 Util., 2018, 24, 369–375 CrossRef CAS.
- D. Sun, Y. Gao, J. Fu, X. Zeng, Z. Chen and Z. Li, Chem. Commun., 2015, 51, 2645–2648 RSC.
- Y. Lee, S. Kim, J. K. Kang and S. M. Cohen, Chem. Commun., 2015, 51, 5735–5738 RSC.
- Y. Chen, D. Wang, X. Deng and Z. Li, Catal. Sci. Technol., 2017, 7, 4893–4904 RSC.
- M. Wang, J. Liu, C. Guo, X. Gao, C. Gong, Y. Wang, B. Liu, X. Li, G. G. Gurzadyan and L. Sun, J. Mater. Chem. A, 2018, 6, 4768–4775 RSC.
- P. D. Dietzel, R. E. Johnsen, H. Fjellvag, S. Bordiga, E. Groppo, S. Chavan and R. Blom, Chem. Commun., 2008, 5125–5127 RSC.
- S. Wang and X. Wang, Angew. Chem., Int. Ed., 2016, 55, 2308–2320 CrossRef CAS PubMed.
- F. Wang, Z. S. Liu, H. Yang, Y. X. Tan and J. Zhang, Angew. Chem., Int. Ed., 2011, 50, 450–453 CrossRef CAS.
- J. Zhao, M. A. Holmes and F. E. Osterloh, ACS Nano, 2013, 7, 4316–4325 CrossRef CAS.
- B. Mahler, P. Spinicelli, S. Buil, X. Quelin, J. P. Hermier and B. Dubertret, Nat. Mater., 2008, 7, 659–664 CrossRef CAS.
- J. Cravillon, S. Münzer, S. J. Lohmeier, A. Feldhoff, K. s. Huber and M. Wiebcke, Chem. Mater., 2009, 21, 1410–1412 CrossRef CAS.
- Y. Wang, S. Wang and X. W. Lou, Angew. Chem., Int. Ed., 2019, 58, 17236–17240 CrossRef CAS PubMed.
- J. Qin, S. Wang and X. Wang, Appl. Catal., B, 2017, 209, 476–482 CrossRef CAS.
- S. Wang, W. Yao, J. Lin, Z. Ding and X. Wang, Angew. Chem., Int. Ed., 2014, 53, 1034–1038 CrossRef CAS.
- S. Wang, B. Guan and X. Lou, Energy Environ. Sci., 2018, 11, 306 RSC.
- S. Wang and X. Wang, Appl. Catal., B, 2015, 162, 494–500 CrossRef CAS.
- R. Solanki, J. Huo and J. L. Freeouf, Appl. Phys. Lett., 2002, 81, 3864 CrossRef CAS.
- J. C. Kim, J. Choi, Y. B. Lee, J. H. Hong, J. I. Lee, J. W. Yang, W. I. Lee and N. H. Hur, Chem. Commun., 2006, 5024–5026 RSC.
- S. Liu, F. Chen, S. Li, X. Peng and Y. Xiong, Appl. Catal., B, 2017, 211, 1–10 CrossRef CAS.
- S. Pawsey, K. Yach and L. Reven, Langmuir, 2002, 18, 5205–5212 CrossRef CAS.
- L. Liu, J. Ding, C. Huang, M. Li, H. Hou and Y. Fan, Cryst. Growth Des., 2014, 14, 3035–3043 CrossRef CAS.
- V. P. Indrakanti, J. D. Kubicki and H. H. Schobert, Energy Environ. Sci., 2009, 2(7), 745–758 RSC.
- H. He, J. A. Perman, G. Zhu and S. Ma, Small, 2016, 12, 6309–6324 CrossRef CAS PubMed.
- H. Gu, W. Fan and T. Liu, Nanoscale Horiz., 2017, 2, 277–283 RSC.
- J. Du, M. Yang, F. Zhang, X. Cheng, H. Wu, H. Qin, Q. Jian, X. Lina, K. Li and D. J. Kang, Ceram. Int., 2018, 44, 3099–3106 CrossRef CAS.
Footnote |
| † Electronic supplementary information (ESI) available. See DOI: 10.1039/c9ra08801f |
| This journal is © The Royal Society of Chemistry 2020 |

